Price Momentum
- Göstergeler
- Flavio Javier Jarabeck
- Sürüm: 1.2
- Güncellendi: 8 Temmuz 2021
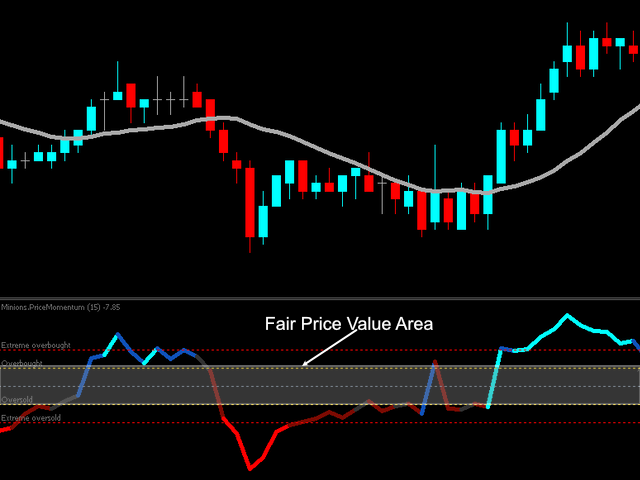
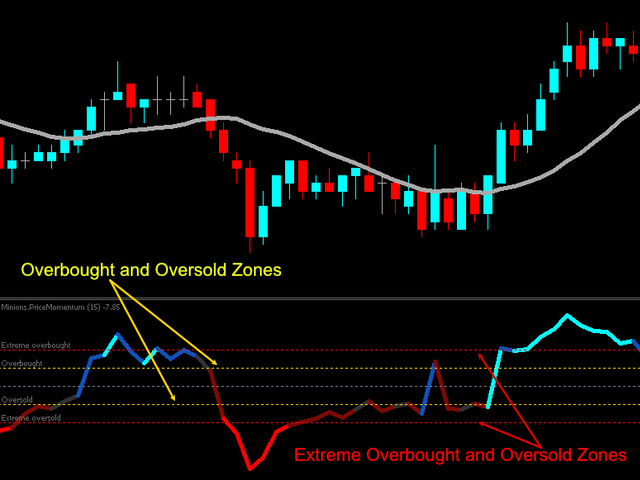
Value Chart indicator presents the Price evolution in a new form. This indicator, Price Momentum, was developed taking all the calculations presented in the book "Dynamic Trading Indicators" by Mark W. Helweg and David Stendahl (2002). The technique involves de-trended Prices from a user-defined Period of analysis and the addition of a Volatility index correction. The result is an Oscillator with 3 zones: Fair Price Value, Overbought/Oversold and Extremely Overbought/Oversold zones.
Adding this indicator to your Price Action analysis and/or in conjunction with other market analysis will bring you more chances of success in your trades.
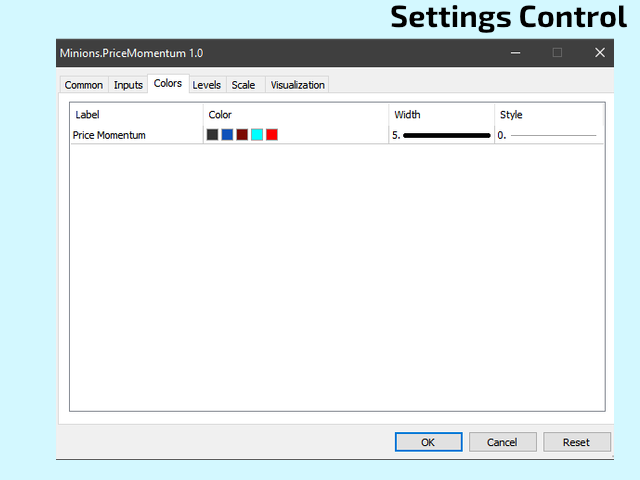
SETTINGS
- Period to analyze
- Extreme Overbought level
- Overbought level
- Oversold Level
- Extreme Oversold Level
- Colors of all Levels
- Moving average Period over the Price Momentum index
As always, if you like this indicator, all I am asking is a little Review (not a Comment, but a REVIEW!)...
This will mean A LOT to me... And this way I can continue to give away Cool Stuff for Free...
With No Strings Attached! Ever!
Live Long and Prosper!
;)


good