Buy Sell Zones1
- Göstergeler
- Mohamed yehia Osman
- Sürüm: 2.1
- Etkinleştirmeler: 5
Buy Sell Zones
Simple indicator for BUY / Sell Zones
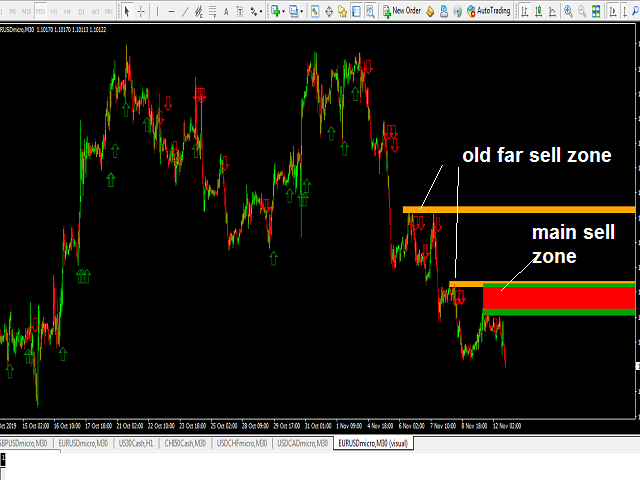
moving Buy and Sell zones : Closest zone is wide and clear : Red for Sell zone , Green for Buy zone >>> old far zones are in bold lines
:::BUY Zones (GREEN) appear only in UP Trend and disappear in DOWN Trend
:::SELL Zones (RED) appear only in DOWN Trend and disappear in UP Trend
input parameters :::
index bars : bars range for zone calculation
levels : number of zones
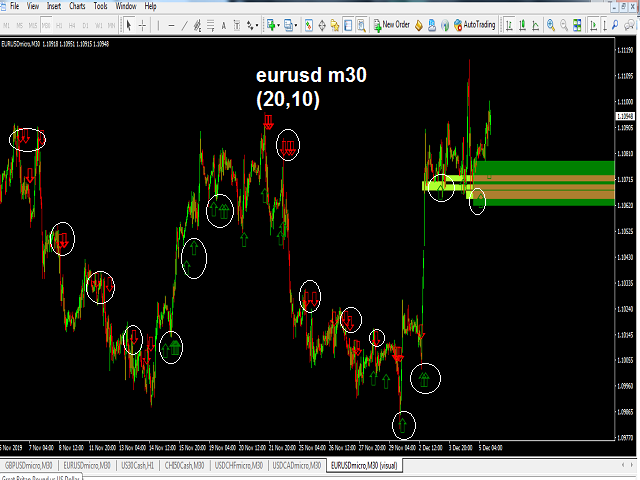
Up move/Down move arrows
mail and message Alerts !!
used on any symbol
used on any timeframe
example used on M30 with GBPUSD and EURUS