Ichimoku Scanner Dashboard
- Göstergeler
- Abir Pathak
- Sürüm: 2.19
- Güncellendi: 16 Şubat 2021
- Etkinleştirmeler: 20
Dashboard uses Ichimoku Strategy to find best trades.
Get extra Indicators/Template:
And read more about detailed Product Description and usage here:
https://www.mql5.com/en/blogs/post/747457
Please note:
I won’t be able to add new settings. It already has 72 settings
Some people are using it with their EAs. And iCustom function can only take Max 64 settings.
So, I cannot let it grow any further.I’ll definitely be maintaining the code and solving issues. Don’t worry
Please check all settings in demo strategy tester before buying.
Checks:
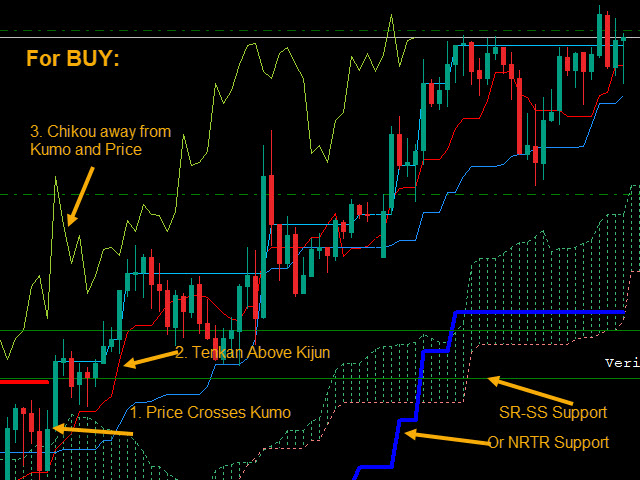
For BUY:
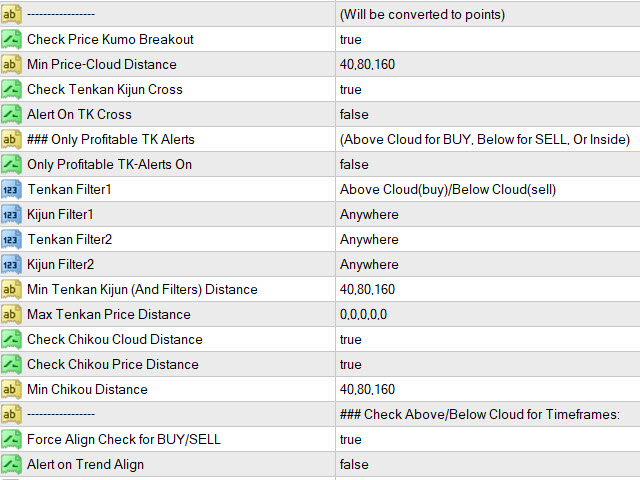
* Price above at least min distance from Kumo
* "Check Tenkan Kijun Cross" true and Tenkan at least min distance above Kijun
* "Check Chikou Cloud Distance" true and Chikou at least min distance away from Kumo
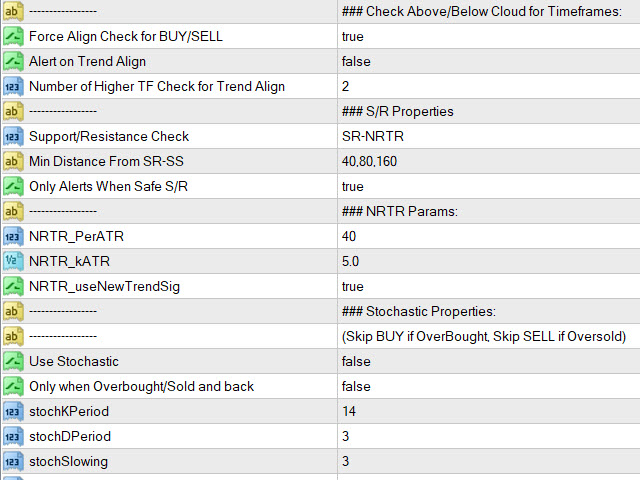
* "Check Support/Resistance" true and price at least min distance away from Resistance
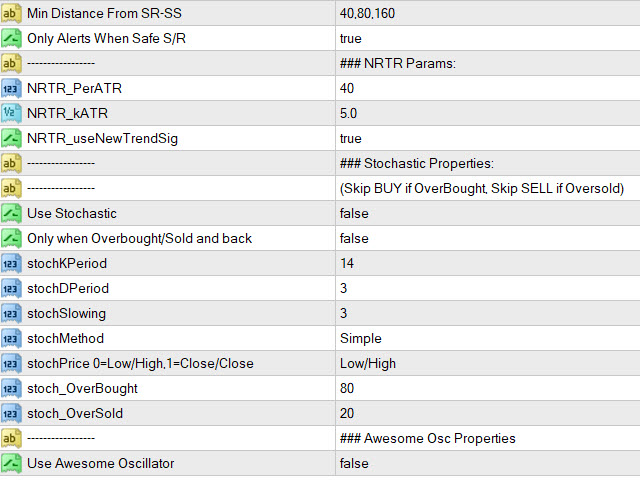
* "Use Stochastic" true and price within safe Stochastic Overbought/Oversold
* "Only when Overbought/Sold and back" true then also check if price was Oversold and back in previous bar.
* "Use Awesome Oscillator" true then check Awesome is above and Green.
For SELL vice-versa
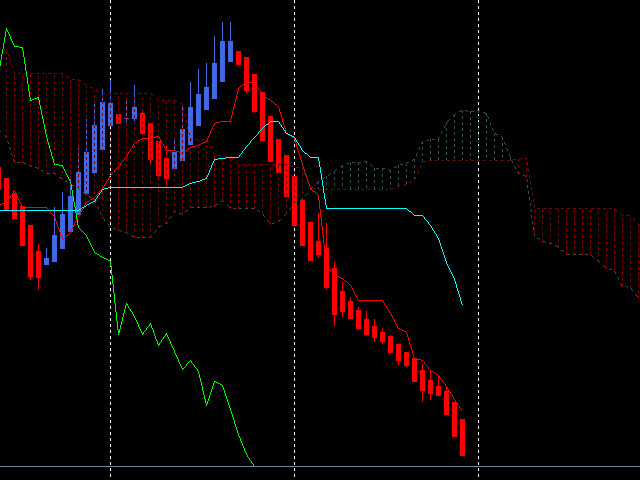
And while trend is continuing, it shows B-Zone/S-Zone.
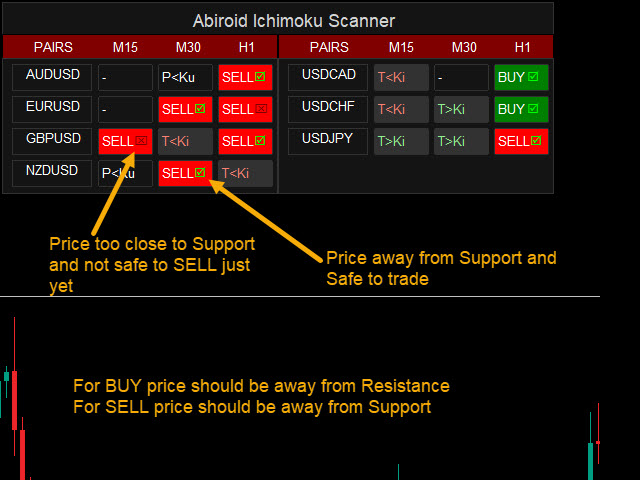
S/R Calculation:
It uses: "SS_SupportResistance_v07.53" indicator. Available as extras in link above.
* "Check Support/Resistance" true
For BUY Check price distance from Resistance. And for SELL check price distance from Support.
8 Using the "Min Distance From S/R" values:
If safe to trade, show a Green Tick in the BUY/SELL buttons. Else show a Red Cross.
So, if your timeframes are M5,M15,M30 and the "Min Distance From S/R" values are 10,20,30.
Then for BUY for M5, check if price is at least 10 points away from Resistance.
(e.g. for EURUSD if resistance is at 1.10050, then price should be at least below 1.10040).
* "Only Alerts When Safe S/R" true get Alerts for only Safe trades.
Ignore alerts for other trades where price too close to Resis(for BUY) or Supp(for SELL)
(Note: Only alerts ignored. BUY/SELL buttons will still light up with black/white diamonds)
NRTR (Optional SR)
Settings:
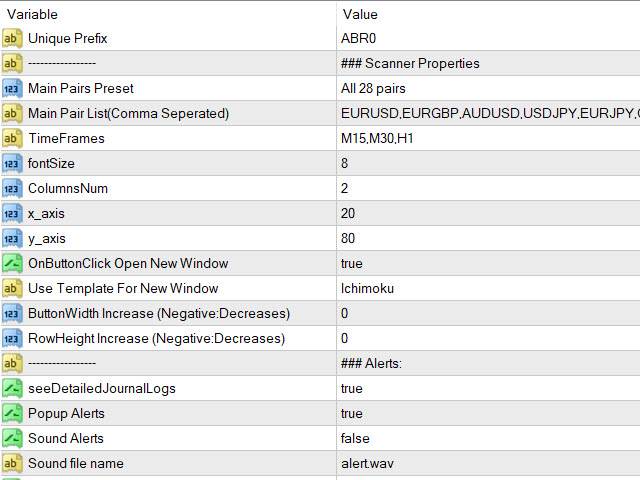
Comma-separated lists:
- Own Pairs or Select pairs list from drop-down like "Forex Core 7", "Forex Core 14", etc.
- Time frames. Possible values: M1,M5,M15,M30,H1,H4,D1,W1,MN1
- Min Distance: 30,40,50
(Converted to points. Eg for H1 EURJPY: if kumo is at 116.800. And this value is 50. It will check if price is at least above 116.850)
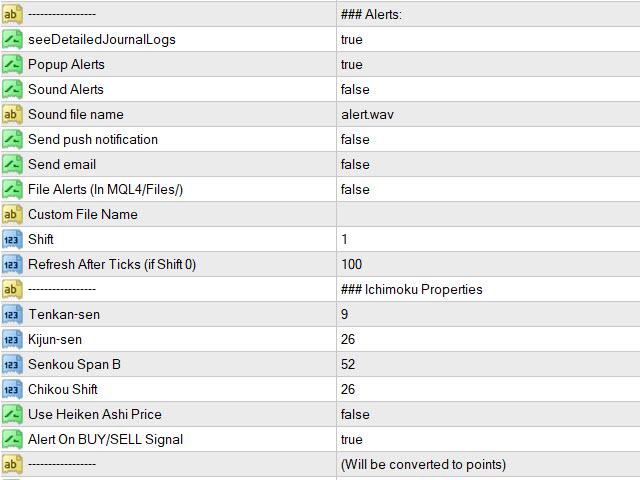
- Settings for showing alerts: Popup, email, sound alerts, etc.
- x_axis, y_axis: to position Scanner
- fontSize: resize whole panel and fonts. Use fontSize between 5 and 8.
- ColumnsNum: No of Columns
- OnButtonClick Open New Window: On clicking any button open that Pair-TimeFrame in a new window with your template:
- Use Template for New Window: Template name without ".tpl". Eg: Create a file Template1.tpl in templates folder and here specify: "Template1".
(only works if previous property set to true). Does not work if on button click is set to open in current window.
- Shift: Bar for which all conditions are checked. 0 (current), 1 (last closed bar)
- Refresh After Ticks (if shift 0): If shift 0, wait for this number of ticks before refreshing.
If using higher timeframes use a much value like 300 or 500.
- Heiken Ashi Price: If true Use Heiken-Ashi bar close price instead of actual bar close.
- Stochastic: If true use stochastic indicator to find good BUY/SELL.
If "Only when Overbought/Sold and back" true: Good BUY if Stochastic went Oversold below 80 and back. Good SELL if went OverBought and back.
- Min Price-Cloud Distance: Minimum distance between price and Kumo.
- Check Tenkan Kijun Cross: true/false
- Min Tenkan Kijun Distance: If above true then check this Min distance between Tenkan and Kijun.
- Check Chikou Span: true/false
- Min Chikou Distance: If above true then check this Min distance between Chikou and Kumo or Chikou and Price.
- Alert On TK Cross: true: Alert when T & K cross and show if cross happens above,below or inside Kumo.
Read more about Scanner Common features in detail here:


Very powerful tool!!!!!! The dashboard gives you a complete outlook at a glance, I have been trading with Ichimoku for quite a while and this is exactly what I am looking for.. And the support from the Author(Abir Pathak) is incredible.