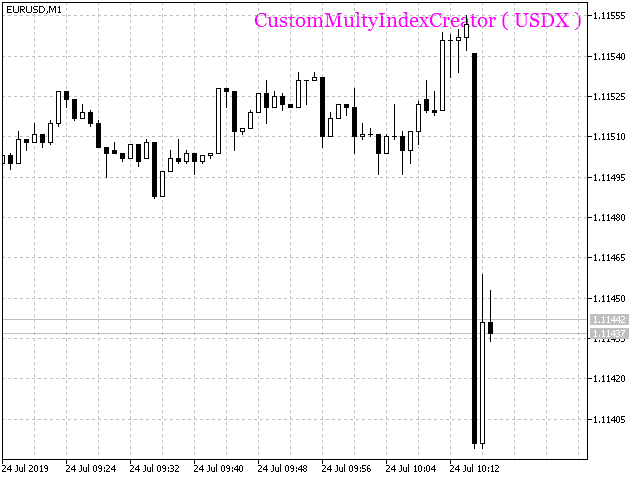
CustomMultyIndexCreator
- Göstergeler
- Nikolay Kositsin
- Sürüm: 1.10
- Güncellendi: 25 Temmuz 2019
- Etkinleştirmeler: 5
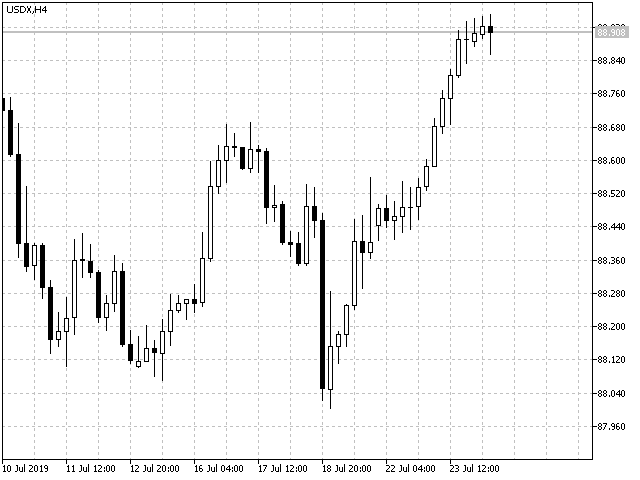
CustomMultyIndexCreator позволяет создавать свой собственный мультивалютный пользовательский символ на основе истории корзины любых финансовых инструментов как среднее геометрическое взвешенное этой валютной корзины и подкачивать его ценовую историю в виде минутных баров. Таким образом, в клиентском терминале Metatrader 5 появляется новый символ, с которым можно работать по аналогии с другими финансовыми инструментами, то есть открывать полноценные графики любого таймфрейма этого символа и проводить технический анализ, располагая на этих графиках любые технические и пользовательские индикаторы.
Особенности
- Индикатор работает на минутном таймфрейме и на любом символе, на других таймфреймах он переключает график на минутный таймфрейм;
- Работая на графике любого финансового инструмента индикатор позволяет создавать свой собственный символ в соответствии с входными параметрами, но временная разметка торговых сессий будет аналогичной тому символу, на графике которого размещён индикатор;
- Для одного пользовательского символа в клиентском терминале Metatrader 5 может быть запущена только одна копия индикатора;
- Присутствие индикатора на графике финансового инструмента отображается наличием его имени в правом верхнем углу графика при настройках по умолчанию с изменением цвета этого имени на каждом тике терминала;
- Доступ ко входным параметрам индикатора осуществляется через Список индикаторов при нажатии клавиш Ctrl+I, или через пункт Список индикаторов контекстного меню правой кнопки мыши на графике расположения индикатора;
- Следует учесть тот факт, что для отображения на старших таймфреймах даже небольшого количества баров, следует иметь огромное
количество минутной истории, из которой эти графики строятся и которая вся будет размещена на жёстком диске (>20Гб/символ)! И
поэтому в такой ситуации единственным выходом будет в настройках клиентского терминала на закладке
Графики в чекбоксе
Максимальное количество баров в окне выбрать нелимитированное количество баров в окне
(Unlimited).
- CurrencyIndex- Имя ипользовательского индекса;
- name of the symbol from which the custom symbol will be created- Имя символа, спецификация которого будет использована в качестве образца;
- exchange currency N- символ для одного финансового инструмента из корзины;
- exchange currency power N- степени, в которые возводятся курсы корзины валют;
- IndexInvert- переворот графика пользовательского индекса по вертикали, то есть получение обратной котировки индекса;
- IndexMultiplier- коэффициент домножения полученных котировок;
- IndexDigits- количество разрядов после запятой при округлении котировок и отображении шкалы цены;
- Smoothing method- метод усреднения полученных котировок (в данном индикаторе итоговые ценовые таймсерии можно усреднить);
- Smoothed period- период усреднения, по умолчанию период усреднения равен пятистам;
-
Smoothed parameter- параметр усреднения, для JJMA изменяющийся в пределах -100 ... +100, Для VIDIA это период CMO,
для AMA это период медленной скользящей;
Входные параметры для отображения текстового имени на графике
- Display the indicator name in the corner of the chart- Отображение имени на графике;
- Font size of the indicator name- размер шрифта имени;
- The offset indicator name horizontal- горизонтальное смещение имени;
- The offset indicator name vertical- вертикальное смещение имени ;
-
The corner of the indicator name on the chart - один из четырёх углов графика для
расположения имени.
Первоначальное знакомство по работе с пользовательскими символами можно сделать, прочитав статью.
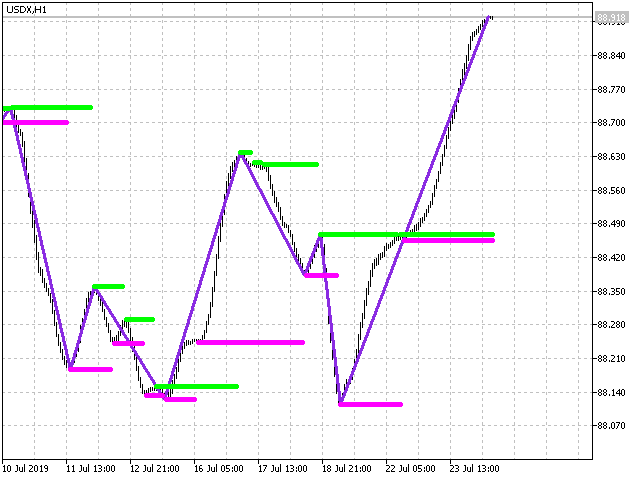
Поскольку индикатор позволяет создавать полноценные графики пользовательских символов для любых финансовых активов, то возможности использования этих графиков для технического анализа, формирования торговых сигналов и тестирования экспертов достаточно неограниченные. С настройками по умолчанию полученные графики пользовательского символа имеют достаточно гладкий вид с чётко обозначенной трендовой составляющей и с отфильтрованным ценовым шумом. На таких графиках можно тестировать практически все имеющиеся в наличии торговые системы.