KT Trend Magic MT5
- Göstergeler
- KEENBASE SOFTWARE SOLUTIONS
- Sürüm: 2.0
- Etkinleştirmeler: 5
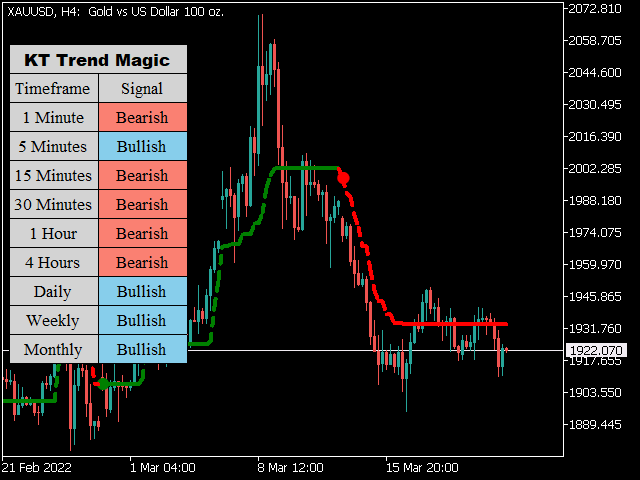
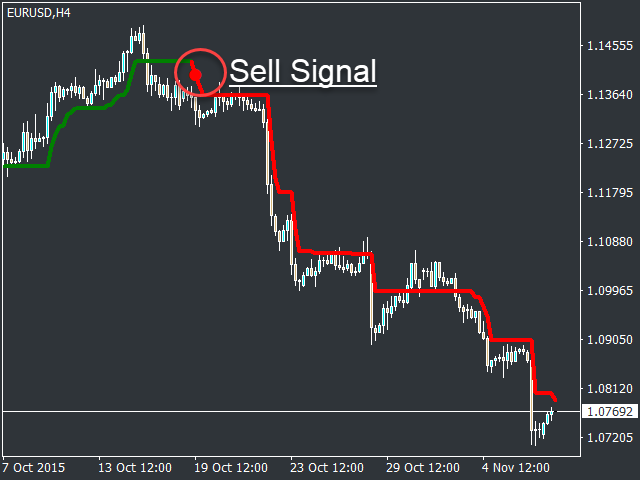
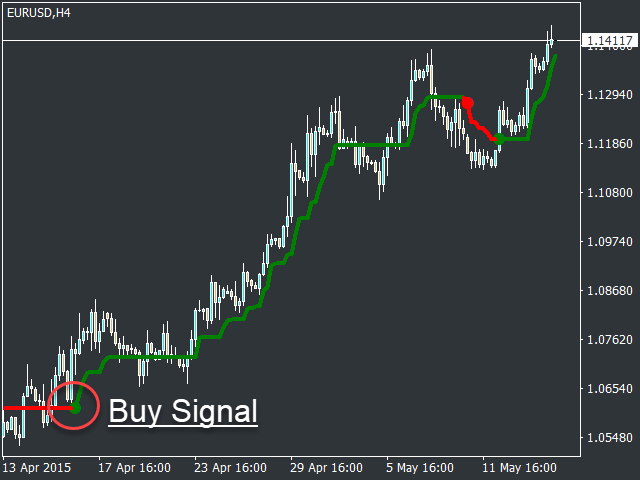
KT Trend Magic shows the trend depiction on chart using the combination of market momentum and volatility. A smoothing coefficient is used to smooth out the noise from the signal.It can be used to find out the new entries or confirm the trades produced by other EA or indicator.
Features
- Drag n drop MTF scanner which scans for the new signals across multiple time-frames.
- Find new entries in the trend direction.
- Improve the accuracy of other indicators when used in conjunction.
- Can be used as a dynamic support n resistance level.
- All Metatrader alerts implemented.
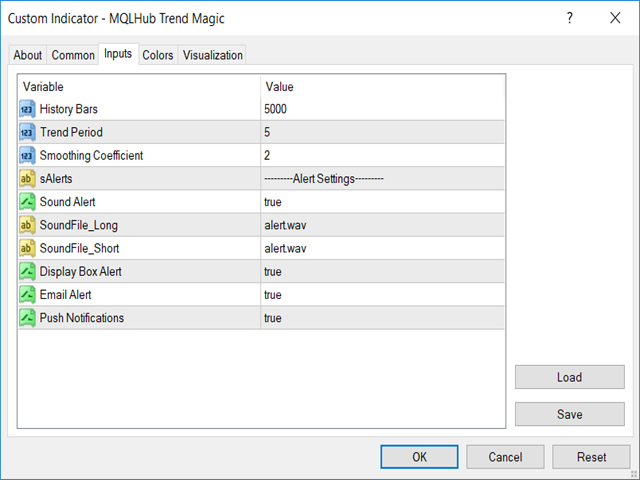
Input Parameters
- History Bars: Numbers of bars to consider for calculation. Lesser History Bars = Low memory consumption.
- Trend Period: Period used for trend and momentum calculation.
- Smoothing Coefficient: Smoothing coefficient to smooth out the noise from data.
- Rest of the inputs are self-explanatory.