CoSMOS4U AdTurtle MT5
- Göstergeler
- COSMOS4U - D. Vezeris & Co, L.P.
- Sürüm: 2.0
- Güncellendi: 23 Kasım 2018
- Etkinleştirmeler: 5
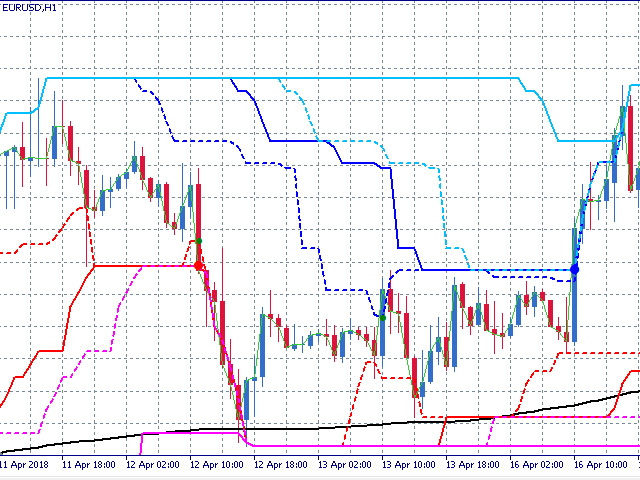
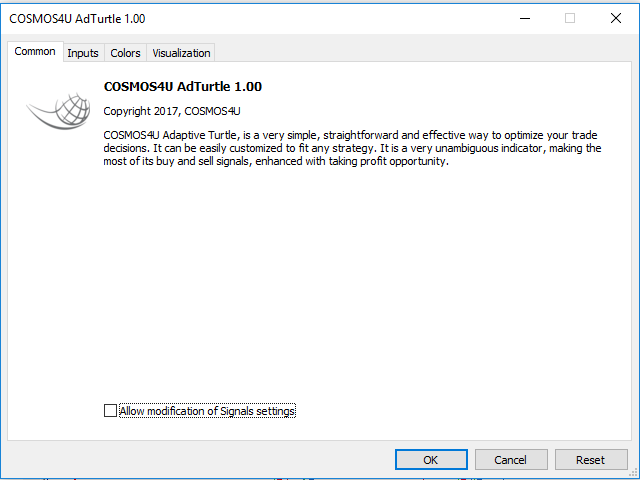
The COSMOS4U AdTurtle is an indicator based on the now classic Turtle trading system. The various high and low Donchian lines around the price bars show you when to open or close your positions. These lines indicate levels which result in the opening or closing of a respective position when the price crosses through them.
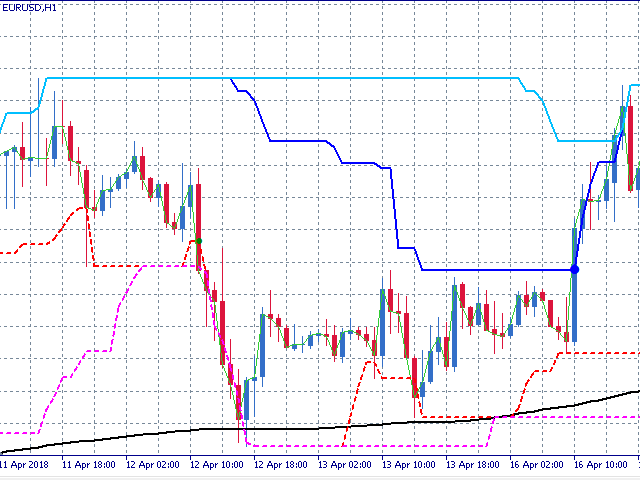
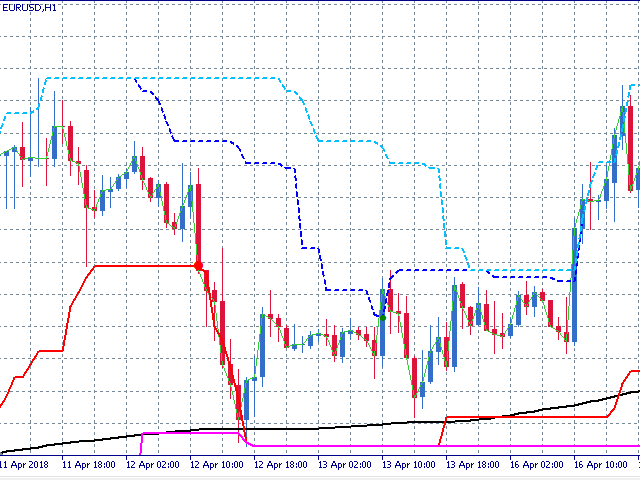
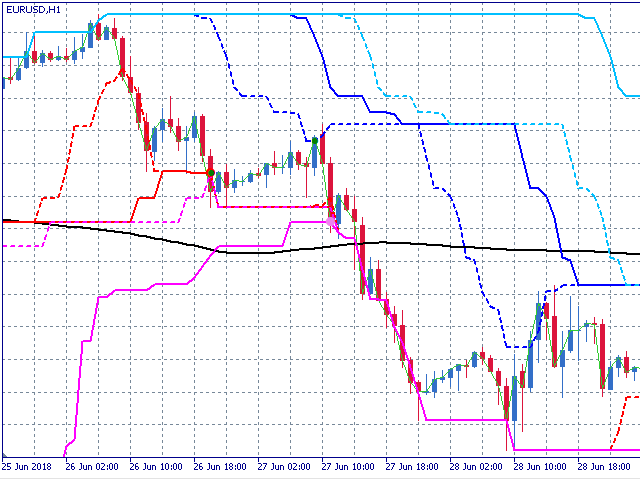
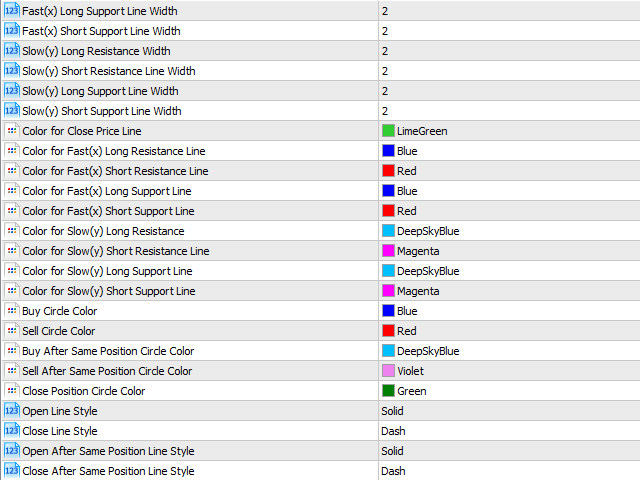
By default, the new position barriers are drawn as solid lines and the exit barriers are drawn as dashed lines. The new long position lines and the close short position lines are drawn in bluish colors, while the new short position lines and the close long position lines are drawn in reddish colors. There is also a second set of lines of longer periods used usually after the same type of position or an already successful position was closed.
The COSMOS4U AdTurtle indicator is highly customizable, allowing you first of all to set the periods of new position lines as well as the dividers of those periods for the exit position lines. You can also customize the color and style of each individual line drawn on your diagrams.
The COSMOS4U AdTurtle indicator can also display buy and sell signals in the form of circles on the chart based on the movements of an asset’s close price through these Donchian Lines.
If the total of 8 high/low lines sounds intimidating, or if you chose to have only long or only short positions for an asset, you have the ability to change the Trading Mode in the COSMOS4U AdTurtle parameters, so that only the relevant lines are shown on your diagram.
The COSMOS4U AdTurtle indicator can work on any asset and in any timeframe.
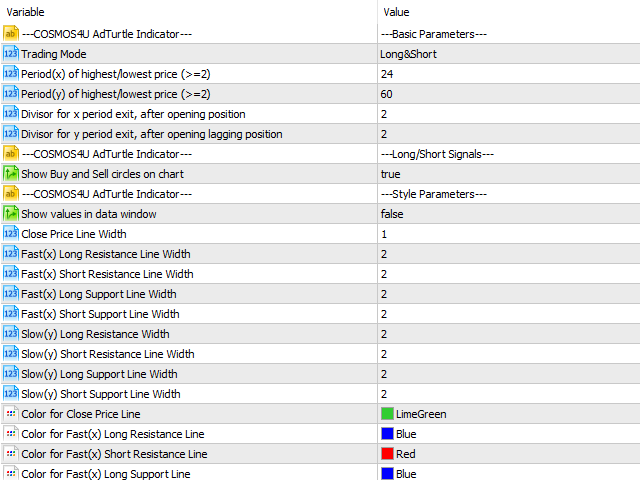
Basic Parameters' Description
- Trading Mode: the indicator shows lines and signals relative to the kind of positions that will be opened “Long&Short”, “Long”, “Short”
- Period(x) of highest/lowest price: how many bars will be used when calculating highs/lows levels for new positions
- Period(y) of highest/lowest price: how many bars will be used when calculating a second pair of highs/lows levels for opening positions if the same type of position was previously closed
- Divisor for x period exit, after opening position: the x/divisor period will be used to calculate highs/lows levels for exiting Short/Long positions that were opened using the first pair of lines
- Divisor for y period exit, after opening lagging position: the y/divisor period will be used to calculate highs/lows levels for exiting Short/Long positions that were opened using the second pair of lines
- Show Buy and Sell circles on chart: draw buy/sell/exit signals on chart in the form of circles
- Show values in data window: show the numerical values of the various lines in the data window
- The rest are 27 style parameters with very clear descriptions that you can use to customize the appearance of your indicator
Be sure to check out COSMOS4U AdTurtle Expert Advisor and our entire range of MetaTrader products on https://www.mql5.com/en/users/cosmos4ucom/seller