• Genel bakış
  • İncelemeler (7)
  • Yorumlar (93)
  • Yenilikler

Candle Power Pro

4.33

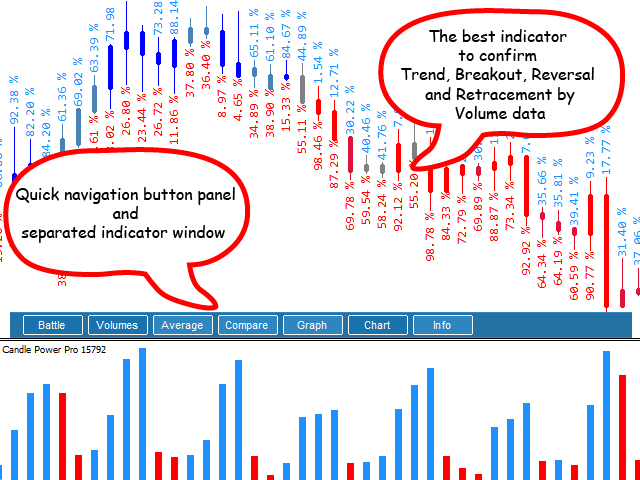
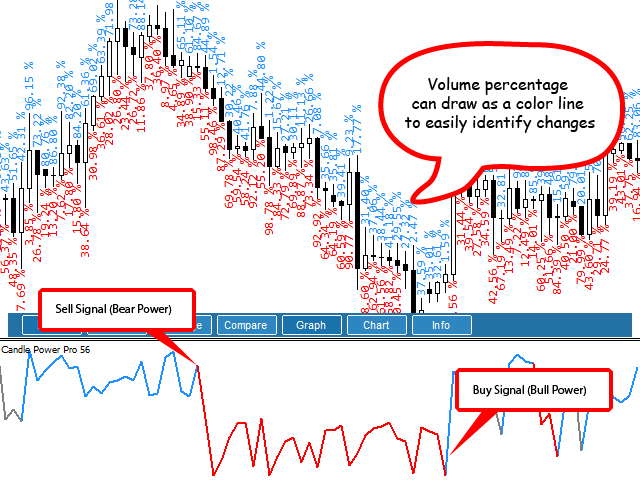
Candle Power Pro göstergesi ile gerçek hacim bilgisinin gücünü ortaya çıkarın. Bu dinamik araç, her mum için gerçek hacim verilerini yakalar ve toplam hacmin yüzdesi olarak sunar. Bunu yaparak, pazarda alıcılar ve satıcılar arasında süregelen mücadeleyi fark etmenizi sağlar.

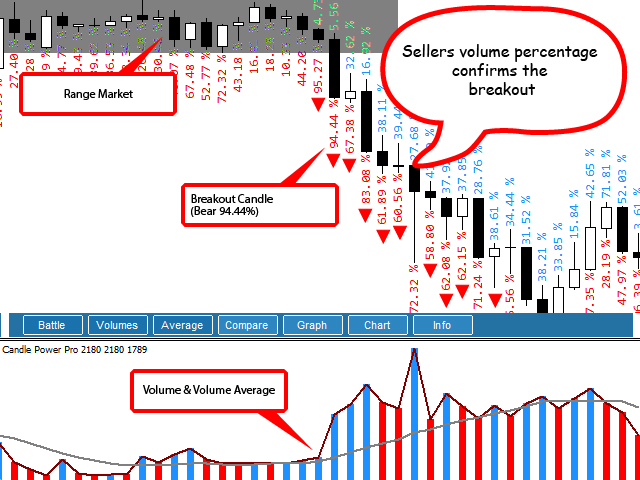
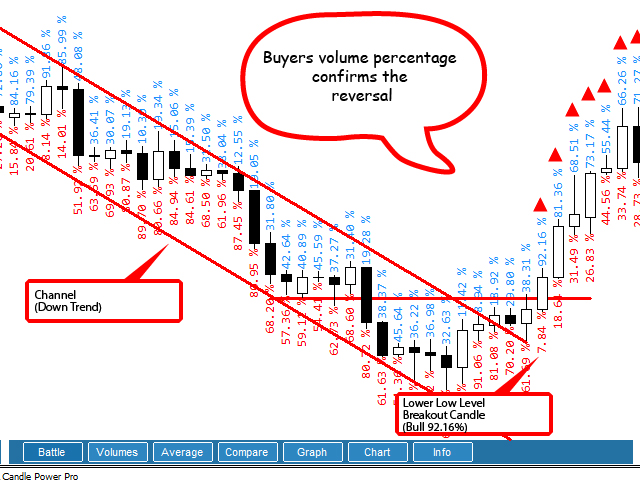
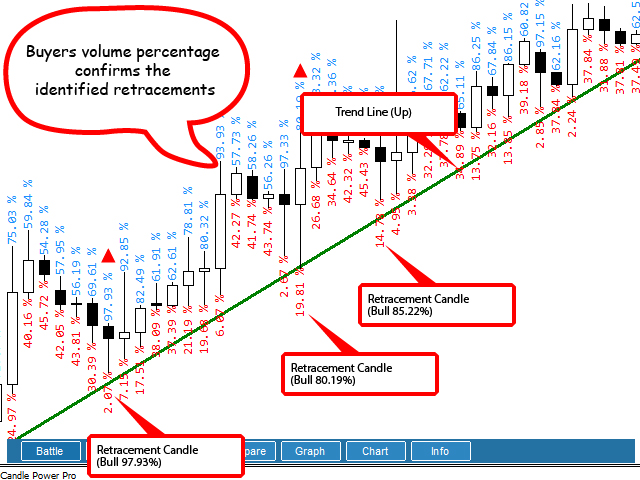
Candle Power Pro, alıcılar ve satıcılar arasındaki savaşı toplam hacmin yüzdesi olarak göstererek size pazar dinamikleri hakkında değerli bilgiler verir. Alıcı ve satıcıların hacmini analiz ederek kırılmaları kolayca onaylayabilir, daha doğru giriş ve çıkış noktaları sağlayabilirsiniz. Ek olarak, alım satım stratejinizin güvenilirliğini artırarak trendleri doğrulamak için alıcı ve satıcı hacmini kullanabilirsiniz. Ayrıca, alıcı ve satıcıların hacmindeki değişiklikleri analiz ederek trend dönüşlerini belirleyebilir, bu da piyasa değişimlerinin bir adım önünde olmanızı sağlar.

Gösterge, ticaret deneyiminizi geliştirmek için bir dizi özellik sunar. Kolay görselleştirme için hacim ortalamalarını çizgiler olarak çizebilir ve daha fazla analiz için hacim yüzdelerini diğer 19 sembolle karşılaştırabilirsiniz. Candle Power Pro ayrıca hacim yüzdesine dayalı olarak renkli mumlar kullanarak pazardaki değişimlerin hızlı bir şekilde tanımlanmasını sağlar. Mobil ve açılır uyarılar sizi önemli piyasa hareketlerinden haberdar ederken, hesap bilgilerine kolay erişim hızlı başvuru sağlar.

Gerçek hacim bilgilerini ticaret stratejinize dahil ederek, değerli bilgiler edinir ve karar verme sürecinizi geliştirirsiniz. Herhangi bir ciddi forex tüccarı için bu uygun fiyatlı ve gerekli aracı kaçırmayın. Şimdi Candle Power Pro'dan yararlanın ve daha akıllıca işlem yapmaya başlayın.


parametreler

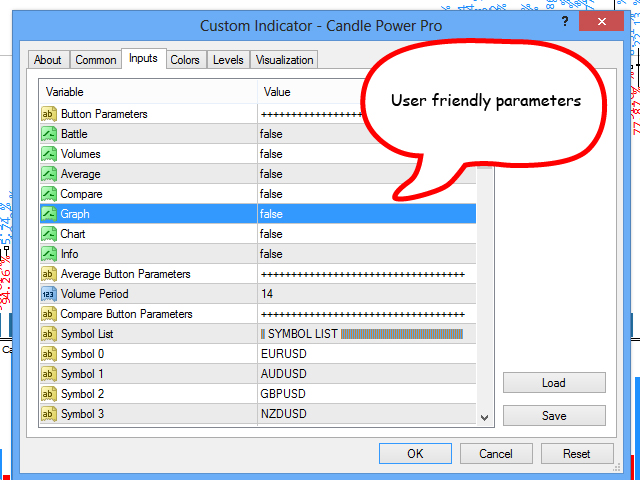
  • Düğme Parametreleri - Etkinleştir/Devre Dışı Bırak   hacimle ilgili özellikler ve özelleştirme ( Savaş, Hacimler , Ortalama, Karşılaştır , Grafik, Tablo ).
  • Savaş Düğmesi Parametreleri
    • Boğa/Ayı Yüzdesi Vuruş Seviyesi - Uyarı için ses yüzdesi seviyesi.
  • Hacim Düğmesi Parametreleri
    • Volume Hit - Ses seviyesi okunu Etkinleştirin/Devre Dışı Bırakın.
    • Volume Hit Level - Ok için ses seviyesi.
  • Ortalama Düğme Parametreleri
    • Hacim Periyodu - Hesaplama için ortalama periyot.
  • Düğme Parametrelerini Karşılaştır
    • Sembol Listesi
      • Sembol 0-18 - Sembol listesi (EUR/USD = EURUSD vb...).
  • Grafik Düğmesi Parametreleri
    • Aralık 1-5 - Mum renkleri için yüzde aralıkları (%90-%100 = Kırmızı renk vb...)
  • Uyarı Parametreleri - Belirli koşullar için uyarıları özelleştirin.
    • Grafik Parametreleri - Görsel görünümü ve renkleri özelleştirin.
    • Ortak Parametreler - Genel gösterge ayarlarını yapılandırın.


    İncelemeler 7
    David T
    226
    David T 2023.08.28 14:08 
     

    After downloading the demo and using it on Strategy Tester I immediately saw how this powerful indicator would greatly assist any trader by providing a VERY powerful confirmation of trade direction when used with price action. Not to be used as a stand alone system but together with some good knowledge of support/resistance or some SMC and makes taking a trade that more reassuring. I then proceeded to rent it for a month and immediately saw so far even after a few hours that what I saw in the tester held up in live markets. The developer was VERY open to my suggestions and was very pleasant to deal with. Very responsive. I honestly believe this is one of the best indicators I have ever found not only here on MQL5 but anywhere else online past and probably in the future and believe me I have seen hundreds if not thousands of indicators. Hidden Gem .

    I have now upgraded to a full purchase. Seller VERY considerate and accommodating to my situation. Best seller I have dealt with honestly. Couldn't be more helpful. I am so thankful to him and now possess this fantastic indicator.

    Anthony Baez
    129
    Anthony Baez 2023.08.14 01:55 
     

    Great Recent Update and provides great info for your confirmation in trades

    Gregory Knobloch
    357
    Gregory Knobloch 2021.10.22 18:33 
     

    I really like it!

    Önerilen ürünler
    MODIFIER V.11 The EA Modifier is based on the Pending Position (PPS) strategy and highly sophisticated secret trading algorithms. The Modifier EA strategy is a combination of secret custom indicators,Candlestick Patterns, Trend Lines, Support & Resistance (Price Action) levels and the most important secret trading algorithms mentioned above. Modifier is a unique and sophisticated EA, can receive and forward manual orders that you send via gadgets and home PCs, anti-floating (if floating occur
    The work of the Stable Pulse bot is displayed in the form of several key mmoments, which can be seen in the screenshots. This development is a scalping system. You can download and test the bot for free this way by yourself making sure of its capabilities. The bot can be tested on different currency pairs and different periods. The main thing is to set the tester settings as shown in the screenshot, for correct testing. You need to trade on timeframes M1-M15. Expert Advisor is designed to trade
    DracoAI is a revolutionary automated forex trading robot based on neural network.  Loss coverage is our premium exclusive feature. DracoAI IS: THE BEST MONEY MAKING SERVICE & STABLE PASSIVE INCOME PROFIT, EVEN IF YOU DO NOT PARTICIPATE IN BIDDING FINANCIAL INDEPENDENCE AND STABILITY DracoAI IS SAFE, BECAUSE: WE GUARANTEE THE SAFETY OF YOUR FUNDS NEGATIVE RESULTS OF TRADING ARE COVERED BY OUR RESERVE FUND 100% CONFIDENTIALITY Monitoring  - most popular signal at MQL5 :  https://www.mql5.com/en/
    Target Striking - One of the best binary options trading tools! It is set up so powerfully that you can trade not only on currency pairs, but also on raw gold oil! You can also try on cryptocurrency! Ideal for trading on currency pairs, the percentage of reliable transactions is more than + 75% The trading tool is already set for the best profit! Only Target Striking can unlock the potential of the trading market for you! With it, the signals are even and accurate without redrawing,
    The Trend Professor is a moving average based indicator designed for the purpose of helping the community of traders to analyse the price trend. The indicator will be displayed in the main chart as it is indicated on the screenshot section. How it works The indicator has lines of moving averages and colored histograms to depict the direction of the trend. There will be a fast signal line colored blue/yellow/red at some points. The red/yellow colored lines stands for bearish trend/signal while th
    Milch Cow Harmonic EA "Tool designed to trade 28 currency pairs according to 88 harmonic patterns plus one customized according to your parameters The expert graph interface guides you to the pattern names when passing over the pattern circle You can activate or disable any number of currency pairs and patterns for your trade by clicking on the currency pair circle or the harmonic pattern (green = activate    red = disable) You can set more than one time frame within which the expert will look f
    Supply and Demand Indicator + FREE Currency Strength Meter ADD-ON Looking for a powerful tool that can help you identify the most reactive zones in the forex market? Our supply and demand indicator for MetaTrader 4 and 5 is exactly what you need. With its advanced algorithms and real-time analysis, this indicator helps traders of all experience levels make informed trading decisions. The supply and demand indicator is a cutting-edge tool that helps traders identify areas where buyers and seller
    Reverse side scalper is the manual trading system, that works on choppy(anti-trend) market. As a rule markets are on 80% choppy and only 20% is trend phase. System is based on custom step Moving and RSI and reverse pattern. System defines up movement, down movement, trend / choppy phases. Indicator plots Buy signal arrow when current direction is down and phase is trend, Sell signal arrow is plotted when currently is up movement and phase is trend. As a rule it allows to "catch" local maximum/mi
    Dear traders I am happy to introduce to you my new tool called "Brilliant Oscillator" Indicator. This is one of the indicators that can be used as a stand alone indicator. WHAT I LIKE ABOUT THIS TOOL IS Fast and reliable signals Purpose The purpose of this tool is to assist both newbie and Advanced traders to analyze the market with high level of accuracy in both bearish and bullish market trends. The inputs In the input section you will be able to change colors of the indicator only. Currency p
    Swing trading is a method in which traders attempt to take advantage of market fluctuations. They buy a security when they believe the market will rise and sell if they feel the market will fall, which, as you can imagine, is common in most trading strategies, irrespective of trading style. The four most frequently occurring patterns in the swing trading domain are reversal, retracement (or pullback), breakouts, and breakdowns. it work all currency pair, and work all timeframe 100% non repa
    Urgently
    Tatiana Savkevych
    The Urgently indicator is designed to quickly determine the situation in the market, reflect the state of the market and signal profitable levels for opening trades. Market conditions change quickly enough, requiring constant calibration of trading strategies. Recommended for use in conjunction with any of the oscillators. The Urgently forex market trend indicator shows the trend direction and entry points. It smooths out price fluctuations when generating a signal by averaging the data and the
    TPO Profile MT4
    Kyra Nickaline Watson-gordon
    5 (1)
    Definition : TPO is a Time Price Opportunity. Instead of using bars or candles with an Open, High, Low, and Close price, each "bar" in a Market Profile is represented by horizontal bars against the price It is called Market Profile terminology. In other words time-price-opportunity (TPO) profiles are histograms of how much time was spent at each price within the span of the profile. By using a TPO chart, you are able to analyze the amount of trading activity, based on time, for each price lev
    Weddell Pro
    Dmitriy Kashevich
    Weddell Pro is a good trading tool that is suitable for both a beginner and an experienced trader. It can be used both separately and combined with other strategies and indicators Configured for currency pairs was tested several times on cryptocurrency but did not show a high result Currency pairs USD/EUR AUD/CAD GBP/USD Showed itself very well here The percentage of correct transactions is above 68%, which does not make it perfect and bad Doesn't draw or disappear The red arrow sho
    Candle EA MT4
    Mansour Babasafary
    4.58 (38)
    This expert is based on patterns The main patterns of this specialist are candlestick patterns Detects trends with candlestick patterns It has a profit limit and a loss limit, so it has a low risk The best time frame to use this expert is M30 time frame The best currency pairs to use with this expert is the EURUSD, GBPUSD, AUDUSD, USDCAD currency pairs The price will increase by 100$ after every 10 purchases! Final price 2450$ Get a 50% bonus by buying (or even renting) any of our product
    2 Copies left.. Royal Trend Indicator will close for public from 01 September 2022. Royal Trend Indicator   This is a Trend Indicator for MT4 Providing Signal To Enter The Position At The Best Time    It can be applied to any financial assets:  F orex, Cryptocurrencies, Metals, Stocks, Indices .    Benefits of the Royal Trend Indicator Entry Signals At The Best Possible Level The indicator algorithms allow you to find the ideal moments to enter a deal (buy or sell an asset), which increa
    here is a link to back test results https://youtu.be/9BYDwS9aaqM https://youtu.be/iLxh43HV91Y However, the difficult task here for traders is to understand and select the indicator or tool that can help them with their trading plan and benefit their trading style. Traders want a tool that requires minimal effort and provides as much support as it can. There are multiple reasons for which traders need an indicator. One such reason is to determine the buy-sell signals in the market. The
    This indicator is, without a doubt, the best variation of the Gann Angles among others. It allows traders using Gann methods to automatically calculate the Gann angles for the traded instrument. The scale is automatically calculated when the indicator is attached to the chart. When switching timeframes, the indicator recalculates the scale for the current timeframe. Additionally, you can enter your own scales for the Gann angles. You can enter your own scales either for both vectors or for each
    Dear Trader It is my pleasure to introduce to you my tool called the " Forex Sniper Indicator" . The major aim of this tool is to help serious traders and investors in all type of Financial Markets to catch price next movement right at the moment the price direction is about to change. This tool can be used to snipe the price direction in both down trend, uptrend and ranging markets. This tool can be used as the stand alone tool though it may be combined with other tools as well. My goal is to h
    Hareketli Ortalama Döviz Gücü Gösterge Tablosu,   birden çok simge ve zaman diliminde para birimi momentumu hakkında derinlemesine bilgi sağlayan güçlü ve kapsamlı bir göstergedir. Bu sağlam araç, en son geçiş noktalarını belirlemek için hareketli ortalamalardan yararlanır ve mevcut fiyata kadar para birimlerinin gücünü etkili bir şekilde izler. Sezgisel tasarımı ve kullanıcı dostu arayüzü ile bu pano, bilinçli kararlar vermek isteyen yatırımcılar için zengin bilgiler sunar. Bu kontrol paneli
    This EA is designed to enter orders without the use of martingales, to maximize the correct entries this EA uses special filters specially designed for the indicated currency pairs, also uses direct relation with other TimeFrames, besides the MACD. It has input capability in the opposite direction of movement (reverse) if the trader so wishes. The position is plotted by a stoploss and static takeprofit based on price. Operation : You work with regular variable spread brokers and generally
    This  Expert adviser developed on Prop Trader VP( Patrick Victor) From No Nonsense Fx.  It is an automated trading system that uses 100% technical indicators with very complex settings and some hidden Mathematical calculations to open and close trades. Trade different times for each day. It doesn't use the grid, martingale, or other dangerous money management methods. It has a lot of Entry and Exit Methods, and Every Trade is Stop loss protected. Download Preset file  Features: Every trade is
    Market Structure Zig Zag
    Lesedi Oliver Seilane
    4.77 (22)
    Free Market structure zig zag to assist in price action trading the screenshots describe how to use and how to spot patterns new version comes with alerts, email alert and  push notification alert can be used on all pairs  can be used on all timeframes  you can add additional confirmation indicators the indicator shows you your higher high and low highs as well as your lower lows and lower highs  the indication makes price action analysis easier to spot.
    FREE
    Günlük Tüccar   Bu gösterge, RPTrade Pro Solutions sistemlerinin bir parçasıdır. Günlük Trader, yalnızca istatistikleri kullanan günlük bir göstergedir. Herkes tarafından kullanılmak üzere tasarlanmıştır, ticarete yeni başlayanlar bile kullanabilir. ASLA yeniden boyamaz. Endikasyonlar yakından kapana doğru verilmiştir. Tek başına kullanılmak üzere tasarlanmıştır, başka bir göstergeye gerek yoktur. Size Açık ve basit göstergeler verir O nasıl çalışır İstatistik sistemi, sembol davranışında f
    Information about this tool Generally: The Smart Trend Indicator STI is designed for the purpose of showing you the direction of the trend.   How it works It is based on moving averages. The indicator works on all types of markets. The indicator works on all timeframes. The indicator works on all currency pairs. This indicator doesn't repaint. The light green histograms are for bullish trend. The green histograms are for fast buy signals. The light red histograms are for bearish trend. The d
    Ticks Size
    Viktor Kolmakov
    This indicator displays in a separate window the difference between the number of points which increased the price, and the number of points that decreased the price during the time interval specified in the settings. The time interval for calculation is expressed as the number of bars of the chart the indicator is attached to. This approach allows you to evaluate the movement direction (growth or fall) of the instrument's price, the strength of the movement and the size of the movement in point
    FFB Isis Scalper
    Andre Camara De Mattos -
    Introducing ISIS SCALPER for MetaTrader 4: Innovation Beyond the Traditional! Discover the future of trading strategies with our innovative indicator, carefully designed to transcend the limitations of conventional products. This is not just another indicator, but a flexible and powerful tool that empowers traders to explore the full potential of the market. Exceptional Features: Unlimited Versatility: Designed to adapt to any asset and time frame, our indicator allows you to create custom strat
    This indicator prepared by using 311,1298 days Haskaya Trend Bandse and Calculates the strand ADX.    This system can be used for 5M time frame.     This system is for Long term and profitable.    Signals are shown as arrows. as an optional,    you can set a voice alarm or email notification    You can fins our other products from link : https://www.mql5.com/en/users/drbastem/seller    Also, you can ask all your questins from email : haskayafx@gmail.com or mobile : +90 530 867 5076 or @Meh
    Impulse fractals indicator - is counter-trend oriented complex market fractal pattern.  Market creates bull/bear impulse, trend starts, fractals on impulsed wave are an agressive pullback signals. Buy arrow is plotted when market is bearish and it's impulse showed up-side fractal, and sell arrow is plotted when market is bullish and it's impulse showed dn-side fractal. Main indicator's adjustable inputs : impulsePeriod - main period of impulse histogram  filterPeriod  - smoothes impulse accordi
    License required to run all EAs created by Forex Forensics 101 LLC.  How to use: - Download from marketplace - Move to 'Indicators' folder, can not be in folders within the 'Indicators' folder Disclaimer: Forex Forensics 101 LLC is not affiliated with anyone selling an EA created through Forex Forensics 101 LLC. As such, the buyer is responsible for all wins and losses they may experience. Trading the forex market is high risk. You should always consult an expert before risking any capital. 
    This is  a dashboard indicator that displays the auto-calculated risk lot, with the given risk percentage & risk points (Stop Loss) and others. The main function of this indicator is to help you calculate your exact scalping risk lots and swing risk lots. Also it displays the active trades of each pair you've executed with the following: type of trade, lot size, symbol, & equity(+/-). Also displays the bar counter set in every 5-minute bar timer. (whichever time frame you're active, the bar time
    Bu ürünün alıcıları ayrıca şunları da satın alıyor
    Mucizevi Forex Göstergesi Tanıtımı: Keskin Ticaretin Gücünü Serbest Bırakın Tüm zaman dilimlerinde gerçekten olağanüstü sonuçlar sunan en iyi Forex göstergesini aramaktan sıkıldınız mı? Artık aramayın! Mucizevi Forex Göstergesi, ticaret deneyiminizi devrimleştirip kazançlarınızı yeni zirvelere taşımak için burada. Gelişmiş teknoloji ve yılların özenli geliştirmesi temelinde Mucizevi Forex Göstergesi, döviz piyasasında güç ve keskinlik açısından doruğa çıkar. Bu olağanüstü araç, tüm seviyelerdeki
    TrendMaestro
    Stefano Frisetti
    5 (2)
    note: this indicator is for METATRADER4, if you want the version for METATRADER5 this is the link: TRENDMAESTRO recognizes a new TREND in the bud, he never makes mistakes. The certainty of identifying a new TREND is priceless. DESCRIPTION TRENDMAESTRO identifies a new TREND in the bud, this indicator examines the volatility, volumes and momentum to identify the moment in which there is an explosion of one or more of these data and therefore the moment in which prices have strong probability of f
    Gann Swing Structure
    Kirill Borovskii
    5 (1)
    This indicator is based on the mathematics of the great trader W.D. Ganna. With its help, you can easily find strong levels by analyzing swings to find the optimal entry point. The indicator works on all instruments and all timeframes. The indicator is fully manual and has control buttons. All you need to do is press the NEW button, a segment will appear, which you can place on any movement, swing or even 1 candle that you want to analyze. By placing the segment, press the OK button. A grid (th
    Weis Wave with Alert
    Trade The Volume Waves Single Member P.C.
    4.79 (19)
    Rental/Lifetime Package Options and Privileges' * For optimum results the yearly or lifetime package is suggested due to live training and Discord  channel trading with the  creator! Rent Monthly Six Months   Yearly/Lifetime Weis Wave with Speed with Alert+Speed Index x x x Manual  x x x Quick Set up Video x x x Blog x x x Lifetime Updates x x x Setup and Training Material x x Free Rectangle Break Alert Tool      x Discord Access Channel "The SI traders" x 2-hour live methodology traini
    The breakout algorithm is a technique based on price, price features, to shape a breakout strategy. The strategy in this indicator will not be redrawn (none-repaint indicator), it is suitable for short or long term traders In the screenshot is the EURUSD pair, these currency pairs, commodities or stocks, it have similar strength *Non-Repainting (not redrawn) *For Metatrader4 Only *Great For Scalping *Great For Swing Trading *Arrow Entry, Green is Long, Red is Short *Works On Any Timeframe *Work
    System Trend Pro - This is the best trend trading indicator!!! The indicator no repaint!!!   The indicator has   MTF   mode, which adds confidence to trading on the trend (   no repaint   ). How to trade? Everything is very simple, we wait for the first signal (big arrow), then wait for the second signal (small arrow) and enter the market in the direction of the arrow. (See screens 1 and 2.) Exit on the opposite signal or take 20-30 pips, close half of it, and keep the rest until the oppo
    Full Forex Market View Dashboard
    Opengates Success International
    5 (2)
    TAM FOREX PİYASASI GÖRÜNÜMÜ Pano Göstergesi Bu, Yatırımcılara piyasada neler olup bittiğine dair tam bir görüş sağlamak için oluşturulmuş özel bir göstergedir. Piyasaya erişmek ve başarılı ticaret yapmak için gereken her türlü bilgiyi görüntülemek için gerçek zamanlı bir veri kullanır. KURULUM: Bu Göstergeyi pencere grafiğinize eklemeden önce, MT4'ünüzün Piyasa İzleme paneline gidin ve ihtiyaç duymadığınız veya ticaret yapmadığınız tüm Döviz çiftlerini GİZLEYİN ve geri kalanını orada bı
    SMCpro VIP MT4  Original Price  $620   ---  Currently Price 20% OFF ( for unlimited use )   BONUS  AUX VIP Club 2024 : Include  EA Airbag  and  Load Data History  to enhance the performance of this tool to its maximum potential  Click Here to Download Files   ( for users only )   Hello World! Introducing.. SMCpro VIP tool and Indicator for MetaTrader 4, designed to revolutionize your trading experience with the ICT Smart Money Concept. This system is meticulously crafted to empower trad
    Idea: RSI ( Relative Strength Index) and CCI ( Commodity Channel Index ) are powerfull to solved the market.  This indicator has Smoothed Algorithmic signal of RSI and CCI. So that, it separates the market into buy and sell zones, these areas are marked with arrows, red for downtrend, green for uptrend. This algorithm has the effect of predicting the next trend based on the historical trend, so users need to be cautious when the trend has gone many candles. Please visit screenshots
    Full STO
    Roman Smoroda
    Tam STO göstergesi (üç STO göstergesinin tüm sürümlerini içerir: Premium, Gold, Silver) - STABLE TRADE OPTION, otomatik ikili opsiyon ticareti için tasarlanmıştır.  DİKKATLİCE OKUYUN!!!!! ÖNEMLİ Bir terminalde farklı sürelere sahip iki şablon oluşturun: 18:01, 18:02 için 1 ila 15 dakika arasında süreleri olan bir şablon ve 22:00 için 10 ila 20 dakika arasında süreleri olan bir şablon. Kazanma oranı: Son 5 yılda %71 Para yönetimi: Mevduattan %0,3 Göstergenin bu sürümü yalnızca Gümüş ve
    Gann Zone Pro
    Kirill Borovskii
    This indicator identifies and displays zones, as it were areas of strength, where the price will unfold. The indicator can work on any chart, any instrument, at any timeframe. The indicator has two modes. The indicator is equipped with a control panel with buttons for convenience and split into two modes. Manual mode: To work with manual mode, you need to press the NEW button, a segment will appear. This segment is stretched over the movement and the LVL button is pressed. The level is displayed
    "Dragon's Tail" is an integrated trading system, not just an indicator. This system analyzes each candle on a minute-by-minute basis, which is particularly effective in high market volatility conditions. The "Dragon's Tail" system identifies key market moments referred to as "bull and bear battles". Based on these "battles", the system gives trade direction recommendations. In the case of an arrow appearing on the chart, this signals the possibility of opening two trades in the indicated directi
    Intro to APAMI, PROfessional edition Trace exactly how far prices trend between two price levels with fractional pip precision, while qualifying price movement between the same price levels. Completely automate when trends change direction and volatility, without any lag .  This is possible because the Accurate Price Action Measurement Indicator (APAMI) actually does what no other indicator can:  measure price distance between two points and simultaneously qualify the price action that occurs
    Fibonacci Retracements Pro
    Savia Forex Software Solutions
    Fibonacci Retracements Pro The Fibonacci Retracements Pro is a powerful yet easy to use indicator. It automatically plots all the important Fibonacci retracement and extension levels for you. FRP is dynamic powerful and seamlessly adjusts to whatever timeframe you are analyzing. Fibonacci Retracement Pro is optimized for ALL timeframes and ALL Currency pairs, Indices, Commodities, and Cryptocurrency pairs. Trade with improved confidence and maximize your success rate. Benefits Dynamic and Power
    The Stochastic Basket Currency Strenght  brings the Stochastic indicator to a new level.  Expanding the boundaries of TimeFrames and mono-currency analysis, the SBCS take the movements of each currency that composes the cross and confront them in the whole basket of 7 crosses.  The indicator works with any combination of AUD, CAD, CHF, EUR, GBP, JPY, NZD, USD pairs and with full automation takes in account every stochastic value (main line) for the selected Time Frame.  After that, the indicator
    Fnix l long position
    Monique Ellen Miranda Dos Santos
    Finansal piyasada uzun vadeli fırsatlar arayan bir yatırımcı mısınız? Size Özel Uzun Vadeli Trend Göstergesi'ni tanıtmaktayım. Bu gösterge, günlük, haftalık ve aylık grafiklerden daha uzun zaman dilimlerinde pozisyon almak isteyen trader'lar için tasarlanmıştır. Net ve kesin sinyallerle, bilinçli kararlar almanız için ihtiyacınız olan desteği sağlayacaksınız. Ana özellikler: Uzun Vadeli Strateji: Bu gösterge, uzun vadeli ticaret yapmaya kararlı yatırımcılar için mükemmeldir. Önerilen Zaman Dilim
    Daotradingfx
    Huynh Cong Chinh
    Title: "Daotradingfx - The Perfect Key for Wave Trading with 7 Years of Experience" Forex trading is never easy, but with the daotradingfx indicator, I have found a reliable partner, unlocking the door to success in wave trading. Built on the foundation of my 7 years of trading experience, this indicator is not just a tool; it is a comprehensive canvas of market understanding and convenience in trading. Daotradingfx stands out with its ability to use multiple timeframes, a crucial feature t
    Channel Cluster
    Vitalyi Belyh
    5 (2)
    Cluster indicator working in the price channel. For operation, the indicator builds a channel line - (dashed line). Inside the channel, cluster sections are determined that determine the direction of the price movement - (histograms in two directions), start with large arrows. Small arrows are plotted above / below each histogram - indicator increase volatility. The indicator does not redraw the values. Works on any tools and timeframes. Entrances are made when large arrows appear, inside s
    Introducing the "Magic Trades" for MetaTrader 4 – your ultimate tool for precision trading in dynamic markets. This innovative indicator revolutionizes the way you perceive market trends by harnessing the power of advanced analysis to detect subtle changes in character, paving the way for optimal trading opportunities. The Magic Trades Indicator is designed to empower traders with insightful entry points and well-defined risk management levels. Through its sophisticated algorithm, this indica
    Oni Scalper
    Goh Cheng Wai
    5 (2)
    Dear Onis, This Indicator is used for   GBPUSD, US30 and GOLD on 1-Min Chart . For US30 , Depending on your broker, Minimum Lot Size will differ from 0.01 to 1.0 lots. My Current Account is trading at 1.0 lots at $1 per point . Please check with your Broker what's the Margin Required for your Minimum lot sizes before you trade on your Real account. I have Forward Tested the indicator for around 6 months before releasing it to the public. ( No Demo is available for the Indicator, Strategy
    VTrende Pro mt4
    Andrii Diachenko
    3 (2)
    VTrende Pro MT4 - MTF indicator for trend trading with a display panel for MT5 *** Videos can be translated into any language using subtitles (video language - Russian) Although the signals of the VTrende Pro indicator can be used as signals of a full-fledged trading system, it is recommended to use them in conjunction with the Bill Williams TS. VTrende Pro  MT4 is an extended version of the VTrende indicator. Difference between Pro version and VTrende: - Time zones - Signal V - signal 1-
    Clidro FX
    Mahmood Abdur Rafey Siddiqui
    Clidro FX is a complete trading system designed and developed by Auxrum Analytics targeting the EURUSD, USDJPY, and GBPUSD FX pairs. It is currently available to MetaTrader 4 users. The Clidro FX algorithm, along with the optimized money-management and order-management rules sets up the basis for excellent trading results consistently over an extended period of time. The fundamental premise of the system is that each FX pair displays its unique quantitative characteristics while oscillating thro
    Automatic, live & interactive picture of all trendlines. Assign push, email and sound alerts to the lines of your choice and be informed about price rollback, breakout, rollback after breakout, number of rollbacks, line expiration by double breakout. Correct, drag or delete the lines and interactively tune the line system. https://youtu.be/EJUo9pYiHFA . Chart examples https: //www.mql5.com/en/users/efficientforex Price Interaction Events All events are effective immediately and only after on
    The indicator displays the probable ( Support and resistance ) levels. The indicator draws horizontal and trend levels of support and resistance. The indicator settings: Trends - the mode for displaying trend lines or horizontal lines of support and resistance Yes - display trend lines only No - display horizontal lines only UseResource - use the resources built into the indicator. Yes - use the ZigZag indicator from the resources of the product. No - use a custom ZigZag indicator. HistoryBar -
    The indicator of a Professional Trader is an arrow indicator for predicting the direction of price movement. I have been working on this indicator since 2014. You can use this indicator as your main indicator, use its entry signals, and use it as your only indicator to find entry points. About the product: Recommended TF [H4-D1-W1]   . The indicator predicts the direction of the next candle. Fits a variety of tools; Flexibility in settings for different instruments and intervals through the
    The [GRAFF] III manual trading system is based on multiple MetaTrader (MT4) indicators. Together, the entire PACK of GRAFF III indicators makes an advanced trading tool. The system consists of over 20 different custom-built indicators which have been carefully selected and tested in the long term to produce strong and efficient trading signals. The particular indicators are based on different mathematical formulas, so the entire system is calibrated to remove false signals from its own indicator
    This indicator allows you to see the strength of the trend on all timeframes. It can be used for all currency pairs. The indicator can be displayed in the form of a column (from left to right): status buy / sell / strong buy / strong sell, strength of the trend in percentage, pips last candle, body candle now, remaining time, and the timeframe of M1 to MN. Information contained below (from left to right): total trend percent, sell percent, buy percent.
    You can fins our other products from link : https://www.mql5.com/en/users/drbastem/seller   Also, you can ask all your questins from email : haskayafx@gmail.com or mobile : +90 530 867 5076 or @MehmetBastem    on telegram application This indicator is used to determine the trend. Standard Osma indicator is used. It has the indicator warning system: beep, e-mail and has three types of alerts, including messages to mobile phone. It shows the best performance on the chart of 5 minutes. When the
    You can fins our other products from link : https://www.mql5.com/en/users/drbastem/seller   Also, you can ask all your questins from email : haskayafx@gmail.com or mobile : +90 530 867 5076 or @MehmetBastem    on telegram application This indicator is used to determine the trend. Standard Three Moving Average and ADX indicators are used. It has the indicator warning system (audio, e-mail) and three types of alerts, including messages to mobile phone. It shows the best performance on M5. When
    Yazarın diğer ürünleri
    RSI Geçiş Uyarısı,   ticaret stratejilerinde   Göreceli Güç Endeksi'ni (RSI)   kullanan tüccarlar için özel olarak tasarlanmış güçlü bir bildirim sistemidir. Bu gösterge, hızlı RSI çizgisi yavaş RSI çizgisinin üstünden veya altından geçtiğinde meydana gelen RSI geçişlerini belirlemeye odaklanır. Gösterge, bu geçişleri birleştirerek yanlış sinyalleri etkili bir şekilde filtreleyerek tacirlerin daha doğru ticaret kararları vermesini sağlar. RSI Crossover Alert, işlevselliğini ve kullanılabilirliğ
    Breakout Robot
    Thushara Dissanayake
    4.5 (4)
    Çok rağbet gören EURJPY Breakout Stratejisini benzersiz bir kolaylıkla otomatikleştirmek için tasarlanmış devrim niteliğinde bir araç olan   Breakout Robot Expert Advisor   ile tanışın. Bu güçlü EA, 22:00 - 02:00 GMT arasında yüksek ve düşük değerleri kullanarak zahmetsizce bir kutu çizen basit ama etkili bir sisteme sahiptir. Daha sonra, tümü M15 zaman çerçevesi için optimize edilmiş, fiyat kutunun üstüne/altına düştüğünde SATIN AL/SAT emirlerini otomatik olarak yürütür. Eksiksiz özelleştirme y

    BullsBears Action
    Thushara Dissanayake
    4.05 (22)
    BullsBears Action Expert Advisor,   ticaret kararları için   Boğalar   ve   Ayılar   hacim verilerini kullanmak üzere tasarlanmış güçlü bir araçtır. Mum hacmine göre piyasadaki Boğa ve Ayı yüzdesini analiz eden bu EA, kullanıcı tanımlı parametrelere göre Alış veya Satış emirlerini otomatik olarak açar. Risk yönetimi, otomatik durdurma kaybı ayarı ve özelleştirilebilir ayarlar içeren kullanıcı dostu bir ticaret çözümü sunar. Bu uzman danışmanın en önemli özelliklerinden biri, toplam marja dayalı
    FREE
    Volume Percentage Line Graph
    Thushara Dissanayake
    4.75 (4)
    Hacim Yüzdesi Çizgi Grafiği,   hacim verisi bilgileri sağlamak için tasarlanmış bir göstergedir. Her mum için toplam hacim bilgisini alır ve bunu toplam hacmin yüzdesi olarak sunar. Gösterge, bu verileri ayrı bir pencerede grafik çizgiler olarak göstererek, kullanıcıların alıcılar ve satıcılar arasındaki savaşı kolayca görselleştirmesine olanak tanır. Bu göstergenin en önemli özelliklerinden biri, hacim yüzdesini grafik çizgiler olarak gösterebilmesidir. Satıcılar ve alıcılar arasındaki hacim da
    FREE
    Ez Channel
    Thushara Dissanayake
    Ez Channel   göstergesi, grafikte gerçek trend kanallarını otomatik olarak tanımladığından, trendi takip eden tüccarlar için önemli bir araçtır. Bu gösterge ile artık grafiklerinize manuel olarak trend çizgileri çizmek için saatler harcamanıza gerek yok. Herhangi bir sembol ve zaman çerçevesi için hızlı bir şekilde trend kanalları çizerek zamandan ve emekten tasarruf etmenizi sağlar. Ez Channel'ın en önemli özelliklerinden biri, zaman dilimlerini tercihinize göre kolayca ayarlamanıza olanak tanı
    Extract Candle Power
    Thushara Dissanayake
    5 (2)
    Extract Candle Power,   her mum sırasında satıcıların ve alıcıların davranışlarına ilişkin değerli bilgiler sağlayan gerçek zamanlı bir hacim çıkarıcı göstergesidir. Tüccarlar, hacim verilerini analiz ederek, geleneksel Hareketli Ortalama göstergelerinin yeteneklerini aşarak, piyasa eğilimleri ve potansiyel geri dönüşler hakkında daha bilinçli kararlar alabilir. Bu güçlü araç, mevcut mumun satıcı ve alıcı hacmini çıkarmanıza ve analiz etmenize ve ayrıca önceki mumların hacmiyle karşılaştırmanıza
    Ms Fibonacci
    Thushara Dissanayake
    3.75 (8)
    Grafiğinizde Fibonacci seviyelerini çizme ve ayarlama sürecini basitleştirmek için tasarlanmış güçlü ve ücretsiz bir gösterge olan   Bayan Fibonacci ile   tanışın. Bu gösterge, yeni en yüksek ve en düşük Fibonacci seviyelerini otomatik olarak tanımlayıp işaretleyerek doğru ve kesin yerleştirme sağlar. Bayan Fibonacci'nin en önemli özelliklerinden biri, Fibonacci seviyelerini doğru bir şekilde çizme, noktadan noktaya ve karşılık gelen fiyat seviyelerini işaretleme yeteneğidir. Bu özellik, Fibonac
    FREE
    Fibo Scalper Pro
    Thushara Dissanayake
    2.33 (3)
    Fibo Scalper Pro Expert Advisor,   popüler   Fibonacci Ticaret Stratejilerini   otomatikleştirmek için tasarlanmış güçlü bir araçtır. Grafik üzerinde Fibonacci seviyelerini otomatik olarak çizerek ve ayarlayarak ticaret sürecini basitleştirir. Bu özellik, analizlerinde Fibonacci düzeltmelerini ve uzantılarını kullanan tüccarlar için kolaylık ve doğruluk sağlar. Fibo Scalper Pro'nun en önemli özelliklerinden biri, özelleştirme olanağıdır. Profesyonel tüccarların, kendi özel ticaret tercihlerin
    Mr Fibonacci
    Thushara Dissanayake
    5 (2)
    Grafiğinizde Fibonacci seviyelerini çizme ve ayarlama sürecini basitleştirmek için tasarlanmış harika bir gösterge olan   Mr. Fibonacci ile   tanışın. Bu gösterge, profesyonel tüccarlar için olağanüstü özelleştirme seçenekleri sunarak, herhangi bir Fibonacci seviyesini hassasiyetle çizmelerine olanak tanır. Ayrıca, fiyat Fibonacci seviyelerine girdiğinde mobil bildirimler, e-posta uyarıları ve pop-up uyarıları sunarak potansiyel ticaret fırsatlarını asla kaçırmamanızı sağlar. Bu göstergeyi kulla
    Three MA Alert
    Thushara Dissanayake
    Üç MA Uyarı   göstergesi   , Hareketli Ortalamalar Geçiş Stratejisine   güvenen tacirler için önemli bir araçtır. Mobil cihazınıza, e-postanıza bildirimler göndererek ve üç hareketli ortalamanın kesiştiği her yerde sesli pop-up uyarıları görüntüleyerek işlem hayatınızı basitleştirir. Yaygın olarak kullanılan bu tekniği izleyerek, her zaman trendin doğru tarafında olduğunuzdan emin olabilir ve hakim piyasa yönüne karşı işlem yapmaktan kaçınabilirsiniz. Üç MA Uyarısı göstergesi ile artık oturup ha
    Two MA Crossover
    Thushara Dissanayake
    5 (3)
    İki MA Geçişi,   Hareketli Ortalama Geçiş Stratejisine   güvenen tacirler için özel olarak tasarlanmış güçlü bir bildirim sistemidir. Bu tam otomatik gösterge, önemli bir ticaret olayını asla kaçırmamanızı sağlayan kapsamlı bir uyarı sistemi görevi görür. Mobil cihazınıza, e-postanıza bildirimler gönderir ve tercih ettiğiniz parametrelere dayalı olarak hareketli bir ortalama geçişi algıladığında bilgisayarınızda sesli açılır uyarılar görüntüler. Dikkate değer özelliklerinden biri, en popüler Har
    Pivot Bro
    Thushara Dissanayake
    5 (1)
    Pivot Bro   teknik göstergesi   , Pivot, Fibonacci, ATR   ve   ADR   seviyelerini kullanarak düzeltme alanlarını belirlemek için tasarlanmış güçlü bir araçtır. Fiyat eylemine dayalı ters   şamdan modellerini   de tanıyarak bunun ötesine geçer. Ek olarak,   Para Birimi Ölçer   , büyük para birimlerinin gerçek gücünü değerlendirmek için değerli bir yol arkadaşıdır. 28 döviz çiftini analiz ederek ve güçlerini renk değişimleri ile grafik üzerinde göstererek, tüccarların giriş ve çıkış noktalarında b
    ReversalPatterns
    Thushara Dissanayake
    Bu teknik gösterge, grafikteki çeşitli   Ters Şamdan Modellerini   kullanarak fiyat hareketini otomatik olarak tanımlar ve analiz eder. Ok işaretlerini karşılık gelen kalıp adlarıyla birlikte çizerek en son ters şamdan kalıplarını bulmayı kolaylaştırır. Bu gösterge ile grafik analizini hızlı bir şekilde tanımlayabilir ve önceden tanımlanmış mum modelleriyle karşılaştırabilirsiniz. Gösterge, Dragonfly Doji, Gravestone Doji, Hammer, Pin Bar ve daha fazlası gibi hem basit hem de karmaşık bir dizi u
    Reversal Alert Pro
    Thushara Dissanayake
    2.5 (2)
    Reversal Alert Pro   göstergesi, piyasadaki geri dönüş alanlarını otomatik olarak tespit etmek için tasarlanmış güçlü bir araçtır. Doğrudan mobil cihazınıza gönderilen uygun bildirimler sunar ve sesli açılır uyarıları görüntüler. Bu göstergeyi ticaret stratejinize dahil ederek, ticaret pozisyonlarını etkili bir şekilde filtreleyebilirsiniz. Ayrıca gösterge, üretilen sinyalleri daha da hassaslaştırmak için CCI, RSI ve Stokastik göstergelerini kullanma seçeneği sunarak çok yönlülüğünü ve uygulanab
    Currency Strength 7
    Thushara Dissanayake
    Para Birimi Gücü 7   teknik göstergesi, yatırımcıların en popüler yedi para biriminin gücünü ölçmesine yardımcı olmak için tasarlanmış güçlü bir araçtır. AUD, USD, EUR, GBP, JPY, CHF ve CAD'in gücünü analiz eden bu gösterge, para birimi dinamikleri hakkında değerli bilgiler sağlar. Grafikte para birimi gücünü çizgiler kullanarak temsil eder ve tüccarların farklı para birimlerinin göreli gücünü hızlı bir şekilde değerlendirmesine olanak tanır. Bu göstergenin göze çarpan özelliklerinden biri, graf
    Crossover Action Expert Advisor,   en popüler ticaret stratejilerinden biri olan Hareketli   Ortalama Geçiş Stratejisini   otomatikleştirmek için tasarlanmış gelişmiş bir araçtır. Sezgisel arayüzü ve güçlü özellikleriyle bu uzman danışman, manuel alım satımın karmaşıklığını ortadan kaldırır ve alım satımları hareketli ortalama geçişlerine dayalı olarak otomatik olarak yürütür. Bu uzman danışmanın en önemli özelliklerinden biri, alım satımların uygun parti büyüklükleri ve maksimum risk limitleri
    CCI Action
    Thushara Dissanayake
    CCI Action Expert Advisor,   CCI (Commodity Channel Index) Stratejisini   otomatikleştirmek için tasarlanmış güçlü bir araçtır ve tacirlerin CCI düzeyindeki dokunuşlardan yararlanmalarına olanak tanır. Kullanıcı dostu ayarları ve güçlü risk yönetimi sistemi ile bu EA, CCİ göstergesini ticaret yaklaşımlarına dahil etmek isteyen tüccarlar için güvenilir ve verimli bir çözüm sunar. Bu Uzman Danışmanın en önemli özelliklerinden biri, tacirlerin ticari sermayeleri üzerinde kontrol sahibi olmalarına y
    News Robo
    Thushara Dissanayake
    2 (1)
    Haber Robo Uzman Danışmanı, haber tüccarlarının haber bültenleri sırasında gizli zarar durdurma ile bekleyen emirleri açmasına yardımcı olmak için tasarlanmış güçlü bir araçtır. Alım satım deneyiminizi geliştiren ve alım satımlarınızı koruyan çeşitli özellikler sunar. News Robo'nun en önemli özelliklerinden biri, zarar durdurma işlemlerini piyasa yapıcı brokerlerden gizlemeyi tercih eden haber yatırımcıları için ideal olan gizli zarar durdurma özelliğidir. Kârlı bir pozisyona ulaşıldığında, zara
    RSI Action
    Thushara Dissanayake
    3.67 (3)
    RSI Action Expert Advisor,   popüler   RSI (Göreceli Güç Endeksi)   stratejilerini otomatikleştirerek verimli ve doğru ticarete olanak tanıyan güçlü bir araçtır. Aşırı alım ve aşırı satım seviyelerini kullanarak, bu EA alış ve satış emirleri için en uygun giriş noktalarını belirler. Ayrıca, RSI geri dönüş noktaları, bekleyen emirler, ana trend belirleme ve Hareketli Ortalama Geçiş sinyalleri dahil olmak üzere ticaret hassasiyetini artırmak için çeşitli sinyal filtreleme seçenekleri sunar. Ek ola
    Candle GAP
    Thushara Dissanayake
    Mum GAP   göstergesi, haftanın her günü için mum boşluklarını otomatik olarak belirlediğinden,   Boşluk Ticareti Stratejilerini   kullanan tacirler için önemli bir araçtır. Boşluk, art arda iki günün kapanış ve açılış arasındaki fiyat seviyesi farkını ifade eder. Bu gösterge dört tür boşluk modelini tanır: Ortak, Koparma, Devam ve Tükenme. Tüccarlar, bu göstergeyi herhangi bir tabloya dahil ederek sinyallerini doğrulayabilir ve alım satım kararlarını geliştirebilir. Mum GAP göstergesinin temel ö
    Zararı Durdur ve Kar Al yönetimini otomatikleştirerek alım satım deneyiminizi geliştirmek için tasarlanmış güçlü bir araç olan   TPSL Sürücü Yardımcı Programı   ile tanışın. Bu yardımcı program, kesintisiz sipariş yönetimi ve gelişmiş kar koruma teknikleri isteyen her tacire hitap eder. TPSL Driver Utility ile, iki sipariş yönetimi modu arasında seçim yapma esnekliğine sahipsiniz: Gizli ve Görsel. Gizli mod, Kârı Al ve Zararı Durdur seviyelerini gizlemenize izin vererek işlemlerinizi yönetmek iç
    Entry Point
    Thushara Dissanayake
    Al/Sat bildirimleri sağlamak için tasarlanmış güçlü bir teknik gösterge olan   Giriş Noktası   ile tanışın. Bu gösterge, doğru sinyaller üretmek için 5 hareketli ortalamayı, CCI, RSI, Stokastik, Bill Williams ve hacim göstergelerini 3 farklı zaman diliminde analiz eder. Profesyonel tüccarlar için sınırsız özelleştirme seçenekleri sunarak göstergeyi deneyimlerine ve stratejilerine göre uyarlamalarına olanak tanır. Giriş Noktası, kullanıcılara mobil cihazlar, e-posta ve sesli açılır uyarılar aracı
    6 döviz çifti için Alış/Satış bildirimleri sağlamak üzere tasarlanmış güçlü bir teknik gösterge olan   Entry Point Dashboard Ultimate   ile tanışın. Bu gösterge, doğru sinyaller üretmek için 5 hareketli ortalamayı, CCI, RSI, Stokastik, Bill Williams ve hacim göstergelerini 3 farklı zaman diliminde analiz eder. Profesyonel tüccarlar için sınırsız özelleştirme seçenekleri sunarak göstergeyi deneyimlerine ve stratejilerine göre uyarlamalarına olanak tanır. Entry Point Dashboard Ultimate, kullanıcıl
    Fibonacci ticaret stratejinizde devrim yaratmak için tasarlanmış güçlü bir araç olan   Fibo Channels Ultimate   teknik göstergesiyle tanışın. Gelişmiş işlevselliği ile bu gösterge, grafiğinizdeki tüm geçmiş Fibonacci kanallarını otomatik olarak çizerek size zaman ve emek kazandırır. Fibo Channels Ultimate'ı diğerlerinden ayıran şey, profesyonel tüccarların arzu ettikleri herhangi bir Fibonacci seviyesini çekmelerine olanak tanıyan olağanüstü özelleştirme yetenekleridir. Bu esneklik seviyesi, gös
    Crossover Tactics Ultimate Expert Advisor,   popüler   Hareketli Ortalama Geçiş Stratejilerini   otomatikleştirmek için tasarlanmış güçlü bir araçtır. Sinyallerin güvenilirliğini artırmak için gelişmiş filtreleme teknikleri kullanırken, üç hareketli ortalamanın kesişimine dayalı olarak en uygun giriş noktalarını belirlemede mükemmeldir. Ancak, bu EA'yı diğerlerinden ayıran şey, TPSL Sürücü Yardımcı Programı algoritması olarak bilinen kapsamlı ticari yönetim sistemidir. Bu uzman danışmanın göze ç
    Günlük Fibonacci Pivot Stratejisi   yatırımcıları için özel olarak tasarlanmış teknik bir gösterge olan   DFP Reconnoiter Ultimate   ile tanışın. Bu gösterge, iyi zamanlanmış girişlerle sonuçlanan geri dönüş ve çıkış alanlarını belirlemek için standart Fibonacci düzeltmelerini, günlük Pivot seviyelerini, Şamdan modellerini, ATR ve ADR seviyelerini içerir. Günlük merkezi pivot ile bağlantılı olarak %38,2, %50,0 veya %61,8'lik temel Fibonacci düzeltme seviyeleri tercih edilir. Strateji, bir önceki
    Currency Heat Wave Ultimate
    Thushara Dissanayake
    5 (1)
    Currency Heat Wave Ultimate   teknik göstergesi, tüccarlara ana para birimlerinin gücü hakkında gerçek zamanlı içgörüler sağlayan değerli bir araçtır. 28 döviz çifti analiziyle, doğrudan grafik üzerinde döviz gücüne ilişkin kapsamlı bir genel bakış sunarak kullanımı inanılmaz derecede kolay hale getirir. Renkleri dinamik olarak değiştirerek, tüccarların para birimlerinin pozisyonlarını hızlı bir şekilde belirlemelerine ve bilinçli kararlar vermelerine olanak tanır. Currency Heat Wave'in dikkate
    Exit Area Ultimate
    Thushara Dissanayake
    3 (1)
    Exit Area Ultimate,   grafikte günlük   Ortalama Gerçek Aralık (ATR)   ve   Ortalama Günlük Oran (ADR)   seviyelerini göstererek alım satım kararlarını geliştirmek için tasarlanmış teknik bir göstergedir. Bu seviyeleri anlayarak, tüccarlar bir varlığın gün boyunca ortalama hareketini kolayca değerlendirebilir. Bu çok yönlü gösterge, günlük tüccarlar için birden çok amaca hizmet eder, sipariş vermeye yardımcı olur, gün içi eğilimleri belirler, takip eden zarar durdurma seviyelerini belirler ve gü
    Level Scanner
    Thushara Dissanayake
    Seviye Tarayıcı   göstergesi, tüm   Destek ve Direnç seviyeleriyle   birlikte tablodaki   Yüksek   ve   Düşük   alanların tanımlanmasını otomatikleştirmek için tasarlanmış güçlü bir araçtır. Gerçek eğilimin daha net ve pürüzsüz bir temsilini sağlamak için   Gövde Hareketli Ortalamasının   kullanımını içerir. Bu gösterge olağanüstü bir hızla çalışarak, tacirlerin önemli ilgi alanlarını hızlı bir şekilde belirlemelerine ve daha bilinçli ticaret kararları vermelerine olanak tanır. Seviye Tarayıcını
    Infinity Oscillators Ultimate,   RSI, Stokastik, MACD, CCI ve Hacim stratejilerini kullanan tacirler için ticaret deneyimini geliştirmek üzere tasarlanmış her şey dahil bir   OSCI-KIT'dir   . Kapsamlı özellik yelpazesiyle bu gösterge, piyasa trendlerini analiz etmek, tersine çevirmeleri ve geri çekilmeleri belirlemek, ATR'yi kullanarak gün içi hedefleri hesaplamak ve önemli ticari olaylardan haberdar olmak için güçlü bir araç seti sunar. Bu göstergenin göze çarpan özelliklerinden biri, en popül
    Filtrele:
    David T
    226
    David T 2023.08.28 14:08 
     

    After downloading the demo and using it on Strategy Tester I immediately saw how this powerful indicator would greatly assist any trader by providing a VERY powerful confirmation of trade direction when used with price action. Not to be used as a stand alone system but together with some good knowledge of support/resistance or some SMC and makes taking a trade that more reassuring. I then proceeded to rent it for a month and immediately saw so far even after a few hours that what I saw in the tester held up in live markets. The developer was VERY open to my suggestions and was very pleasant to deal with. Very responsive. I honestly believe this is one of the best indicators I have ever found not only here on MQL5 but anywhere else online past and probably in the future and believe me I have seen hundreds if not thousands of indicators. Hidden Gem .

    I have now upgraded to a full purchase. Seller VERY considerate and accommodating to my situation. Best seller I have dealt with honestly. Couldn't be more helpful. I am so thankful to him and now possess this fantastic indicator.

    Thushara Dissanayake
    23772
    Geliştiriciden yanıt Thushara Dissanayake 2023.08.29 15:11
    Thank you so much for taking the time to share your detailed and positive experience with the indicator! I'm thrilled to hear that you've found it to be a valuable tool in confirming trade directions alongside price action. Your insights about using it in conjunction with support/resistance or SMC are truly valuable. It's fantastic to know that the indicator's performance in live markets aligns with your observations in the Strategy Tester. I greatly appreciate your kind words about my responsiveness and openness to suggestions. I'm always dedicated to refining the indicator to meet the needs of traders like you. Your review truly makes my day, and I'm honored to have this indicator labeled as a "Hidden Gem." Thank you again for your support and for recognizing the efforts put into creating a useful tool. If you ever have more ideas or feedback, feel free to reach out. Happy trading!
    Anthony Baez
    129
    Anthony Baez 2023.08.14 01:55 
     

    Great Recent Update and provides great info for your confirmation in trades

    Thushara Dissanayake
    23772
    Geliştiriciden yanıt Thushara Dissanayake 2023.08.14 03:25
    Thank you for your kind words! I'm thrilled that you're finding the recent update to be valuable and informative for your trading decisions. If you have any questions or need further assistance, feel free to reach out. Happy trading!
    ROBERT EDWARD BIRD
    2016
    ROBERT EDWARD BIRD 2023.01.09 01:10 
     

    Rented but am a little disappointed. The EA does not reflect what's shown in the video. It's different. Buy/sell arrows do not appear. Candle power seems to mean nothing. Example, it could read 90bull 10 bear and it goes in the bear direction. Not finding this to be helpful at all. Perhaps the author can help figure this out. Happy to edit review if I'm using this wrong

    Thushara Dissanayake
    23772
    Geliştiriciden yanıt Thushara Dissanayake 2023.05.04 19:46
    I apologize for the disappointment you've experienced. The video you watched was based on an older version of the Candle Power Pro indicator. Since then, I have made significant updates and improvements to the tool, and it's now at version 1.5. As you correctly pointed out, the Candle Power Pro is based on volume data, which can sometimes result in a situation where it shows 90% bull and 10% bear, yet the price goes in the bear direction. However, it's important to note that this is precisely the type of scenario where the tool can be most useful. The Candle Power Pro can help you carefully analyze volatile market conditions and make informed trading decisions. For example, when the price goes in the bear direction despite high bullish volume, you can pay closer attention to the next candle and see whether the buyers are still following the previous price's direction or not. If the next candle also shows a higher bull percentage but the price continues to move down, it could mean that buyers are still waiting for the previous direction. In the following candle, they might follow the new price direction with a higher bear percentage. This could indicate a reversal or a retracement, or it could be due to a news event. I'm here to help you with any issues you may be having. Please don't hesitate to reach out to me for further assistance. Thank you for your feedback.
    Gregory Knobloch
    357
    Gregory Knobloch 2021.10.22 18:33 
     

    I really like it!

    Serge Charbit
    204
    Serge Charbit 2021.02.11 21:47 
     

    bonjour, comment expliqueriez vous une bougie contraire a son pourcentage ?

    globetrotter777
    463
    globetrotter777 2020.08.11 09:51 
     

    I usually don't comment on digital product but this is a good one... well done Thushara!

    Lev Vladimirovic Marushkin
    1636
    Lev Vladimirovic Marushkin 2019.11.13 12:51 
     

    Very useful tool! Author is very friendly and plans some great improvements for the next version. Happy buyer here so far :)

    Update: Testing new version 1.3 right now. So far i am blown away by this indicator! So easy to see the TRUE trend of the market. And i love the fact that now we can simply click directly on the chart and see what we want to see. The new panel is really a masterpiece. Support is worldclass too. Thank you Thushara!

    İncelemeye yanıt
    Sürüm 1.6 2023.08.13
    1. Geliştirilmiş okunabilirlik için özelleştirilebilir yazı tipi boyutları.
    2. Anahtar araçların entegrasyonu: Fibonacci, Pivot, ATR ve Kanal.
    3. Çift tıklama yoluyla kolay araç etkinleştirme/devre dışı bırakma için geliştirilmiş araç çubuğu.
    4. Geliştirilmiş hacim isabet uyarı sistemi, artık tüm zaman çerçeveleriyle uyumludur.
    Sürüm 1.5 2023.05.04
    1. Product logo updated.
    2. Input feature added to enable/disable toolbar.
    Sürüm 1.4 2020.04.24
    1. Added alert for user define volume percentage level (Bull/ Bear)
    2. Added alert for user define volume level
    3. Show arrow on the candle that meet user define volume level
    4. Change and added input parameters
    Sürüm 1.3 2019.12.04
    1. Optimized complete algorithm for fast activity.
    2. Added buttons for quick action.
    3. Added standard volume indicator.
    4. Added volume average indicator.
    5. Added volume percentage line graph indicator.
    6. Added candle color change activity by volume percentage.
    7. Increased data on multi pair volume indicator.
    8. Changed input parameters.
    Sürüm 1.2 2018.09.20
    1. Updated the product logo.
    Sürüm 1.1 2018.03.27
    1. Use separate indicator window.
    2. Add more extra symbols for show volume data.
    3. Fixed few bugs that related to double numbers and type of brokers.