• Genel bakış
  • İncelemeler (44)
  • Yorumlar (17)
  • Yenilikler

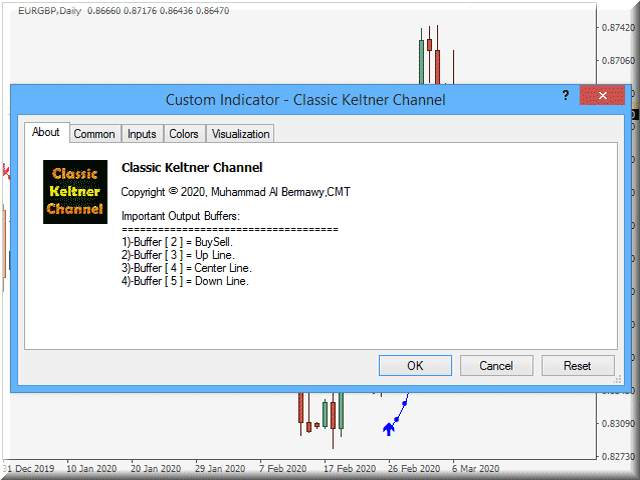
Classic Keltner Channel

4.9

Veya CKC.

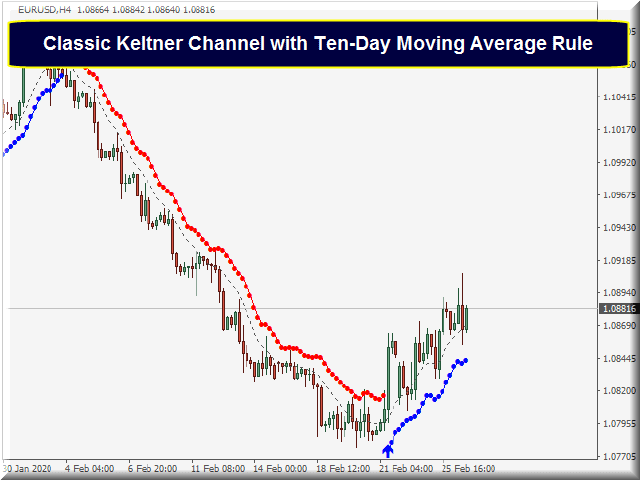
Bu gösterge, Chester W. Keltner (1909–1998) tarafından tanımlanan klasik on günlük hareketli ortalama kuralına bağlı olarak çalışır. Tüm parametreler varsayılan olarak Keltner sisteminin klasik versiyonuna ayarlanmıştır, kullanıcı isterse bunları değiştirebilir.

Önemli bilgi

    CKC Kılavuzunu okuyun:https://www.mql5.com/en/blogs/post/736577
        CKC Uzman Danışman Örneği:https://www.mql5.com/en/blogs/post/734150


          Keltner Kanal Formülü Hakkında

          1. Merkez Çizgiyi, Tipik Fiyattan (= (Yüksek + Düşük + Kapanış) / 3) basit bir hareketli ortalama olarak hesaplayın.

          2. En yüksek ve en düşük arasındaki ortalama fark olan Ortalama Günlük Aralığı (ADR) merkez çizgisi için aynı periyot ve hesaplama yöntemi ile hesaplayın.

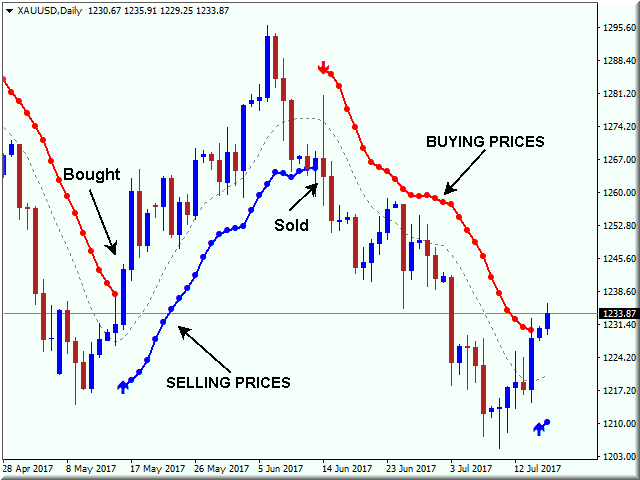
          3. Keltner Satın Alma Hattı = Merkez Hattı + ADR.

          4. Keltner Satış Hattı = Merkez Hattı – ADR.


          Keltner 10 günlük hareketli ortalama kuralı

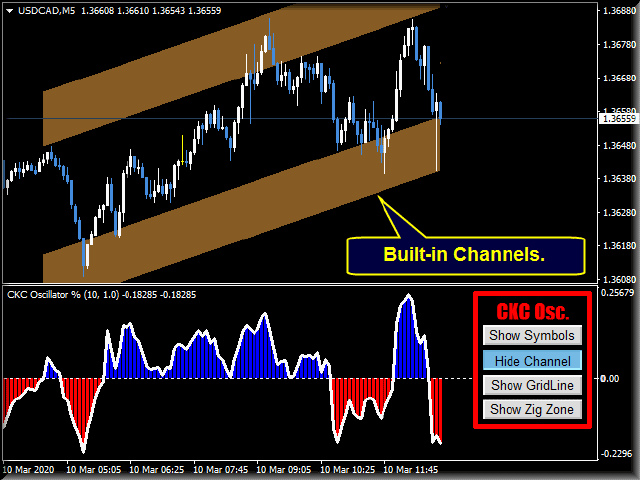
          Keltner formülü, grafikte iki temel çizgi oluşturmaya yol açar.

            1. Keltner Satın Alma Hattı.Bu, satış pozisyonunuzu kapattığınız ve satın almaya gittiğiniz çizgidir.

            2. Keltner Satış Hattı.Bu, alış pozisyonunuzu kapattığınız ve satacağınız çizgidir.

              Bu iki satırı kullanarak, teknik analizde yaygın olarak kullanılan "Başlat ve Geri Al" ilkesine bağlı ticaret kuralları elde ettik.

                1. Fiyat çizgisi Keltner Satın Alma Çizgisinin (kırmızı çizgi) üzerine kapandığında satın alın. Keltner Satış Hattını (mavi çizgi) bir durak olarak kullanın ve alımdan satıma geri dönün.

                2. Fiyat çizgisi Keltner Satış Çizgisinin (mavi çizgi) altına kapandığında satış yapın. Keltner Satın Alma Hattını (kırmızı çizgi) bir durak olarak kullanın ve satıştan satın almaya geri dönün.
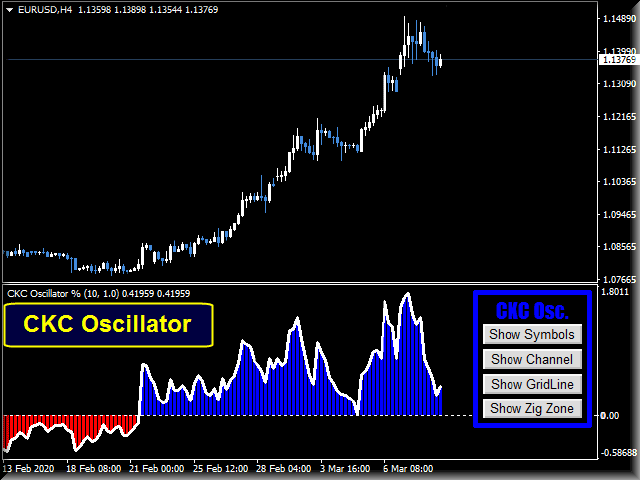
                  CKC Özellikleri

                    CKC, sonuçlarını yeniden boyamaz veya yeniden hesaplamaz.

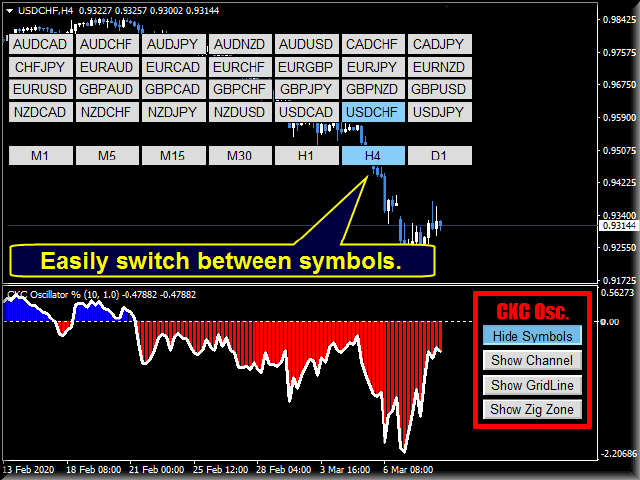
                    Kripto para birimleri, hisse senedi, endeks, petrol, altın ve tüm zaman dilimlerinde çalışır.

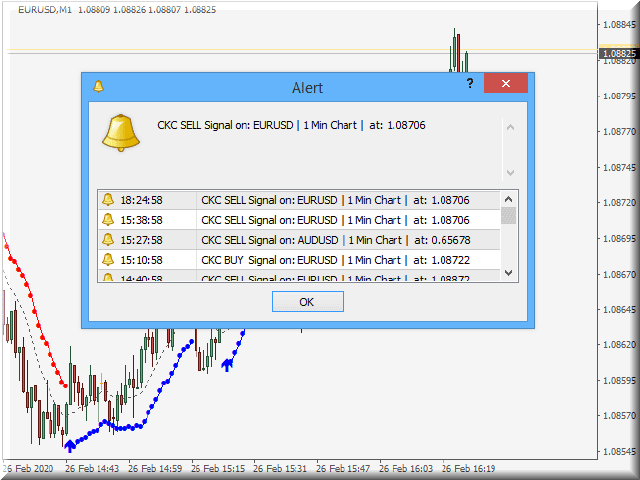
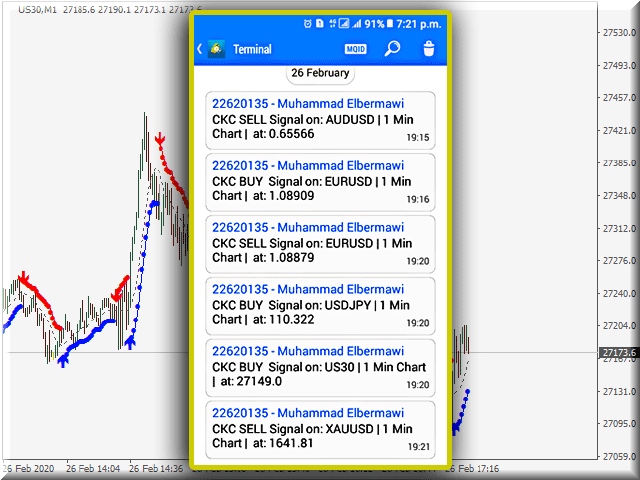
                    Ses, e-posta uyarıları ve Mobil Bildirim.

                    Trend sinyallerini tanımlamaya yardımcı olmak için satın alın, satın oklar.

                    Kullanıcının aralarında kolayca gezinmesine yardımcı olacak iyi tasarlanmış parametreler.

                    Kendi uzman danışmanlarınızı oluşturmak için arabellek.

                    Aralarından seçim yapabileceğiniz dört farklı renk listesi.

                    CKC Parametreleri

                    (1) GÖSTERGE PARAMETRELERİ

                    • CKC Mumlar.Bant hesaplamalarında kullanılan mum sayısı (varsayılan 10 mumdur).
                    • CKC Menzil Çarpanı.Keltner Alış/Satış hattı Merkez Hattından ne kadar ayrılacak (varsayılan 1.0'dır).
                    • CKC Hareketli Ortalama Yöntemi.Hesaplamalarda kullanılan Hareketli Ortalama türü (Varsayılan, Basit Hareketli Ortalamadır).
                    • CKC Uygulanan Fiyat.Keltner Center Line Hesaplamalarında kullanılan fiyat (Tipik Fiyat varsayılandır).

                    (2) UYARILAR

                    • Ses Alarmi.Uyarı sesini ve mesajını kullanmayı veya durdurmayı seçin (varsayılan değer doğrudur).
                    • Eposta gönder.Kullanıcıya e-posta gönderme seçeneği (varsayılan yanlıştır).
                    • Mobil Bildirim Gönder.Kullanıcıya mobil bildirim gönderme seçeneği (varsayılan yanlıştır).

                    (3) GÖSTERGE TARZI

                    • Grafik Renkleri Listesi.Dört farklı renk listesi arasından seçim yapabilirsiniz (varsayılan Hiçbir Şey Yapma'dır).
                    • CKC Üst Bant Rengi.Varsayılan Kırmızı'dır.
                    • CKC Alt Bant Rengi.Varsayılan Mavi'dir.
                    • CKC Genişliği.Varsayılan birdir.


                    Herhangi bir sorunuz varsa lütfen özel mesaj yoluyla bana ulaşın veya yorum bölümüne yazın.
                    Muhammed Al Bermaui, CMT


                    İncelemeler 20
                    udayan datta
                    640
                    udayan datta 2024.01.27 11:51 
                     

                    Indicator looks perfectly good and working fine, looking forward to learn it

                    leroy
                    275
                    leroy 2023.06.03 01:25 
                     

                    I started reading about the Keltner Channel and was surprised to see a simple yet effective indicator being sold/rented for a good price. I recently just rented the indicator and plan to test it out with my personal strategy. Thanks for creating this indicator!

                    elite luis
                    3331
                    elite luis 2023.03.06 14:06 
                     

                    Author very responsive and fully provide video tutorial on how to use, add as another layer of confluence nice! Thanks!

                    Önerilen ürünler
                    Fibonacci retracements can be used to draw support lines, identify resistance levels, place stop-loss orders and set target prices. The Advanced Automatic Fibonacci retracements draws automatically all the levels. You have a lot of options to choose. For exemple you can use the tracements of another time frame (MTF) in the current chart, you can also choose between the closest level or less close to draw the retracements. You can also add 2 levels of your choice. You can add levels extensions o
                    Classic Fractals indicator for MT4, with additional Trendlines connecting the latest couples of fractals ( fractals are showing highest high, and lowest low on each period) Rules for trendlines: -if new top fractal is below the last one = new resistance line -if new bot fractal is above the last one = new support line -Trendlines can be hidden -Fractals can be hidden Fractal Period = can be both even or uneven number, as it is setting for half (one side) of the bars sequence
                    Koala Fibo Base Time
                    Ashkan Hazegh Nikrou
                    3 (1)
                    Welcome to Koala Fibo Base Time Welcome to Koala Fibo Time Zone Welcome to Koala Fibo Time Extention Welcome to Missed Tool For Meta Trade! Simple Introduction : Fibonacci Time Zones are vertical lines based on the Fibonacci Sequence. These lines extend along the X axis (date axis) as a mechanism to forecast reversals based on elapsed time. A major low or high is often chosen as the starting point. Distances start relatively small and grow as the Fibonacci Sequence extends. Chartists can exten
                    FREE
                    Murrey Math Multi Timeframe Indicator Support/Resistance  Murrey Math Lines are strong tools to plot the support and resistance levels. Murrey Math Multi Timeframe Indicator draws multi timeframe MM lines on a smaller tf chart. General Information: According to Gann, prices move in 1/8's, these 1/8's act as points of price support and resistance as an entity's price changes in time. Given this 1/8 characteristic of price action, Murrey assigns properties to each of the MML's in an a given
                    The PUA MultiType Pivot indicator is built on the daily chart of the previous day. The PUA MultiType Pivot indicator is one of the most popular tools in technical analysis, used by traders to identify potential reversal points in financial markets. This indicator constructs three types of Pivot points: Classic, Fibonacci, and Camarilla, each offering its unique approach to market analysis. The advantages of this indicator include: Simplicity and Clarity PUA MultiType Pivot provides clearly defi
                    Noize Absorption Index MT4
                    Ekaterina Saltykova
                    5 (1)
                    Noize Absorption Index - is the manual trading system that measures the difference of pressure between bears forces and bulls forces. Green line - is a noize free index that showing curent situation. Zero value of index shows totally choppy/flat market.Values above zero level shows how powerfull bullish wave is and values below zero measures bearish forces.Up arrow appears on bearish market when it's ready to reverse, dn arrow appears on weak bullish market, as a result of reverse expectation. S
                    Automatic fibonacci with alerts is an indicator that automatically plots a fibonacci retracement based on the number of bars you select on the BarsToScan setting in the indicator. The fibonacci is automatically updated in real time as new highest and lowest values appear amongst the selected bars. You can select which level values to be displayed in the indicator settings. You can also select the color of the levels thus enabling the trader to be able to attach the indicator several times with d
                    Free automatic Fibonacci is an indicator that automatically plots a Fibonacci retracement based on the number of bars you select on the BarsToScan setting in the indicator. The Fibonacci is automatically updated in real time as new highest and lowest values appears amongst the selected bars. You can select which level values to be displayed in the indicator settings. You can also select the color of the levels thus enabling the trader to be able to attach the indicator several times with differe
                    FREE
                    TWO PAIRS SQUARE HEDGE METER INDICATOR Try this brilliant 2 pairs square indicator It draws a square wave of the relation between your two inputs symbols when square wave indicates -1 then it is very great opportunity to SELL pair1 and BUY Pair2 when square wave indicates +1 then it is very great opportunity to BUY pair1 and SELL Pair2 the inputs are : 2 pairs of symbols         then index value : i use 20 for M30 charts ( you can try other values : 40/50 for M15 , : 30 for M30 , : 10 for H1 ,
                    Automatic redrawing of Trend Supports and resistances levels and Possible Wedge pattern formation to indicate price breaking of Rising Wedge (signal SELL) or price breaking of falling Wedge (signal BUY) Very simple and smart indicator  ALERTS AND MOBILE NOTIFICATIONS availavle !!! you can edit the calculation bars of the bars count for formation of the trend lines and the initial shift from current price  Smaller values for bars /shift inputs when using Higher Time frames (D1-H4) and the reverse
                    Bu, bir mumun kapanış fiyatını tahmin eden bir göstergedir. Gösterge öncelikle D1 çizelgelerinde kullanılmak üzere tasarlanmıştır. Bu gösterge hem geleneksel forex ticareti hem de ikili opsiyon ticareti için uygundur. Gösterge, bağımsız bir ticaret sistemi olarak kullanılabilir veya mevcut ticaret sisteminize ek olarak hareket edebilir. Bu gösterge, mevcut mumu analiz ederek mumun gövdesi içindeki belirli güç faktörlerini ve önceki mumun parametrelerini hesaplar. Böylece gösterge, piyasa hareket
                    Gösterge, piyasa analizi için en etkili araçlardan biri olan Fibonacci destek ve direnç seviyelerini otomatik olarak hesaplar ve çizer. Hesaplama, seçilen dönem ve zaman çerçevesi için ortalama fiyat verilerini kullanır. Bu süre için minimum ve maksimum hareketin başlangıcı ve sonu olarak alınır. Fibonacci seviyeleri, etrafında fiyat hareketinin yavaşlayabileceği veya tersine dönebileceği potansiyel referans noktalarını görmenizi sağlar, yani bunlar daha fazla hareketi tahmin etmek ve ayrıca sto
                    Cosmic Diviner X Planet
                    Olena Kondratenko
                    4 (2)
                    This unique multi-currency strategy simultaneously determines the strength of trends and market entry points, visualizing this using histograms on the chart. The indicator is optimally adapted for trading on the timeframes М5, М15, М30, Н1. For the convenience of users, the indicator renders the entry point (in the form of an arrow), recommended take profit levels (TP1, TP2 with text labels) and the recommended Stop Loss level. The take profit levels (TP1, TP2) are automatically calculated for
                    The Th3Eng PipFinite indicator is based on a very excellent analysis of the right trend direction with perfect custom algorithms. It show the true direction and the best point to start trading. With StopLoss point and Three Take Profit points. Also it show the right pivot of the price and small points to order to replace the dynamic support and resistance channel, Which surrounds the price. And Finally it draws a very helpful Box on the left side on the chart includes (take profits and Stop loss
                    DMS Fibo
                    Diogo Mitsunaga Dos Santos
                    Fibonacci retracements are trend lines drawn between two significant points, usually between absolute lows and absolute highs, plotted on a chart. Intersecting horizontal lines are placed at the Fibonacci levels. Fibonacci retracements are useful tools that help traders identify support and resistance levels. With the information gathered, they can place orders, identify stop-loss levels, and set price targets. Although useful, traders often use other indicators to make more accurate assessments
                    This indicator prepared by using 57 days moving averagr and least square method. It can only work for 1 hr time interval. Once a signal created. It is creating order and 2 limit orders. It works in CFD pairs as well as in Forex pairs. You can fins our other products from link : https://www.mql5.com/en/users/drbastem/seller Also, you can ask all your questins from email : haskayafx@gmail.com or mobile : +90 530 867 5076 or @MehmetBastem on telegram application This system is for Long term and pr
                    VR Cub
                    Vladimir Pastushak
                    VR Cub , yüksek kaliteli giriş noktaları elde etmenin bir göstergesidir. Gösterge, matematiksel hesaplamaları kolaylaştırmak ve bir pozisyona giriş noktalarının aranmasını basitleştirmek için geliştirildi. Göstergenin yazıldığı ticaret stratejisi uzun yıllardan beri etkinliğini kanıtlamaktadır. Ticaret stratejisinin basitliği, acemi yatırımcıların bile başarılı bir şekilde ticaret yapmasına olanak tanıyan büyük avantajıdır. VR Cub, pozisyon açılış noktalarını ve Kâr Al ve Zararı Durdur hedef sev
                    This is the FXTraderariel-TakeProfit - Stop Loss Indicator . It provides you 3 potential Take Profits and 1 Stop Loss. These potential targets are computed based on several methods . The indicator can be used on every time frame, but we advise to use it on H1, H4 and D1. Especially if you are a novice trader. Pro Traders can also you use it for scalping in smaller time frames (M1, M5 and M15). This indicator is not a complete trading system. It doesn't provide you a Signal nor can predict the m
                    Blahtech Market Profile
                    Blahtech Limited
                    4.61 (18)
                    Was: $249  Now: $99   Market Profile defines a number of day types that can help the trader to determine market behaviour. A key feature is the Value Area, representing the range of price action where 70% of trading took place. Understanding the Value Area can give traders valuable insight into market direction and establish the higher odds trade. It is an excellent addition to any system you may be using. Blahtech Limited presents their Market Profile indicator for the MetaTrader community. Ins
                    Fibonacci SR Indicator This indicator creates support and resistance lines. This indicator is based on Fibonacci Retracement and Extension levels. It will consider many combinations of the Fibonacci levels and draw support/resistance lines based on these. This indicator uses tops and bottoms drawn by the ZigZag indicator in its calculations. The ZigZag can also be drawn on the chart, if necessary. The indicator considers many combinations of past reversal points and Fibonacci ratio levels, and
                    FREE
                    FiboRec
                    Alfred Kamal
                    This indicator depends on Fibonacci lines but there is a secret lines i used them, by using FiboRec indicator you will be able to know a lot of important information in the market such as: Features You can avoid entry during market turbulence. You can enter orders in general trend only. You will know if the trend is strong or weak. Signal Types and Frame used You can use this indicator just on H1 frame. Enter buy order in case Candle break out the square area and closed over it, at least 20
                    Master Scalping M1 , trendi hızlı ve doğru bir şekilde belirlemek için bir algoritma kullanan yenilikçi bir göstergedir. Gösterge, pozisyonların açılış ve kapanış zamanını hesaplar, gösterge algoritmaları, bir ticarete girmek (bir varlık satın almak veya satmak) için ideal anları bulmanızı sağlar, bu da çoğu tüccar için işlemlerin başarısını artırır. Göstergenin faydaları: Kullanımı kolaydır, çizelgeyi gereksiz bilgilerle aşırı yüklemez. Herhangi bir strateji için bir filtre olarak kullanılabili
                    Fibonaccitools
                    Aymn Sʿyd Ahmd Hsn Alkwmy
                    Fibonacci retracements are popular tools that traders can use to draw support lines, identify resistance levels, place stop-loss orders, and set target prices. A Fibonacci retracement is created by taking two extreme points on a stock chart and dividing the vertical distance by the key Fibonacci ratios of 23.6%, 38.2%, 50%, 61.8%, and 100%. Fibonacci tools indicator will Draw Fibonacci Tools e.g. Retracement, Arc, Fan, Expansion, TimeZones. Based on zigzag indicator"
                    This is an intraday indicator that uses conventional formulae for daily and weekly levels of pivot, resistance and support, but updates them dynamically bar by bar. It answers the question how pivot levels would behave if every bar were considered as the last bar of a day. At every point in time, it takes N latest bars into consideration, where N is either the number of bars in a day (round the clock, i.e. in 24h) or the number of bars in a week - for daily and weekly levels correspondingly. So,
                    The indicator allows you to trade binary options. The recommended time frame is М1 and the expiration time is 1,2,3 minutes. The indicator suitable for auto and manual trading. A possible signal is specified as a arrows above/under a candle. You should wait until the candle closes! Arrows are not re-painted Trade sessions: TOKYO section (Half-end) Currency pairs: USD/JPY Working time frame: M1 Expiration time: 1,2,3 minutes. The indicator also shows good results when using the martingale strateg
                    FREE
                    Crazy Dancing moving RES/SUP Levels Automatic redrawing of moving Supports and resistances levels  to indicate price breaking supports (signal SELL)  or breaking resistance levels (signal BUY) Very simple appearing indicator but very clever and smart too !!!! Main Inputs: # of bars for the support and resistances levels + the initial shift from start + moving average for filter signaling Smaller values for bars /shift inputs when using Higher Time frames (D1-H4) and the reverse higher values for
                    It is a tool for technical analysis. It allows you to make measurements: Fibo, including the search for clusters Fibo levels (by the DiNapoli method) Overbalance Trend line Selecting S/D levels Input parameters Trend_Color - color of the trend line Trend_Width - width of the trend line Trend_info - if true, along with the trend line additional information is displayed (low, high, medium of the trend line) Trend_info_color_up_dn - color of the text describing the trend line Trend_info_font_up_d
                    This is a new strategy for SUPPLY DEMAND areas It is based on a calculation using the tick volume to detect the big price action in market for both bear /bull actions this smart volume action candles are used to determine the supply and demand areas prices in between main supply and demand lines indicate sideway market  up arrows will be shown when prices moves above the main supply and the secondary supply lines Down arrows will be shown when prices moves below the main demand and the secondary
                    Fibonacci retracement and extension line drawing tool Fibonacci retracement and extended line drawing tool for MT4 platform is suitable for traders who use  golden section trading Advantages: There is no extra line, no too long line, and it is easy to observe and find trading opportunities Trial version: https://www.mql5.com/zh/market/product/35884 Main functions: 1. Multiple groups of Fibonacci turns can be drawn directly, and the relationship between important turning points
                    Market Profile 3
                    Hussien Abdeltwab Hussien Ryad
                    4 (4)
                    Market Profile 3 MetaTrader 4 indicator  — is a classic Market Profile implementation that can show the price density over time, outlining the most important price levels, value area, and control value of a given trading session. This indicator can be attached to timeframes between M1 and D1 and will show the Market Profile for daily, weekly, monthly, or even intraday sessions. Lower timeframes offer higher precision. Higher timeframes are recommended for better visibility. It is also possible t
                    FREE
                    Bu ürünün alıcıları ayrıca şunları da satın alıyor
                    Gann Made Easy
                    Oleg Rodin
                    4.95 (44)
                    Gann Made Easy , bay teorisini kullanarak ticaretin en iyi ilkelerine dayanan, profesyonel ve kullanımı kolay bir Forex ticaret sistemidir. WD Gann. Gösterge, Zararı Durdur ve Kâr Al Seviyeleri dahil olmak üzere doğru SATIN AL ve SAT sinyalleri sağlar. PUSH bildirimlerini kullanarak hareket halindeyken bile işlem yapabilirsiniz. Lütfen satın aldıktan sonra benimle iletişime geçin! Alım satım ipuçlarımı ve harika bonus göstergelerini ücretsiz olarak sizinle paylaşacağım! Muhtemelen Gann ticaret y
                    Mucizevi Forex Göstergesi Tanıtımı: Keskin Ticaretin Gücünü Serbest Bırakın Tüm zaman dilimlerinde gerçekten olağanüstü sonuçlar sunan en iyi Forex göstergesini aramaktan sıkıldınız mı? Artık aramayın! Mucizevi Forex Göstergesi, ticaret deneyiminizi devrimleştirip kazançlarınızı yeni zirvelere taşımak için burada. Gelişmiş teknoloji ve yılların özenli geliştirmesi temelinde Mucizevi Forex Göstergesi, döviz piyasasında güç ve keskinlik açısından doruğa çıkar. Bu olağanüstü araç, tüm seviyelerdeki
                    Şu anda %20 İNDİRİMLİ! Herhangi bir Acemi veya Uzman Tüccar için En İyi Çözüm! Bu gösterge paneli yazılımı 28 döviz çifti üzerinde çalışıyor. Ana göstergelerimizden 2'sine (Gelişmiş Para Birimi Gücü 28 ve Gelişmiş Para Birimi Dürtüsü) dayanmaktadır. Tüm Forex piyasasına harika bir genel bakış sağlar. Gelişmiş Para Birimi Gücü değerlerini, para birimi hareket hızını ve tüm (9) zaman dilimlerinde 28 Forex çifti için sinyalleri gösterir. Trendleri ve / veya scalping fırsatlarını belirlemek içi
                    TPSpro RFI Levels
                    Roman Podpora
                    5 (13)
                    A key element in trading is zones or levels from which decisions to buy or sell a trading instrument are made. Despite attempts by major players to conceal their presence in the market, they inevitably leave traces. Our task was to learn how to identify these traces and interpret them correctly. Reversal First Impulse levels (RFI)   -  Version MT5                INSTRUCTIONS                 RUS                 ENG                                       R ecommended to use with an indicator   -  
                    TPSproTREND PrO
                    Roman Podpora
                    5 (15)
                    TPSpro TRENDPRO  - is a trend indicator that automatically analyzes the market and provides information about the trend and each of its changes, as well as giving signals for entering trades without redrawing! The indicator uses each candle, analyzing them separately. referring to different impulses - up or down impulse. Exact entry points into transactions for currencies, crypto, metals, stocks, indices!  -  Version MT5               DETAILED DESCRIPTION        /       TRADING SETUPS           
                    Atomic Analyst
                    Issam Kassas
                    5 (1)
                    Öncelikle belirtmek gerekir ki bu Ticaret Göstergesi Yeniden Çizim Yapmaz, Gecikmez ve Gecikme Göstermez, bu da hem manuel hem de robot ticareti için ideal hale getirir. Atom Analisti, Piyasada Daha İyi Bir Avantaj Bulmak İçin Fiyatın Gücünü ve Momentumunu Kullanan PA Fiyat Hareketi Göstergesidir. Gürültüleri ve Yanlış Sinyalleri Kaldırmaya ve Ticaret Potansiyelini Artırmaya Yardımcı Olan Gelişmiş Filtrelerle Donatılmıştır. Birden fazla katmanlı karmaşık göstergeler kullanarak, Atom Analisti
                    ŞU ANDA %26 INDIRIMLI Yeni Başlayanlar veya Uzman Tüccarlar için En İyi Çözüm! Bu Gösterge benzersiz, yüksek kaliteli ve uygun fiyatlı bir ticaret aracıdır çünkü bir dizi tescilli özellik ve yeni bir formül ekledik. Sadece BİR grafik ile 28 Forex çifti için Döviz Gücünü okuyabilirsiniz! Yeni bir trendin veya scalping fırsatının tam tetik noktasını belirleyebildiğiniz için ticaretinizin nasıl gelişeceğini hayal edin? Kullanım kılavuzu: buraya tıklayın Bu ilk olan, orijinal! Değersiz bir
                    Scalper Inside PRO
                    Alexey Minkov
                    4.75 (55)
                    An exclusive indicator that utilizes an innovative algorithm to swiftly and accurately determine the market trend. The indicator automatically calculates opening, closing, and profit levels, providing detailed trading statistics. With these features, you can choose the most appropriate trading instrument for the current market conditions. Additionally, you can easily integrate your own arrow indicators into Scalper Inside Pro to quickly evaluate their statistics and profitability. Scalper Inside
                    Tanıtım       Kuantum Trend Keskin Nişancı Göstergesi   , trend tersine dönmeleri belirleme ve ticaret yapma şeklinizi değiştiren çığır açan MQL5 Göstergesi! 13 yılı aşkın ticaret tecrübesine sahip deneyimli tüccarlardan oluşan bir ekip tarafından geliştirilmiştir.       Kuantum Trend Keskin Nişancı Göstergesi       trend dönüşlerini son derece yüksek doğrulukla belirlemenin yenilikçi yolu ile ticaret yolculuğunuzu yeni zirvelere taşımak için tasarlanmıştır. ***Kuantum Trend Keskin Nişancı Gö
                    TrendMaestro
                    Stefano Frisetti
                    5 (2)
                    note: this indicator is for METATRADER4, if you want the version for METATRADER5 this is the link: TRENDMAESTRO recognizes a new TREND in the bud, he never makes mistakes. The certainty of identifying a new TREND is priceless. DESCRIPTION TRENDMAESTRO identifies a new TREND in the bud, this indicator examines the volatility, volumes and momentum to identify the moment in which there is an explosion of one or more of these data and therefore the moment in which prices have strong probability of f
                    Currency Strength Wizard , başarılı ticaret için size hepsi bir arada çözüm sağlayan çok güçlü bir göstergedir. Gösterge, birden çok zaman dilimindeki tüm para birimlerinin verilerini kullanarak şu veya bu forex çiftinin gücünü hesaplar. Bu veriler, şu veya bu para biriminin gücünü görmek için kullanabileceğiniz, kullanımı kolay para birimi endeksi ve para birimi güç hatları biçiminde temsil edilir. İhtiyacınız olan tek şey, işlem yapmak istediğiniz tabloya göstergeyi eklemektir ve gösterge size
                    XQ Indicator MetaTrader 4
                    Marzena Maria Szmit
                    3 (2)
                    Step into the realm of Forex trading with confidence and precision using XQ, a cutting-edge Forex indicator designed to elevate your trading game to unprecedented heights. Whether you're a seasoned trader or just stepping into the world of currency exchange,   XQ Forex Indicator   empowers you with the insights and signals needed to make informed trading decisions. The signal conditions are a combination of three indicators, and XQ Forex Indicator only display  medium and long-term trends . The
                    Advanced Supply Demand
                    Bernhard Schweigert
                    4.92 (310)
                    CURRENTLY 26% OFF !! Best Solution for any Newbie or Expert Trader! This indicator is a unique, high quality and affordable trading tool because we have incorporated a number of proprietary features and a new formula. With this update, you will be able to show double timeframe zones. You will not only be able to show a higher TF but to show both, the chart TF, PLUS the higher TF: SHOWING NESTED ZONES. All Supply Demand traders will love it. :) Important Information Revealed Maximize the potenti
                    Quantum Breakout Indicator PRO
                    Bogdan Ion Puscasu
                    4.96 (26)
                    Tanıtım       Quantum Breakout PRO   , Breakout Bölgeleri ile ticaret yapma şeklinizi değiştiren çığır açan MQL5 Göstergesi! 13 yılı aşkın ticaret deneyimine sahip deneyimli tüccarlardan oluşan bir ekip tarafından geliştirilen   Quantum Breakout PRO   , yenilikçi ve dinamik koparma bölgesi stratejisiyle ticaret yolculuğunuzu yeni zirvelere taşımak için tasarlanmıştır. Kuantum Breakout Göstergesi, size 5 kar hedefi bölgesi ile kırılma bölgelerinde sinyal okları ve kırılma kutusuna dayalı ol
                    Scalper Vault
                    Oleg Rodin
                    5 (27)
                    Scalper Vault , başarılı bir scalping için ihtiyacınız olan her şeyi size sağlayan profesyonel bir scalping sistemidir. Bu gösterge, forex ve ikili opsiyon tüccarları tarafından kullanılabilecek eksiksiz bir ticaret sistemidir. Önerilen zaman çerçevesi M5'tir. Sistem size trend yönünde doğru ok sinyalleri sağlar. Ayrıca size üst ve alt sinyaller ve Gann piyasa seviyeleri sağlar. Göstergeler, PUSH bildirimleri dahil her türlü uyarıyı sağlar. Göstergeyi satın aldıktan sonra lütfen benimle iletişim
                    FX Power MT4 NG
                    Daniel Stein
                    5 (8)
                    Sabah Brifingimiz burada mql5 ve on Telegram! FX Power MT4 NG , uzun zamandır çok popüler olan döviz gücü ölçerimiz FX Power'ın yeni neslidir. Peki bu yeni nesil güç ölçer ne sunuyor? Orijinal FX Power hakkında sevdiğiniz her şey PLUS GOLD/XAU güç analizi Daha da hassas hesaplama sonuçları Ayrı ayrı yapılandırılabilir analiz dönemleri Daha da iyi performans için özelleştirilebilir hesaplama limiti Özel çokluDaha fazlasını görmek isteyenler için örnek ayarlar Her grafikte en sevdiğiniz renkler i
                    Sizlere ON Trade Waves Patterns Harmonic Elliot Wolfe'u tanıtmaktan mutluluk duyarız. Bu, manuel ve otomatik yöntemleri kullanarak piyasada çeşitli desenleri tespit etmek için tasarlanmış gelişmiş bir göstergedir. İşte nasıl çalıştığı: Harmonik Desenler: Bu gösterge, grafiğinizde görünen harmonik desenleri tanımlayabilir. Bu desenler, Scott Carney'in "Harmonic Trading vol 1 & 2" adlı kitabında açıklandığı gibi harmonik ticaret teorisini uygulayan tüccarlar için önemlidir. Onları manuel olarak ç
                    PRO Renko Sistemi, RENKO grafikleri ticareti için özel olarak tasarlanmış son derece hassas bir ticaret sistemidir. Bu, çeşitli ticaret araçlarına uygulanabilen evrensel bir sistemdir. Sistemi etkin piyasa sana doğru ters sinyallerine erişim hakkı denilen ses nötralize eder. Göstergenin kullanımı çok kolaydır ve sinyal üretiminden sorumlu tek bir parametreye sahiptir. Aracı, seçtiğiniz herhangi bir ticaret aracına ve renko çubuğunun boyutuna kolayca uyarlayabilirsiniz. Yazılımımla karlı b
                    Entry Points Pro
                    Yury Orlov
                    4.7 (224)
                    Yeniden boyamadan bir ticarete girmek için doğru sinyaller sağlayan MT5 için en iyi gösterge! Herhangi bir finansal varlığa uygulanabilir: forex, kripto para birimleri, metaller, hisse senetleri, endeksler. MT5 versiyonu burada Oldukça doğru alım satım sinyalleri sağlayacak ve bir alım satımı açıp kapatmanın en iyi zamanını size söyleyecektir. Göstergeyi ödeyen yalnızca bir sinyali işleme örneğiyle videoyu (6:22) izleyin! Çoğu tüccar, Giriş Noktaları Pro göstergesinin yardımıyla ilk işl
                    ŞU ANDA %31 INDIRIMLI !!! Yeni Başlayanlar veya Uzman Tüccarlar için En İyi Çözüm! Bu gösterge benzersiz, yüksek kaliteli ve uygun fiyatlı bir ticaret aracıdır çünkü bir dizi tescilli özellik ve gizli bir formül ekledik. Yalnızca BİR grafikle 28 döviz çiftinin tümü için Uyarılar verir. Yeni bir trendin veya scalping fırsatının tam tetik noktasını belirleyebildiğiniz için ticaretinizin nasıl gelişeceğini hayal edin! Yeni temel algoritmalar üzerine inşa edilen bu sistem, potansiyel işlemler
                    Öncelikle, bu Trading Sisteminin Non-Repainting, Non-Redrawing ve Non-Lagging Gösterge olduğunu vurgulamak önemlidir, bu da profesyonel ticaret için ideal hale getirir. "Smart Support and Resistance Trading System", yeni ve deneyimli tüccarlar için özel olarak tasarlanmış gelişmiş bir göstergedir. Forex piyasasında tüccarları hassasiyet ve güvenle donatır. Bu kapsamlı sistem, 7'den fazla strateji, 10 gösterge ve günlük ticaret stratejisi, swing ticaret stratejisi, destek ve direnç stratejisi,
                    TrendDecoder Premium
                    Christophe, Pa Trouillas
                    5 (2)
                    Aralıkları ve bir sonraki olası hamleleri belirleyin   |  Trendlerin en erken sinyallerini ve gücünü alın   |  Geri dönüşten önce net çıkışlar alın   |  Fiyatın test edeceği Fibo seviyelerini tespit edin Gecikmesiz, takip edilmeyen gösterge - manuel ve otomatik ticaret için ideal - tüm varlıklar ve tüm zaman birimleri için uygun Sınırlı süreli teklif >>   %50 İNDİRİM Satın aldıktan sonra, kişiselleştirilmiş ayarlar için bu kanaldan benimle iletişime geçin . MT5   sürümü:   buraya tıklayın Tam y
                    TakePropips Donchian Trend Pro
                    Eric John Pajarillaga Aldana
                    4.82 (17)
                    TakePropips Donchian Trend Pro   (MT4), Donchian Kanalı'nı kullanarak trendin yönünü otomatik olarak tespit eden ve size ticarete giriş ve çıkış sinyalleri sağlayan güçlü ve etkili bir araçtır! Bu çok işlevli gösterge, bir trend tarayıcı, ticaret sinyalleri, istatistiksel panel, tarayıcı, ticaret oturumları ve uyarı geçmişi panosu içerir. Size ticaret sinyalleri sağlamak ve çizelgeleri analiz ederek saatlerce tasarruf etmenizi sağlamak için tasarlanmıştır! Kullanım kılavuzunu ve kurulum kılavuzu
                    Zeus Göstergesi Tanıtımı: Trading'de Karları Kırmak İçin Son Derece Verimli Bir Araç. Bu gösterge, kopma stratejileri ile derinlemesine analiz ihtiyacını ortadan kaldırarak ticareti basit hale getirir. Önceden belirlenmiş zaman aralıklarınıza dayalı olarak otomatik olarak bölgeleri çizer, Stop Loss (SL), Take Profit (TP) ve Takip Eden Stop seviyelerini önerir. Zeus Göstergesi, fiyatın alım veya satım giriş noktalarına yaklaştığında sizi hızlı bir şekilde uyaracak ve sinyal okları gösterecektir.
                    FX Volume
                    Daniel Stein
                    4.6 (35)
                    Sabah Brifingimiz aracılığıyla ayrıntılar ve ekran görüntüleri ile günlük piyasa güncellemenizi alın burada mql5 ve on Telegram ! FX Volume, bir brokerin bakış açısından piyasa duyarlılığı hakkında GERÇEK bir fikir veren İLK ve TEK hacim göstergesidir. COT raporlarından çok daha hızlı bir şekilde, brokerlar gibi kurumsal piyasa katılımcılarının Forex piyasasında nasıl konumlandıklarına dair harika bilgiler sağlar. Bu bilgileri doğrudan grafiğinizde görmek, ticaretiniz için gerçek oyun değiştir
                    Quantum Heiken Ashi PRO MT4
                    Bogdan Ion Puscasu
                    4.43 (7)
                    Tanıtımı       Quantum Heiken Ashi PRO   çizelgeleri Pazar eğilimleri hakkında net bilgiler sağlamak için tasarlanan Heiken Ashi mumları, gürültüyü filtreleme ve yanlış sinyalleri ortadan kaldırma yetenekleriyle ünlüdür. Kafa karıştırıcı fiyat dalgalanmalarına veda edin ve daha sorunsuz, daha güvenilir bir grafik sunumuna merhaba deyin. Quantum Heiken Ashi PRO'yu gerçekten benzersiz kılan şey, geleneksel şamdan verilerini okunması kolay renkli çubuklara dönüştüren yenilikçi formülüdür. Kırmızı v
                    Cycle Sniper
                    Elmira Memish
                    4.41 (34)
                    NEW YEAR SALE PRICE FOR LIMITED TIME!!! Please contact us after your purchase and we will send you the complimentary indicators to complete the system Cycle Sniper is not a holy grail but when you use it in a system which is explained in the videos, you will feel the difference. If you are not willing to focus on the charts designed with Cycle Sniper and other free tools we provide, we recommend not buying this indicator. We recommend watching the videos about the indiactor and system before pu
                    RelicusRoad Pro
                    Relicus LLC
                    4.78 (139)
                    Şimdi 147 $ (birkaç güncellemeden sonra 499 $ 'a yükseliyor) - Sınırsız Hesaplar (PC'ler veya Mac'ler) RelicusRoad Kullanım Kılavuzu + Eğitim Videoları + Özel Discord Grubuna Erişim + VIP Durumu PİYASAYA BAKMAK İÇİN YENİ BİR YOL RelicusRoad, forex, vadeli işlemler, kripto para birimleri, hisse senetleri ve endeksler için dünyanın en güçlü ticaret göstergesidir ve yatırımcılara kârlı kalmaları için ihtiyaç duydukları tüm bilgileri ve araçları sağlar. Başlangıç ​​seviyesinden ileri seviyey
                    GOLD Impulse with Alert
                    Bernhard Schweigert
                    4.56 (9)
                    Bu gösterge, 2 ürünümüz Advanced Currency IMPULSE with ALERT  +   Currency Strength Exotics  'in süper bir kombinasyonudur. Tüm zaman dilimleri için çalışır ve 8 ana para birimi artı bir Sembol için grafiksel olarak güç veya zayıflık dürtüsünü gösterir! Bu Gösterge, Altın, Egzotik Çiftler, Emtialar, Endeksler veya Vadeli İşlemler gibi herhangi bir sembol için para birimi gücü ivmesini göstermek için uzmanlaşmıştır. Türünün ilk örneğidir, Altın, Gümüş, Petrol, DAX, US30, MXN, TRY, CNH vb.
                    Gann Signal
                    Kirill Borovskii
                    Gann Signal is a very simple indicator at first glance, but hidden inside is many years of experience in studying W.D.Ganna methods. The indicator gives accurate BUY/SELL signals, without redrawing. The indicator is very easy to use. All you need to do is attach it to your chart and follow its recommendations. The indicator constantly analyzes the market for entry opportunities. When such an opportunity appears, the indicator gives a signal in the form of an arrow. I repeat, all signals are NOT
                    Yazarın diğer ürünleri
                    True Direction Oscillator
                    Muhammad Elbermawi
                    4.89 (493)
                    Veya "Saf Momentum " ilkesini kullanarak fiyat değişim oranını ölçen bir endeks olan (TDO). Bir menkul kıymet fiyatı 10'dan 15'e yükseldiğinde, fiyat değişim oranı %150'dir, ancak 15'ten 10'a düştüğünde, fiyat değişim oranı sadece %33.3'tür. Bu nedenle, "Fiyat Değişim Oranı" (ROC) veya "Momentum" gibi teknik analiz göstergeleri, artan fiyat hareketleri için azalan hareketlere göre daha yüksek değerler verir. TDO, yatırımcıların momentumu doğru okumalarına yardımcı olmak için bu sorunu düzeltir
                    Moving Average Cloud
                    Muhammad Elbermawi
                    4.93 (14)
                    Veya "MAC". Bu, trendi yakalamanıza ve takas etmenize yardımcı olmak için tasarlanmış bir göstergedir. Bu göstergenin arkasındaki fikir, sonraki adımlarda açıklanabilir: Hızlı hareket eden bir ortalama Zarf çizin. Yavaş hareket eden bir ortalama Zarf çizin. MAC Üst Bandı, her iki Zarfın en yükseği arasındaki en yüksek değerdir. MAC Alt Bandı, her iki Zarfın alt kısmı arasındaki en düşük değerdir. MAC Histogram Bulutu, yön değişikliğinizi göstermek için iki bant arasındaki mesafeyi doldurur. M
                    Bermaui Bands
                    Muhammad Elbermawi
                    4.94 (89)
                    Bermaui Bantları (BB), değişen ve trend olan fiyat hareketleri arasında filtrelemeye yardımcı olan bir teknik analiz aracıdır. Bu göstergenin arkasındaki fikir, sonraki adımlarda açıklanabilir: 0 ile 100 arasında hareket eden bir osilatör olarak Standart Sapmayı hesaplayın. Ben buna Bermaui Sapma yüzdesi (BD %) adını vereceğim. "BD %" sıfıra yakınsa, oynaklık en uç noktadadır. Ayrıca "BD %" 100'e yakınsa oynaklık çok düşüktür. Yüksek oynaklık, trend olan bir piyasa için büyük bir olasılık anlamı
                    Bermaui Manual EA
                    Muhammad Elbermawi
                    5 (10)
                    Bu, ızgara sistemi ticareti yapan yarı otomatik bir uzman danışmandır. Buradaki fikir, piyasada kademeli olarak farklı pozisyonlar almak ve daha sonra onlar için başa baş seviyesini hesaplamaktır. Fiyatlar bu başabaş noktasını önceden belirlenmiş bir mesafe kadar aştığında, açılan tüm emirler kapanır. Önemli bilgi İşte kullanıcı kılavuzu:   https://www.mql5.com/en/blogs/post/730567 Bu EA'yı diğer ürünlerimden herhangi biriyle burada deneyebilirsiniz: https://www.mql5.com/en/users/bermaui314/
                    Bermaui Deviation Percent
                    Muhammad Elbermawi
                    4.94 (129)
                    Veya oynaklığı puan yerine yüzde olarak ölçen bir oynaklık endeksi olan ( BD% ). BD% fikri, yüzde 0 ile 100 arasında hareket eden Klasik Standart Sapma'ya (CSD) bağlı bir endeks yapmaktır. Farklı zaman dilimlerinde veya farklı zaman dilimlerinde aynı güvenlik için oynaklığı karşılaştırmak için BD%'yi kullanabilirsiniz. Ayrıca, farklı piyasalardaki farklı menkul kıymetler arasındaki oynaklığı puan yerine yüzde cinsinden karşılaştırmak için BD%'yi kullanabilirsiniz. "BD%" NASIL KULLANILIR
                    MASR Bands
                    Muhammad Elbermawi
                    5 (10)
                    Ya da E Oving bir verage S upport R esistance Gruplar. MASR Bantları göstergesi, destek ve direnç seviyeleri olarak birlikte çalışan iki bantla çevrili hareketli bir ortalamadır. İstatistiksel olarak, MASR Bantları zamanın %93'ünde fiyat mumları içerir. Adımlarda şu şekilde hesaplanır: 1. İlk adım, bir X dönemi için en yüksek yüksek (HHV) ve en düşük düşük (LLV) hesaplamaktır. 2. İkinci adım, aralarındaki mesafenin yüzde olarak ne kadar geniş olduğunu bulmak için HHV'yi LLV'ye bölmektir.
                    Bermaui Pin Bars
                    Muhammad Elbermawi
                    5 (22)
                    Bermaui Pim Çubukları Veya (BPB), grafikte Pin Bar fiyat hareket modelini bulan bir göstergedir. Pin Barlar, Hammer, Inverted-Hammer, Hanging Man, Shooting Star, Dragon Fly Doji veya Grave Stone Doji gibi uzun üst veya alt gölgeli ve çok küçük gövdeli Japon şamdanlarına alternatif olan klasik bir çubuk deseni olan "Pinokyo Çubukları" için bir kısayoldur. . Bermaui Pin Bars göstergesi, sonraki adımlarda açıklanabilecek bir formüle bağlı olarak bu kalıbı bulur: İlk BPB'de mum gövdesinin merkez
                    BACD Cloud
                    Muhammad Elbermawi
                    4.57 (7)
                    Ya da yüzde olarak göstermektedir eğilim yönü ve önlemler gücünü olduğu bir osilatördür B ermaui bir verage Cı onvergence D ivergence bulut. BACD Bulut hesaplaması aşağıdaki gibidir: 1- İki üstel hareketli ortalamayı hesaplayın. Bunlardan biri diğerinden daha hızlıdır. İlkini (Hızlı) ve ikincisini (Yavaş) arayacağım 2- Aralarındaki merkezi bulun, burada: Merkez MA = (Hızlı + Yavaş) / 2 3- BACD Çizgisini aşağıdaki gibi hesaplayın: BACD = 100 * (Hızlı / Merkez MA) 4- BACD'nin üstel hareke
                    Or DBD%. The indicator consists of colored tape that shows trading signals depending on two Bermaui Deviation Oscillator (BD%) and two moving averages. Bermaui Deviation Percent is a volatility index that measures volatility in percent rather than points. The idea of BD% is to make an index depending on Classic Standard Deviation (CSD) that moves between 0 and 100 percent. Important Information DBD% expert advisor example:  https://www.mql5.com/en/blogs/post/731145 If you want to know mor
                    Bermaui Channel
                    Muhammad Elbermawi
                    5 (27)
                    This is a price channel that shows five important price levels on the chart. Those levels are: 1. The Highest High (HH) of the previous x bars. 2. The Highest Low (HL) of the previous x bars. 3. The Center Line. 4. The Lowest High (LH) of the previous x bars. 5. The Lowest Low (LL) of the previous x bars. How does Bermaui Channels Captures Overbought  area Think of the distance between HH and HL levels as an overbought area. When the price candles or bars crosses the HL to the upside this
                    Bermaui RSI Candles
                    Muhammad Elbermawi
                    5 (7)
                    Bu göstergenin fikri, alım ve satım sinyalleri oluşturmak için fiyat çizelgeleri ile karşılaştırılabilecek mum şeklinde RSI çizmektir. Gösterge benim buluşum değil. Birkaç yıl önce internette kurdum. Kodu güncelledim, uyarı işlevleri ekledim, Bermaui Utilities araç grubunu ekledim. Gösterge, mum çubukları çizmek için kullanılan tüm fiyatların RSI'sını hesaplar (açık, yüksek, düşük ve kapalı RSI). RSI mumlarını yüksek fitili çekmek için en yükseklerini ve RSI mumlarını düşük fitili çekmek için
                    Horus EA
                    Muhammad Elbermawi
                    3.67 (3)
                    MT4 için Horus EA Binlerce yıl önce, eski Mısırlılar topraklarını ölçmek ve mallarını tartmak için kullandıkları bir sayma sistemi icat ettiler. Bu sistem " Horus'un Gözü " olarak biliniyordu. Horus'un Gözü, tanrı Osiris efsanesiyle ilişkilendirildi ve firavunların kutsal sembollerinden biri oldu. Ünlü "Martingale Sistemi"nden %89 daha güvenli olan negatif ilerlemeli bir para yönetim sistemi oluşturmak için Horus'un Gözü'ndeki Fibonacci dizisiyle matematiksel denklemleri kullandım. EA'nın te
                    Filtrele:
                    udayan datta
                    640
                    udayan datta 2024.01.27 11:51 
                     

                    Indicator looks perfectly good and working fine, looking forward to learn it

                    leroy
                    275
                    leroy 2023.06.03 01:25 
                     

                    I started reading about the Keltner Channel and was surprised to see a simple yet effective indicator being sold/rented for a good price. I recently just rented the indicator and plan to test it out with my personal strategy. Thanks for creating this indicator!

                    elite luis
                    3331
                    elite luis 2023.03.06 14:06 
                     

                    Author very responsive and fully provide video tutorial on how to use, add as another layer of confluence nice! Thanks!

                    davevicens
                    321
                    davevicens 2022.12.22 16:03 
                     

                    Very good indicator. , i use it together with bermaui bands . It´s amazing!!!!

                    Thin Vu Xuan
                    270
                    Thin Vu Xuan 2022.12.07 03:06 
                     

                    Good

                    prim forex
                    90
                    prim forex 2022.11.03 02:43 
                     

                    To be honest, I like the indicaor best now. It was no too difficult until start Mekong pips. Highly recommended.

                    Muhammad Elbermawi
                    52239
                    Geliştiriciden yanıt Muhammad Elbermawi 2022.11.03 05:04
                    Thanks, Hiro Koyama
                    mrkaib
                    1037
                    mrkaib 2022.10.13 19:33 
                     

                    very good indicator

                    luis066
                    29
                    luis066 2022.09.03 20:38 
                     

                    this is a great product, i use it together with bermaui bands and i always have the correct view of the market. low price and a lot of quality.

                    awasthisp
                    724
                    awasthisp 2022.08.23 13:27 
                     

                    No doubt about his software's result and grade . Previous to this i have already purchased and rented his maximum software nothing doubt about any thing.

                    rodbizness
                    84
                    rodbizness 2022.06.11 01:20 
                     

                    Muhammad, thank you so much for the Big Job.

                    deimy
                    523
                    deimy 2022.04.15 00:55 
                     

                    Very good indicator, thank you

                    Doctornoob
                    329
                    Doctornoob 2022.03.25 22:44 
                     

                    good addition to my trading

                    yellowplus2009
                    212
                    yellowplus2009 2022.03.19 10:22 
                     

                    Great product.Highly recommended indicator.

                    moayad alhadidid
                    33
                    moayad alhadidid 2022.02.16 13:33 
                     

                    I bought the product for a month to try it, and the CKC oscillator did not appear

                    Muhammad Elbermawi
                    52239
                    Geliştiriciden yanıt Muhammad Elbermawi 2022.03.18 17:45
                    If there is any problem then why didn't you contact me?!
                    OLADIMEJI ADEBAJO IWALESIN
                    3665
                    OLADIMEJI ADEBAJO IWALESIN 2022.01.27 06:52 
                     

                    Great indicator from Muhammad as always. 5***** buy and sell entry points.

                    ck15220
                    714
                    ck15220 2021.10.18 15:39 
                     

                    Very good indicators make me make a lot of profits. Thank you

                    Muhammad Elbermawi
                    52239
                    Geliştiriciden yanıt Muhammad Elbermawi 2021.10.18 18:07
                    Thanks, my friend. I appreciate it. 🙏💚
                    adonis4ex
                    6278
                    adonis4ex 2021.10.01 03:26 
                     

                    Kullanıcı incelemeye herhangi bir yorum bırakmadı

                    Muhammad Elbermawi
                    52239
                    Geliştiriciden yanıt Muhammad Elbermawi 2021.10.02 08:38
                    Thanks, Adonis. I appreciate it. 🙏💚
                    Johnny Long
                    99
                    Johnny Long 2021.09.27 14:54 
                     

                    the product and the author is great!

                    Muhammad Elbermawi
                    52239
                    Geliştiriciden yanıt Muhammad Elbermawi 2021.10.01 09:10
                    Thanks 🙏💚
                    James Wioos
                    412
                    James Wioos 2021.08.16 18:07 
                     

                    A fantastic indicator by the Author, best indicator for new traders and experienced trader. Definelty recommand any product by Muhammad, this is my second product by this author and I am very happy with the performance of the indicator.

                    Muhammad Elbermawi
                    52239
                    Geliştiriciden yanıt Muhammad Elbermawi 2021.08.16 22:23
                    🙏 Thanks a lot for your trust, James. ✅ I hope that you enjoy all the trading examples on the telegram channel:
                    https://t.me/BermauiChannel
                    ambho
                    90
                    ambho 2021.07.05 20:32 
                     

                    Good service and indicator

                    Muhammad Elbermawi
                    52239
                    Geliştiriciden yanıt Muhammad Elbermawi 2021.08.06 21:48
                    Thanks for the great review and stars 🙏💚
                    You can join my telegram group from here:
                    https://t.me/BermauiChannel
                    123
                    İncelemeye yanıt
                    Sürüm 2.2 2020.03.08
                    Added a buffer for Signals to make it easy for developers to use the indicator in building expert advisors.

                    The new buffer is no. 2. It is called "BuySell". It works Like this:
                    1) If BuySell = +1 then buy
                    2) If BuySell = -1 then Sell
                    Sürüm 2.1 2020.03.02
                    Added an icon to the description.
                    Sürüm 2.0 2020.02.26
                    1. Enhanced the calculation method.
                    2. Added color lists, for a better chart view.
                    3. Enhanced all the alerts.
                    4. Arranged the inputs to be more user friendly.
                    5. Added buffers to indicator description.
                    .
                    Note:

                    I didn't make any changes on CKC basic formula. It is still the same.
                    I didn't make any changes in the indicator buffers.