AIS Advanced Grade Feasibility MT5
- Göstergeler
- Aleksej Poljakov
- Sürüm: 1.1
- Güncellendi: 24 Haziran 2022
- Etkinleştirmeler: 5
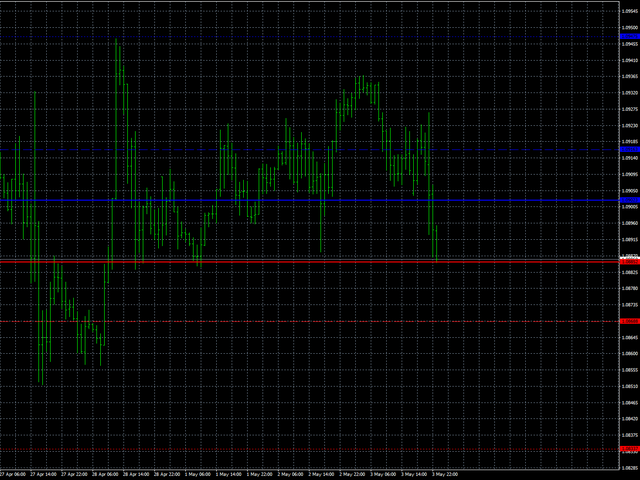
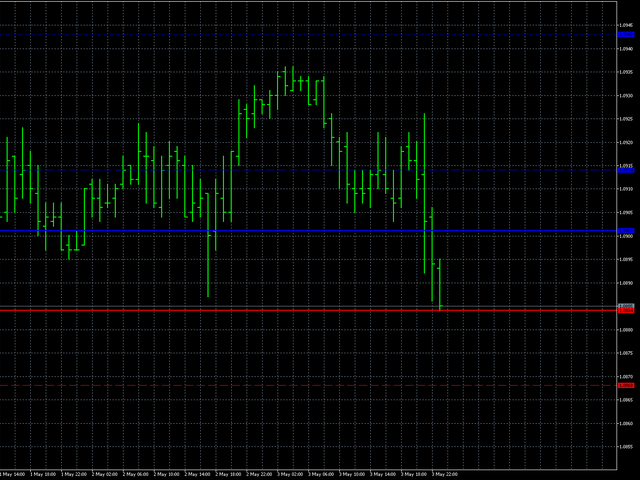
AIS Advanced Grade Fizibilite göstergesi, fiyatın gelecekte ulaşabileceği seviyeleri tahmin etmek için tasarlanmıştır. Görevi, son üç çubuğu analiz etmek ve buna dayalı bir tahmin oluşturmaktır. Gösterge herhangi bir zaman diliminde ve herhangi bir döviz çiftinde kullanılabilir. Ayarların yardımıyla, tahminin istenen kalitesini elde edebilirsiniz.
Tahmin derinliği - istenen tahmin derinliğini çubuklar halinde ayarlar. Bu parametrenin 18-31 aralığında seçilmesi önerilir.
Bu sınırların ötesine geçebilirsiniz. Ancak bu durumda, tahmin seviyelerinin "yapışması" (18'den küçük değerler için) veya seviyelerin aşırı genişliği (31'den büyük değerler için) mümkündür.
Güven düzeyi 1, Güven düzeyi 2 ve Güven düzeyi 3 - tahmin güven düzeyleri. 1-99 arasında ayarlanabilir. Güven düzeyi 1, Güven düzeyi 2'den daha büyük olmalı ve Güven düzeyi 3, hepsinden en küçüğü olmalıdır.
Bu seviyelerin her biri, Tahmin Derinliği parametresi tarafından belirlenen çubuk sayısı için fiyatın bu değere ulaşma olasılığının yüzdesini gösterir.
Renk seviyesi yüksek ve Renk seviyesi düşük - çizgilerin renklerini seçmenize izin verir
Stil seviyesi - seviyelere karşılık gelen çizgilerin stilini seçmenizi sağlar
Genişlik seviyesi - seviyelere karşılık gelen çizgilerin genişliğini ayarlar

Kullanıcı incelemeye herhangi bir yorum bırakmadı