Heiken Ashi MT5 Indicator by PipTick
- Göstergeler
- Michal Jurnik
- Sürüm: 1.1
- Güncellendi: 3 Aralık 2021
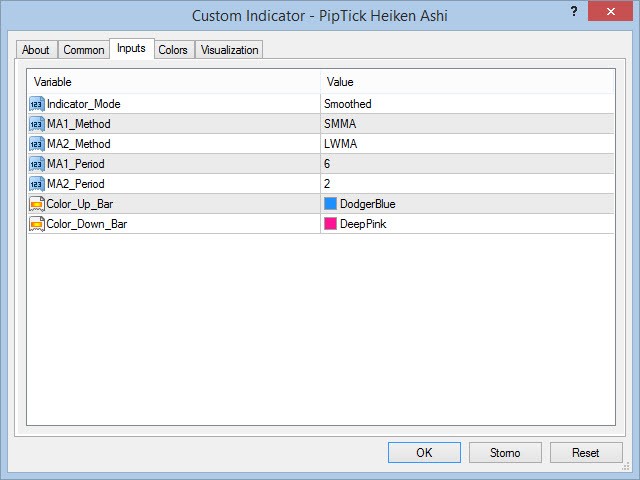
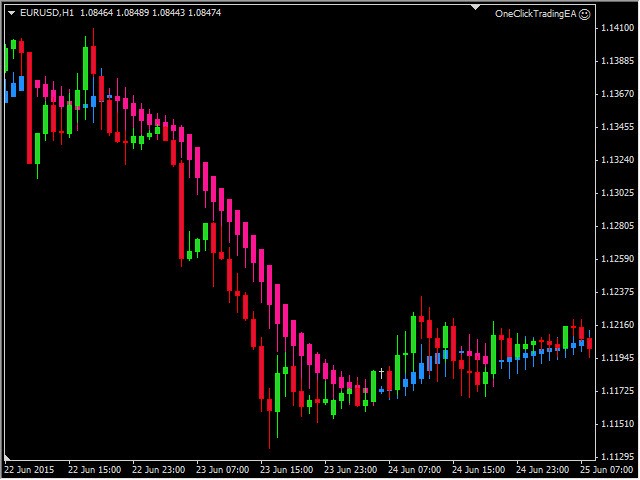
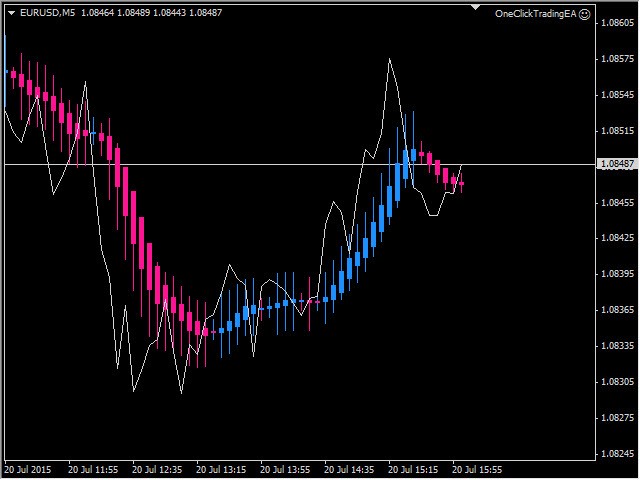
The Heikin Ashi indicator is our version of the Heikin Ashi chart. Unlike competitor products, this indicator offers extensive options for calculating Heikin Ashi candles. In addition, it can be displayed as a classic or smoothed version.
The indicator can calculate Heikin Ashi with moving average by four methods:
- SMA - Simple Moving Average
- SMMA - Smoothed Moving Average
- EMA - Exponential Moving Average
- LWMA - Linear Weighted Moving Average
Main features
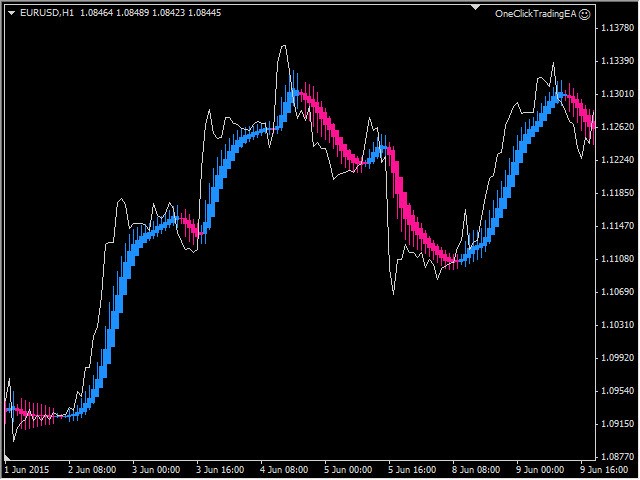
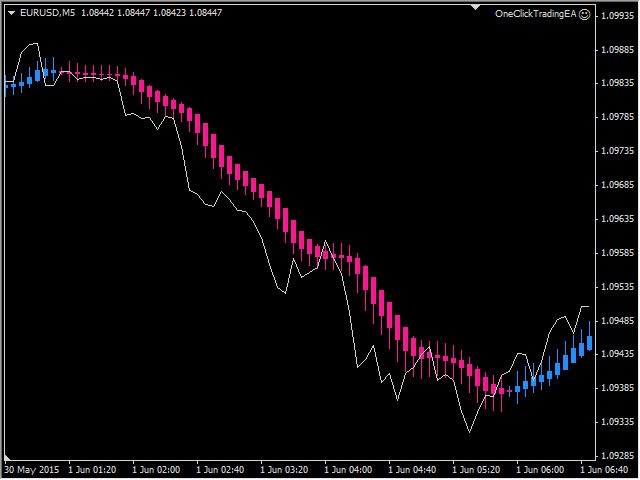
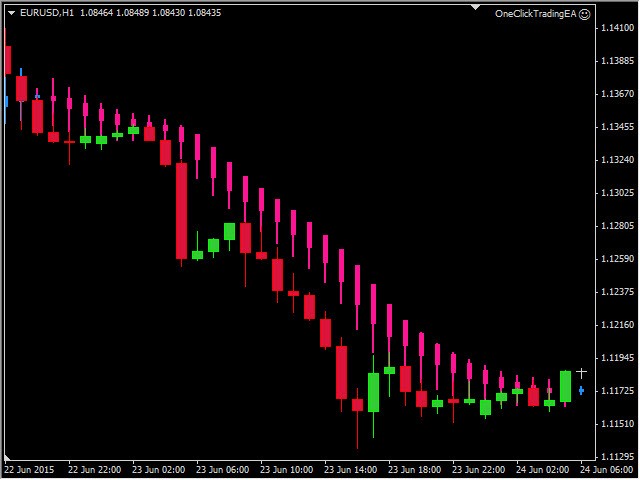
- The indicator shows Heikin Ashi as a classic or smoothed version
- Excellent tool for simple assessment of the trend
- Works on every timeframe (M1, M5, M15, M30, H1, H4, D1, W1, MN)
- The indicator is non-repainting
- Ready for backtesting
- Customizable parameters (Colors, MA periods...)
- High-speed calculation
- Available for MT4 and MT5


a good indicator to use with combination with other indicators.....