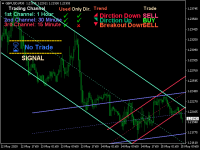
ANDREW’S PITCHFORK TRADING STRATEGY Essentially, Andrew’s Pitchfork is a tool for drawing price channels. While two lines surrounding price are usually enough to draw a channel, the Pitchfork has an extra line. It is the median line or the handle of the Pitchfork. The median line is central to this trading method. This is why Andrew’s Pitchfork is also known as the Median Line Method. TRADING RULES There are many ways to
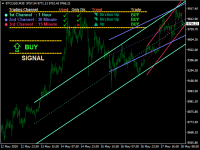
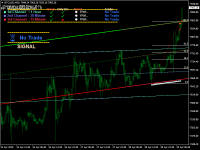
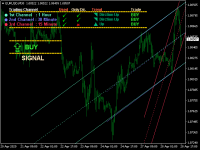
The Price Channel pattern trading strategy is one of the smartest ways to make money trading. The Price Channel pattern represents two trend lines positioned above (channel resistance) and below (channel support) the price. The price action is contained between these two parallel trendlines. The separation between the two trendlines needs to be wide enough if you want to trade inside the Price Channel Pattern. If this is the case, you can buy at the channel support level and sell at
The Price Channel pattern trading strategy is one of the smartest ways to make money trading. The Price Channel pattern represents two trend lines positioned above (channel resistance) and below (channel support) the price. The price action is contained between these two parallel trendlines. The separation between the two trendlines needs to be wide enough if you want to trade inside the Price Channel Pattern. If this is the case, you can buy at the channel support level and sell at
The Price Channel pattern trading strategy is one of the smartest ways to make money trading. The Price Channel pattern represents two trend lines positioned above (channel resistance) and below (channel support) the price. The price action is contained between these two parallel trendlines. The separation between the two trendlines needs to be wide enough if you want to trade inside the Price Channel Pattern. If this is the case, you can buy at the channel support level and sell at
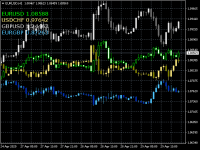
A stochastic oscillator is a momentum indicator comparing a particular closing price of a security to a range of its prices over a certain period of time. The sensitivity of the oscillator to market movements is reducible by adjusting that time period or by taking a moving average of the result. It is used to generate overbought and oversold trading signals, utilizing a 0-100 bounded range of values. This indicator show 15 stochastic on one chart
Only NonFarm Payroll Trade The employment situation is a set of labor market indicators. The unemployment rate measures the number of unemployed as a percentage of the labor force. Non-farm payroll employment counts the number of paid employees working part-time or full-time in the nation's business and government establishments. The average workweek reflects the number of hours worked in the non-farm sector. Average hourly earnings reveal the basic hourly rate
A stochastic oscillator is a momentum indicator comparing a particular closing price of a security to a range of its prices over a certain period of time. The sensitivity of the oscillator to market movements is reducible by adjusting that time period or by taking a moving average of the result. It is used to generate overbought and oversold trading signals, utilizing a 0-100 bounded range of values. This indicator show 15 stochastic on one chart
Валютный метр При торговле на Форексе мы торгуем по паре валют одновременно. Например, EUR / USD. Если мы торгуем по EUR / USD, это означает, что мы ожидаем, что EUR укрепится по отношению к USD. Если у нас короткая позиция по EUR / USD, это означает, что мы ожидаем ослабления евро по отношению к доллару США. Вы должны быть все знакомы с этой концепцией. Ключевым моментом в парах является то, что они просто указывают на силу одной валюты по отношению к другой. Если мы видим, что курс евро /
Этот индикатор работает на основе нескольких известных технических индикаторов в разных временных рамках. Работает. Эти технические показатели включают в себя: • Скользящие средние (MA) • Средний Направленный Индекс (ADX) • Параболическая остановка и разворот (SAR) • Расхождение сходимости скользящего среднего (MACD) • Индекс товарного канала (ТПП) • Осциллятор скользящей средней (OsMA) • Momentum (MOM) • Индекс относительной силы (RSI) • Процентный диапазон Уильямса (WPR) Это бесплатная версия
This Indicator works based on several well-known Technical Indicators in different time frame Works. These Technical Indicators include: Moving Averages (MA) Average Directional Index (ADX) Parabolic Stop and Reverse (SAR) Moving Average Convergence Divergence (MACD) Commodity Channel Index (CCI)
Only NonFarm Payroll Trade The employment situation is a set of labor market indicators. The unemployment rate measures the number of unemployed as a percentage of the labor force. Non-farm payroll employment counts the number of paid employees working part-time or full-time in the nation's business and government establishments. The average workweek reflects the number of hours worked in the non-farm sector. Average hourly earnings reveal the basic hourly rate
Daily GBPUSD trade Our strategy relies on a choppy movement on most Forex pairs during the Asian session. Most traders in London sleep when the Sun shines over the Pacific and this results to a very slow movement of GBPUSD pair between 9:00 PM GMT and 7:00 AM GMT. Input Parameters: Auto GMT shift extern int Broker_GMT_Shift = 0;//Manual Broker GMT shift extern int London_Night = 21; //London Night extern int London_Open = 7; //London Open