Young Ho Seo / Профиль
- Информация
|
10+ лет
опыт работы
|
62
продуктов
|
1170
демо-версий
|
|
4
работ
|
0
сигналов
|
0
подписчиков
|
Harmonic Pattern Indicator - Repainting + Japanese Candlestick Pattern Scanner + Automatic Channel + Many more
https://www.mql5.com/en/market/product/4488
https://www.mql5.com/en/market/product/4475
https://algotrading-investment.com/portfolio-item/harmonic-pattern-plus/
Non Repainting and Non Lagging Harmonic Pattern Indicator – Customizable Harmonic + Japanese Candlestic Pattern Scanner + Advanced Channel + Many more
https://www.mql5.com/en/market/product/41993
https://www.mql5.com/en/market/product/41992
https://algotrading-investment.com/portfolio-item/profitable-pattern-scanner/
Supply Demand Indicator – Multiple Timeframe Scanning Added + Non Repainting + Professional Indicator
https://www.mql5.com/en/market/product/40076
https://www.mql5.com/en/market/product/40075
https://algotrading-investment.com/portfolio-item/ace-supply-demand-zone/
Momentum Indicator – Path to Volume Spread Analysis
https://www.mql5.com/en/market/product/30641
https://www.mql5.com/en/market/product/30621
https://algotrading-investment.com/portfolio-item/excessive-momentum-indicator/
Elliott Wave Indicator for the Power User
https://www.mql5.com/en/market/product/16479
https://www.mql5.com/en/market/product/16472
https://algotrading-investment.com/portfolio-item/elliott-wave-trend/
Forex Prediction - Turn Support and Resistance to the Advanced Strategy
https://www.mql5.com/en/market/product/49170
https://www.mql5.com/en/market/product/49169
https://algotrading-investment.com/portfolio-item/fractal-pattern-scanner/
MetaTrader 4 and MetaTrader 5 Product Page: https://www.mql5.com/en/users/financeengineer/seller#products
Free Forex Prediction with Fibonacci Analysis: https://algotrading-investment.com/2020/10/23/forex-prediction-with-fibonacci-analysis/
Free Harmonic Pattern Signal: https://algotrading-investment.com/2020/12/17/harmonic-pattern-signal-for-forex-market/
============================================================================================================================
Here are the trading education books. We recommend reading these books if you are a trader or investor in Forex and Stock market. In the list below, we put the easy to read book on top. Try to read the easy to read book first and try to read the harder book later to improve your trading and investment.
First Link = amazon.com, Second Link = Google Play Books, Third Link = algotrading-investment.com, Fourth Link = Google Books
Technical Analysis in Forex and Stock Market (Supply Demand Analysis and Support Resistance)
https://www.amazon.com/dp/B09L55ZK4Z
https://play.google.com/store/books/details?id=pHlMEAAAQBAJ
https://algotrading-investment.com/portfolio-item/technical-analysis-in-forex-and-stock-market/
https://books.google.co.kr/books/about?id=pHlMEAAAQBAJ
Science Of Support, Resistance, Fibonacci Analysis, Harmonic Pattern, Elliott Wave and X3 Chart Pattern (In Forex and Stock Market Trading)
https://www.amazon.com/dp/B0993WZGZD
https://play.google.com/store/books/details?id=MME3EAAAQBAJ
https://algotrading-investment.com/portfolio-item/science-of-support-resistance-fibonacci-analysis-harmonic-pattern/
https://books.google.co.kr/books/about?id=MME3EAAAQBAJ
Profitable Chart Patterns in Forex and Stock Market (Fibonacci Analysis, Harmonic Pattern, Elliott Wave, and X3 Chart Pattern)
https://www.amazon.com/dp/B0B2KZH87K
https://play.google.com/store/books/details?id=7KrQDwAAQBAJ
https://algotrading-investment.com/portfolio-item/profitable-chart-patterns-in-forex-and-stock-market/
https://books.google.com/books/about?id=7KrQDwAAQBAJ
Guide to Precision Harmonic Pattern Trading (Mastering Turning Point Strategy for Financial Trading)
https://www.amazon.com/dp/B01MRI5LY6
https://play.google.com/store/books/details?id=8SbMDwAAQBAJ
http://algotrading-investment.com/portfolio-item/guide-precision-harmonic-pattern-trading/
https://books.google.com/books/about?id=8SbMDwAAQBAJ
Scientific Guide to Price Action and Pattern Trading (Wisdom of Trend, Cycle, and Fractal Wave)
https://www.amazon.com/dp/B073T3ZMBR
https://play.google.com/store/books/details?id=5prUDwAAQBAJ
https://algotrading-investment.com/portfolio-item/scientific-guide-to-price-action-and-pattern-trading/
https://books.google.com/books/about?id=5prUDwAAQBAJ
Predicting Forex and Stock Market with Fractal Pattern: Science of Price and Time
https://www.amazon.com/dp/B086YKM8BW
https://play.google.com/store/books/details?id=VJjiDwAAQBAJ
https://algotrading-investment.com/portfolio-item/predicting-forex-and-stock-market-with-fractal-pattern/
https://books.google.com/books/about?id=VJjiDwAAQBAJ
Trading Education Book 1 in Korean (Apple, Google Play Book, Google Book, Scribd, Kobo)
https://books.apple.com/us/book/id1565534211
https://play.google.com/store/books/details?id=HTgqEAAAQBAJ
https://books.google.co.kr/books/about?id=HTgqEAAAQBAJ
https://www.scribd.com/book/505583892
https://www.kobo.com/ww/en/ebook/8J-Eg58EDzKwlpUmADdp2g
Trading Education Book 2 in Korean (Apple, Google Play Book, Google Book, Scribd, Kobo)
https://books.apple.com/us/book/id1597112108
https://play.google.com/store/books/details?id=shRQEAAAQBAJ
https://books.google.co.kr/books/about?id=shRQEAAAQBAJ
https://www.scribd.com/book/542068528
https://www.kobo.com/ww/en/ebook/X8SmJdYCtDasOfQ1LQpCtg
About Young Ho Seo
Young Ho Seo is an Engineer, Financial Trader, and Quantitative Developer, working on Trading Science and Investment Engineering since 2011. He is the creator of many technical indicators, price patterns and trading strategies used in the financial market. He is also teaching the trading practice on how to use the Supply Demand Analysis, Support, Resistance, Trend line, Fibonacci Analysis, Harmonic Pattern, Elliott Wave Theory, Chart Patterns, and Probability for Forex and Stock Market. His works include developing scientific trading principle and mathematical algorithm in the work of Benjamin Graham, Everette S. Gardner, Benoit Mandelbrot, Ralph Nelson Elliott, Harold M. Gartley, Richard Shabacker, William Delbert Gann, Richard Wyckoff and Richard Dennis. You can find his dedicated works on www.algotrading-investment.com . His life mission is to connect financial traders and scientific community for better understanding of this world and crowd behaviour in the financial market. He wrote many books and articles, which are helpful for understanding the technology and application behind technical analysis, statistics, time series forecasting, fractal science, econometrics, and artificial intelligence in the financial market.
If you are interested in our software and training, just visit our main website: www.algotrading-investment.com
Young Ho Seo
Turning Point Prediction for Forex Trading
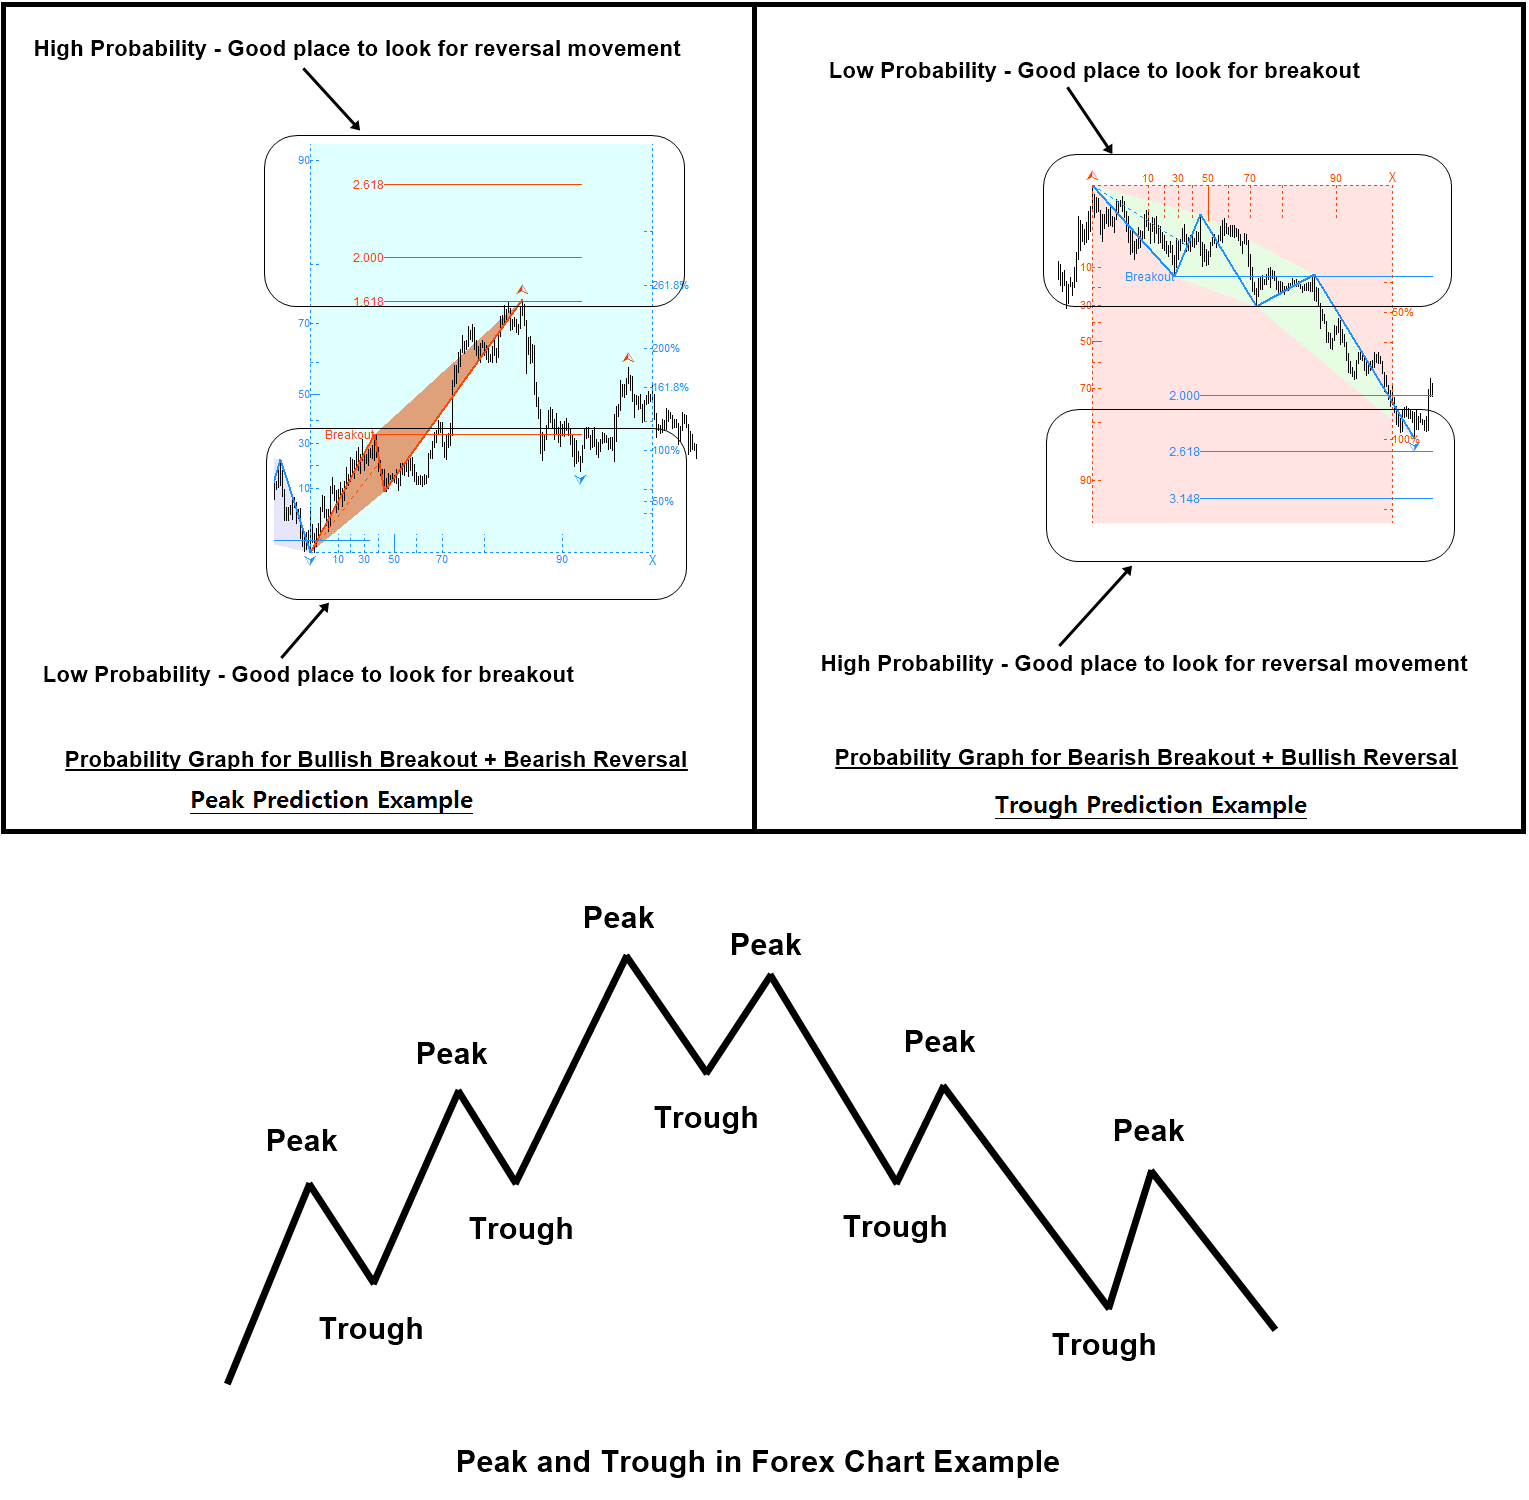
Fractal Pattern Scanner provides the ability to predict the turning point in the financial market. In this article, we provide the practical guide line on how to use the provided turning point prediction for your day trading. The turning point prediction consists of two prediction types. The first one is the prediction of trough. In the trough prediction, we are trying to predict the possible bullish turning point while the price is falling. The second one is the prediction of Peak. In peak prediction, we are trying to predict the possible bearish turning point while the price is rising. The turning point prediction is useful because it tells us the complete story of the price series. For example, it will provide you the visual guidance of price movement + it will also provides the probability information. It is a true hybrid of statistical prediction and technical analysis. As a trader, we can manage the entry and exit with the turning point prediction. Another advantage is that the probability provides us the opportunity for the second level of decision making. This is in fact the important part because many other technical indicator miss to provide the probability information, which we can use for the more advanced level of decision making. With ability to read these probability, practically we can use these turning point prediction to decide the price action in the financial market. They are the good predictor of the price movement assuming you are not misusing the probability information.
Here are the breakdown of the price action with the turning point prediction. We also provide the screenshot to explain each peak and trough cases with some visual aid. As you can see from the screenshot, we can respectively draw two price action for each peak and trough prediction.
When We Predict the Peak:
1. Possible bullish breakout trading opportunity at low probability area
2. Possible bearish reversal trading opportunity at high probability area
When We Predict the Trough:
1. Possible bearish breakout trading opportunity at low probability area
2. Possible bullish reversal trading opportunity at high probability area.
Probably, guessing of these price actions is so natural during the turning point prediction. The screenshot below is for you to confirm your understanding. If the term of peak and trough is not familiar to you, then google some physics articles explaining Peak and Trough in wave cycle. We are using the identical term here as we do not want to reinvent the wheel again. Once, you understand the cycle with peak and trough in those articles, it would be much easier to project the action items for your trading with this article too. In my opinion, the turning point prediction is in its unique position between the statistical prediction and technical analysis. Probably we can consider it as the hybrid of both world. We will recommend you enjoying this scientific advancement for your trading.
For example, you can watch this video titled as “Breakout Trading vs Reversal Trading – Turn Support & Resistance to Killer Strategy” to understand how to control the market timing with this probability tool.
YouTube: https://www.youtube.com/watch?v=UbORmOacKIQ
Below is the landing page for Fractal Pattern Scanner in MetaTrader version.
https://www.mql5.com/en/market/product/49170
https://www.mql5.com/en/market/product/49169
https://algotrading-investment.com/portfolio-item/fractal-pattern-scanner/

Young Ho Seo
Elliott Wave Trading
Below articles will provide a guide to count Elliott Wave using scientific approach. Applying the scientific approach helps to reduce the subjectivity involved in Elliott Wave counting. Hence, you can reproduce your trading outcome over and over.
● Introduction to the Wave Principle
https://algotrading-investment.com/2020/06/04/introduction-to-the-wave-principle/
● Scientific Wave Counting with the Template and Pattern Approach
https://algotrading-investment.com/2020/06/04/scientific-wave-counting-with-the-template-and-pattern-approach/
● Impulse Wave Structural Score and Corrective Wave Structural Score
https://algotrading-investment.com/2020/06/04/impulse-wave-structural-score-and-corrective-wave-structural-score/
● Channelling Techniques
https://algotrading-investment.com/2020/06/04/channelling-technique-elliott-wave/
About this Article
This article is the part taken from the draft version of the Book: Scientific Guide to Price Action and Pattern Trading (Wisdom of Trend, Cycle, and Fractal Wave). Full version of the book can be found from the link below:
https://algotrading-investment.com/portfolio-item/scientific-guide-to-price-action-and-pattern-trading/
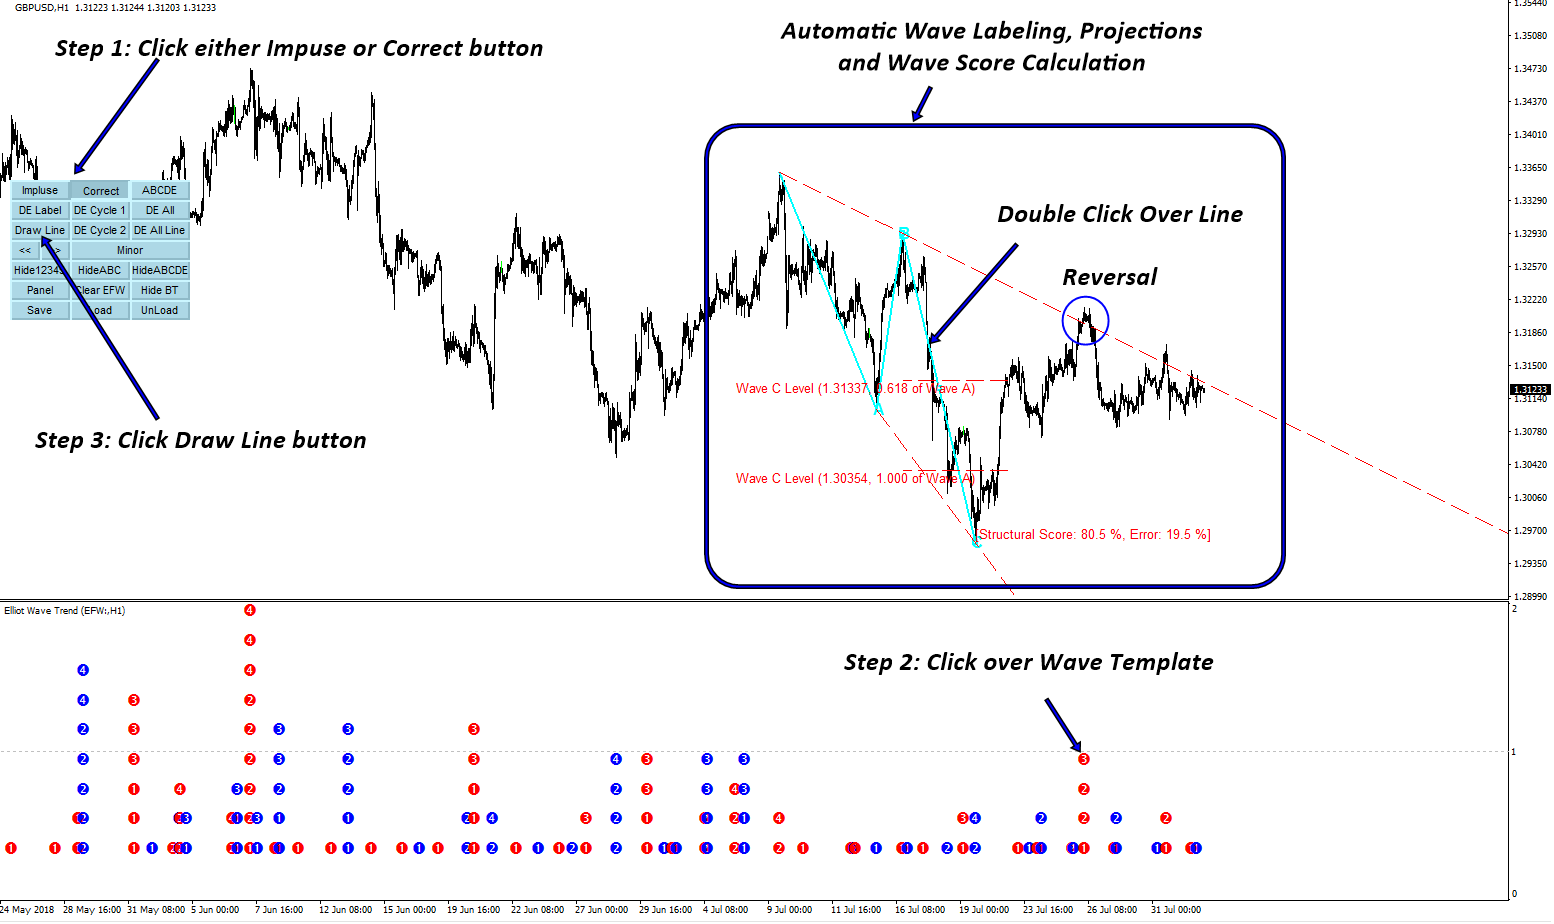
Elliott Wave Trend is extremely powerful indicator. Allow you to perform Elliott wave counting as well as Elliott wave pattern detection. On top of them, it provides built in accurate support and resistance system to improve your trading performance. You can watch this YouTube Video to feel how the Elliott Wave Indicator look like:
https://www.youtube.com/watch?v=Oftml-JKyKM
Here is the landing page for Elliott Wave Trend.
https://www.mql5.com/en/market/product/16479
https://www.mql5.com/en/market/product/16472
https://algotrading-investment.com/portfolio-item/elliott-wave-trend/

Young Ho Seo
Repainting and Non Repainting Harmonic Pattern Indicator
Here is some quick guide on repainting and non repainting Harmonic Pattern indicators. Pattern Scanner based on Fractal Wave detection algorithm can be either repainting or non repainting one. In our products, we provide two choices between repainting and non repainting. Their capability and their price is different.
For Harmonic Pattern Scanner,
Harmonic Pattern Plus (and also Harmonic Pattern Scenario Planner) is the powerful but they are the repainting Harmonic Pattern Scanner. At the same time, they are cheaper. Below is links for them.
https://www.mql5.com/en/market/product/4488
https://www.mql5.com/en/market/product/4475
https://algotrading-investment.com/portfolio-item/harmonic-pattern-plus/
X3 Chart Pattern Scanner is non repainting and non lagging Harmonic Pattern and X3 pattern Scanner. Below is links for them.
https://www.mql5.com/en/market/product/41993
https://www.mql5.com/en/market/product/41992
https://algotrading-investment.com/portfolio-item/profitable-pattern-scanner/
Typically it is easier to trade with non repainting and non lagging Harmonic Pattern indicator. Of course, the signal will be reserved once they are detected. Hence, if you do not mind the cost, we recommend to use X3 Chart Pattern Scanner since it is non repainting Harmonic Pattern and X3 pattern indicator.
However, if you do not mind repainting Harmonic Pattern Indicator and you want to have something cheaper, then use Harmonic Pattern Plus (or Harmonic Pattern Scenario Planner). Many traders are still do not mind to use the repainting Harmonic Pattern Indicator. They are cheaper too.
If you are starter, we do recommend using non repainting Harmonic Pattern Scanner like X3 Chart Pattern Scanner. It is easier to trade with non repainting indicator. At the same time, there are a lot of bonus features inside X3 Chart Pattern Scanner too.
For your information, we are the only one who supply non repainting and non lagging Harmonic Pattern Indicator in the world. Of course, the first one in the world too.
In addition, you can watch the YouTube Video to feel what is the automated harmonic pattern indicator like. For your information, we provides two YouTube videos with title and links below.
YouTube “Harmonic Pattern Indicator (Repainting but non lagging)”: https://youtu.be/CzYUwk5qeCk
YouTube “Non Repainting Non Lagging Harmonic Pattern Indicator”: https://youtu.be/uMlmMquefGQ

Young Ho Seo
Price Breakout Pattern Scanner and Smart Renko
In the last post, we have shown you how to switch on and off many features in our Smart Renko.
https://algotradinginvestment.wordpress.com/2017/07/15/simple-instruction-on-smart-renko/
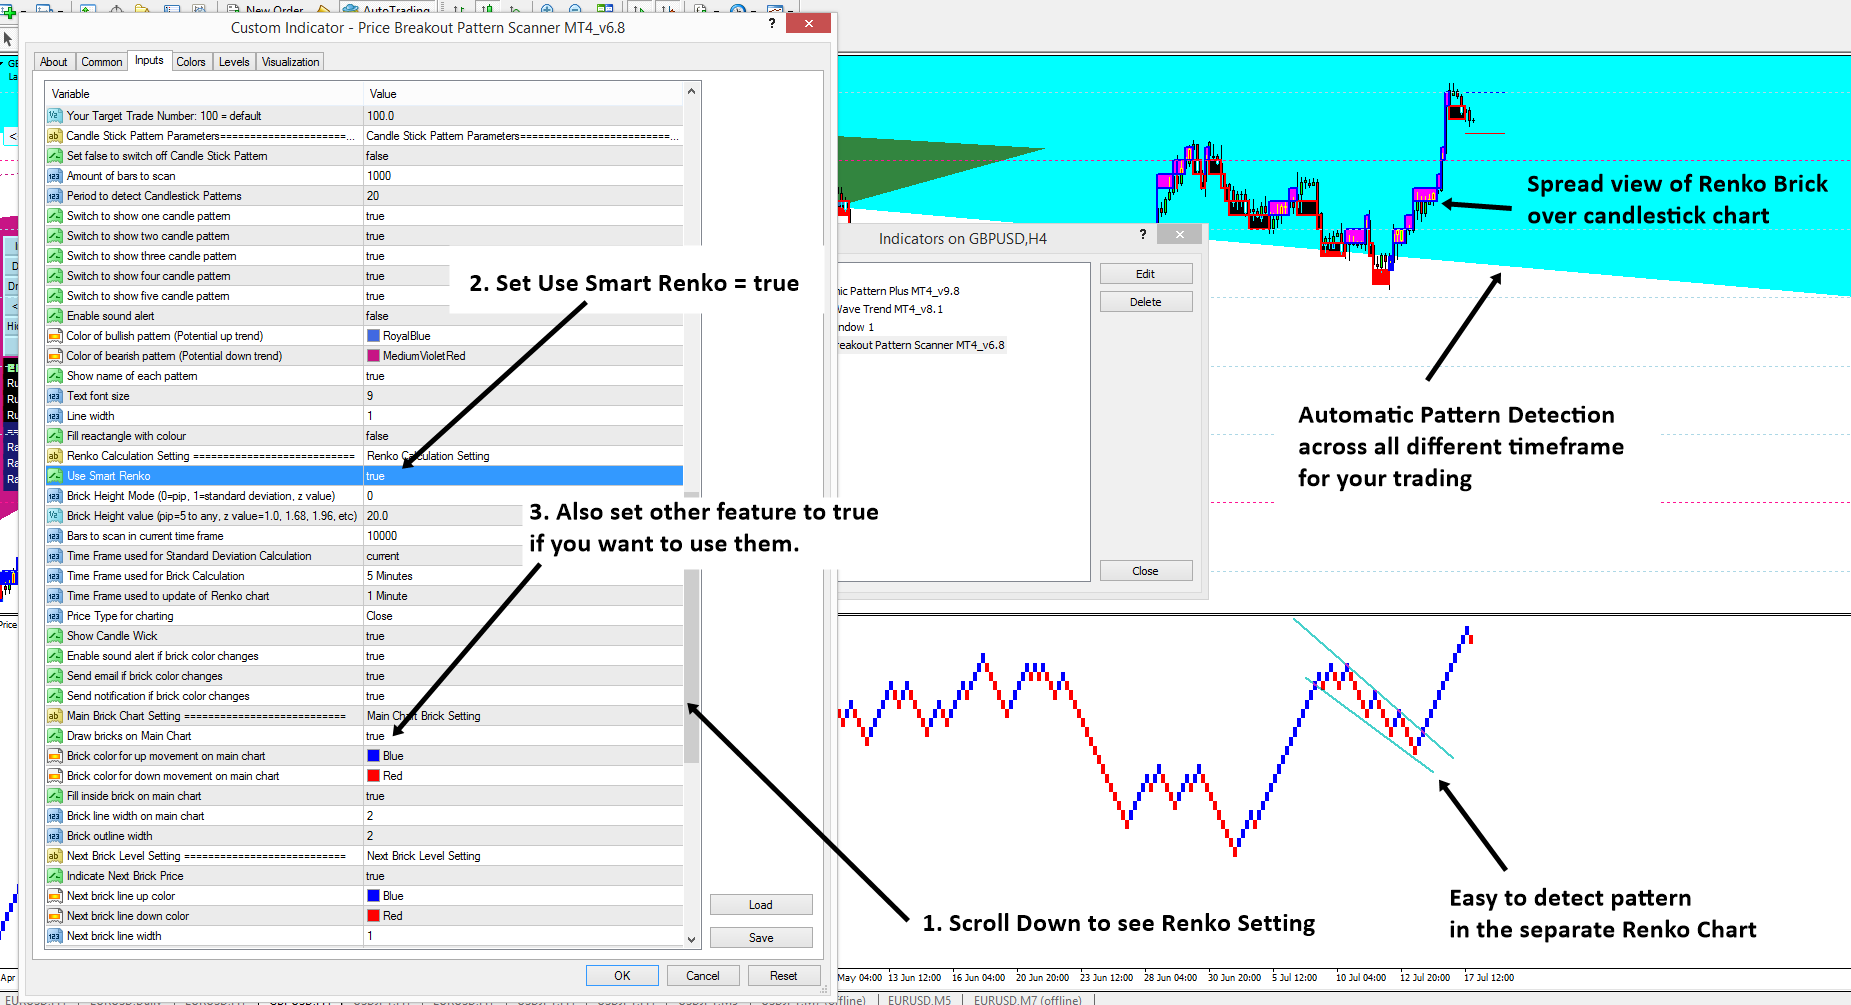
Our Price breakout pattern scanner is very unique tool in the market because it have built in feature for Smart Renko inside. There is reason for that. Smart Renko is really helpful for any pattern detection in the separate window. So they will rainforce your trading decision. Imagine that in the candlestick chart, Price Breakout Pattern Scanner is automatically detecting the patterns for you. In the indicator window, you can also detect any other important patterns readily. If you can collect evidence for your trading from both candlestick chart and renko chart, you can make very powerful trading decision.
In this post, let us show how to switch on and off the smart Renko chart from your price breakout pattern Scanner. Before you are using Smart Renko feature enabled, you might download sufficient history in your chart first. Once you have done it, set Use “Smart Renko = true” from your indicator setting. See the screenshots for your better understanding. Some of our customer know that there is great way of trading with Price breakout pattern scanner and our Harmonic Pattern Plus (or Harmonic Pattern Scenario Planner) If you are curious, you migh check our ebook. We have described the trading principle in details in this book: Price Action and Pattern Trading Course.
https://algotrading-investment.com/portfolio-item/price-breakout-pattern-scanner/
Here are the links for the Price Breakout Pattern Scanner
https://www.mql5.com/en/market/product/4859
https://www.mql5.com/en/market/product/4858
https://algotrading-investment.com/portfolio-item/price-breakout-pattern-scanner/

Young Ho Seo
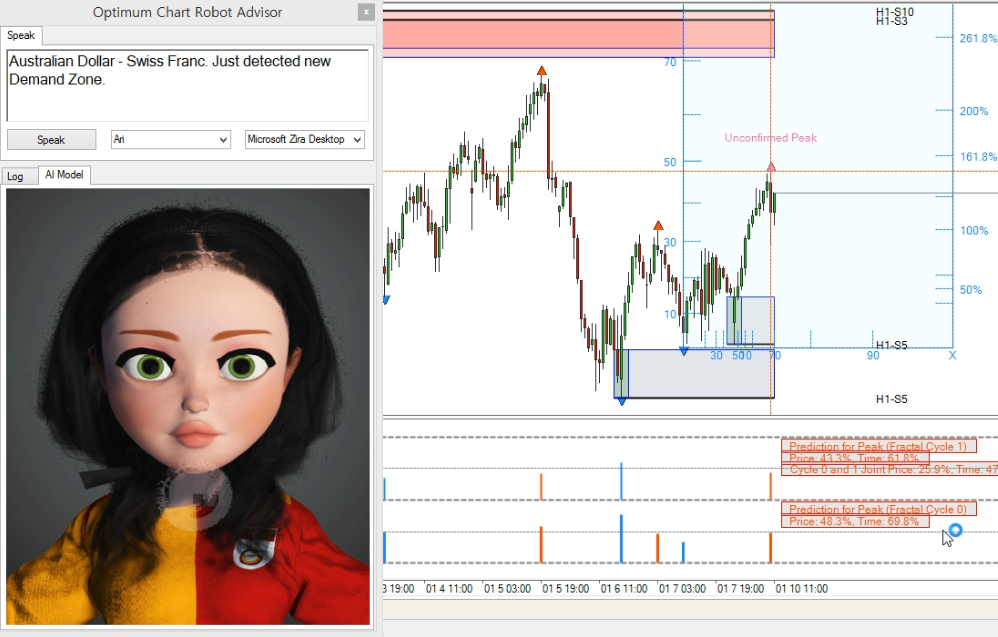
Live Forex Technical Analysis Presentation by Forex Robot Advisor ARI. Sit back and enjoy the entire technical analysis for winning trading.
https://www.youtube.com/watch?v=uTnwKnX9r8E
https://www.youtube.com/watch?v=uTnwKnX9r8E

Young Ho Seo
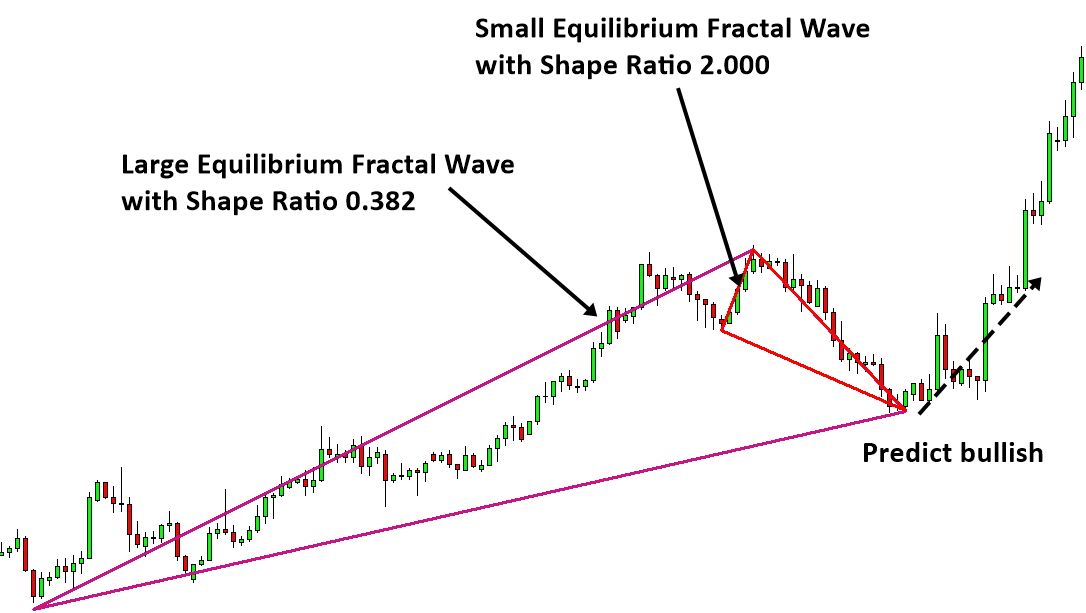
Superimposed Equilibrium Fractal Waves
Third characteristic of equilibrium fractal wave is that smaller equilibrium fractal waves can combine to form a bigger equilibrium fractal wave (superimposed). This third characteristic is often used by a professional trader to improve the predictability of the financial market. For example, instead of puzzling with a set of small equilibrium fractal waves, it is much more accurate to puzzle with both small and big equilibrium fractal waves together to predict the market direction. Now we show some examples of our reversal prediction using this superimposed equilibrium fractal waves. In Figure 3-23 and Figure 3-24, a large Equilibrium fractal wave is overlapping with a small equilibrium fractal wave. We can make the bullish reversal prediction after the last candle is completed. Making the prediction based on the two Equilibrium fractal waves can increase the probability of winning marginally over just using one equilibrium fractal wave.
Figure 3-23: Superimposed Equilibrium fractal wave for bullish reversal trading setup (EURUSD D1).
Figure 3-24: Superimposed Equilibrium fractal wave for bullish reversal trading setup (EURUSD H1).
Likewise, we can use these superimposed equilibrium fractal waves to make the bearish reversal prediction too as shown in Figure 3-25 and Figure 3-26. You can even use three or four equilibrium fractal waves for your prediction. However, the superimposed patterns with three or four equilibrium fractal waves are rare. If they do appears then they can provide a good trading opportunity.
Figure 3-25: Superimposed Equilibrium fractal wave for bearish reversal trading setup (EURUSD H1).
Figure 3-26: Superimposed Equilibrium fractal wave for bearish reversal trading setup (EURUSD M15).
About this Article
This article is the part taken from the draft version of the Book: Scientific Guide to Price Action and Pattern Trading (Wisdom of Trend, Cycle, and Fractal Wave). Full version of the book can be found from the link below:
https://algotrading-investment.com/portfolio-item/scientific-guide-to-price-action-and-pattern-trading/
EFW Analytics provide the graphic rich and fully visual trading styles. In default trading strategy, you will be looking at the combined signal from Superimposed pattern + EFW Channel or Superimposed pattern + Superimposed Channel. In addition, you can perform many more trading strategies in a reversal and breakout mode. You can also run two different timeframes in one chart to enforce your trading decision. Sound alert, email and push notification are built inside the indicator.
Below is the link to the EFW Analytics:
https://algotrading-investment.com/portfolio-item/equilibrium-fractal-wave-analytics/
https://www.mql5.com/en/market/product/27703
https://www.mql5.com/en/market/product/27702

Young Ho Seo
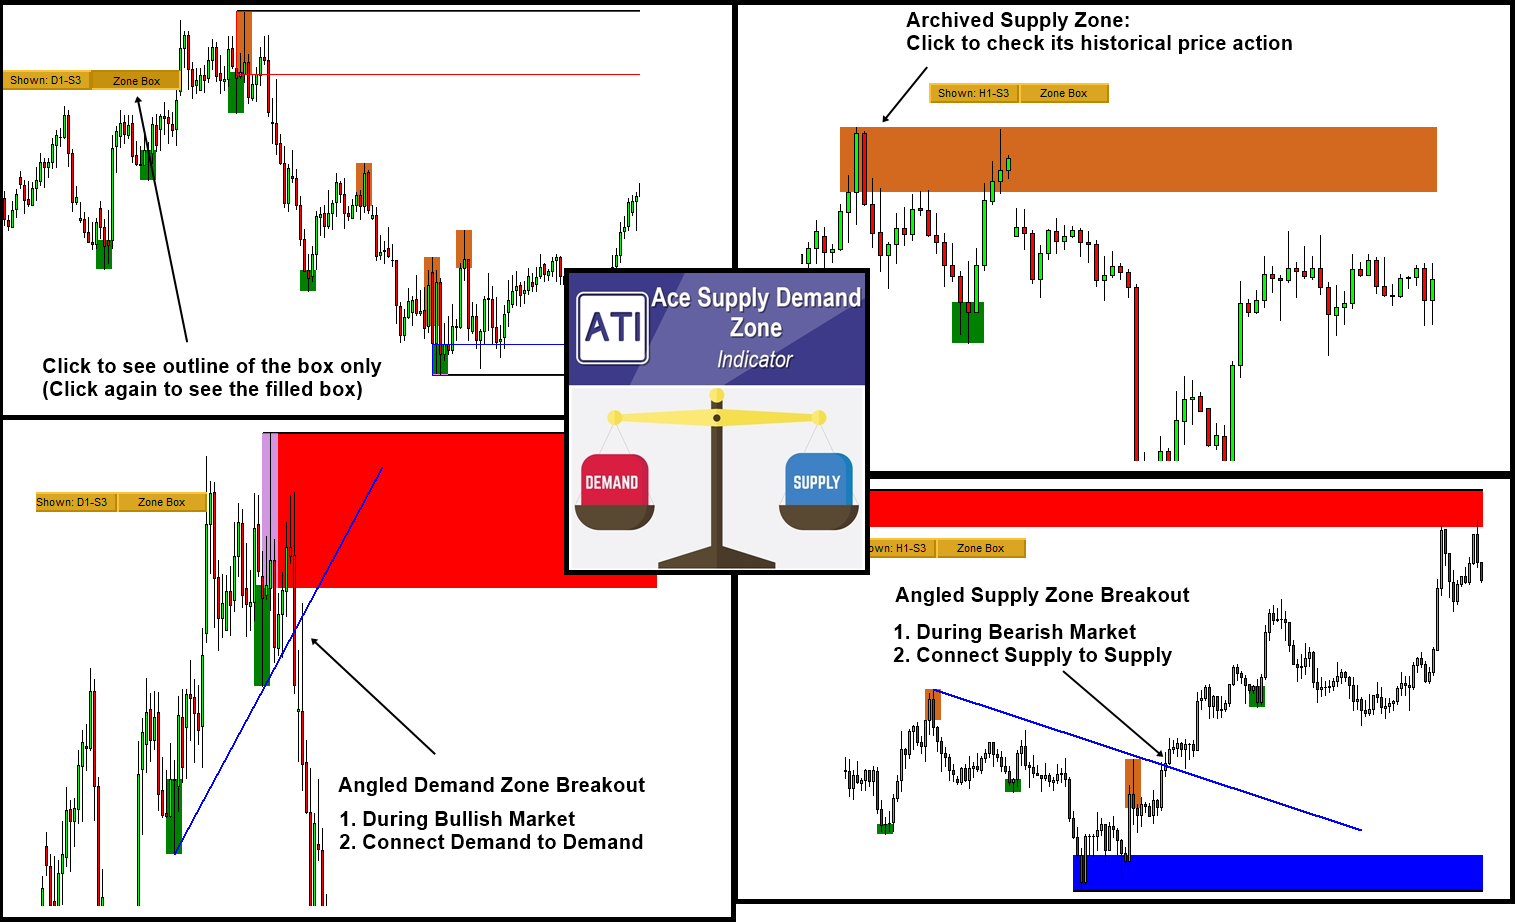
Supply Demand Zone Indicator on MetaTrader 5
MetaTrader 5 is the next generation trading platform developed by Meta Quote who developed MetaTrader 4. MetaTrader 5 is accessible for free of charge for any trader from all over the world. More and more brokers are now offering MetaTrader 5 trading options even including US based firms.
Here is the list of Advanced Supply Demand Zone Indicator. These supply and demand zone indicators are rich in features with many powerful features to help you to trade the right supply and demand zone to trading. Also note that supply demand zone indicator can be used as a great support and resistance indicator too. So if you are looking for good support resistance indicator, then these tools are good too. Please check it out.
Mean Reversion Supply Demand MT5
Mean Reversion Supply Demand indicator is our earliest supply demand zone indicator and loved by many trader all over the world. It is great to trade with reversal and breakout. You can also fully setup your trading with stop loss and take profit target.
Below are the links to MT5 version of the Mean Reversion Supply Demand indicator.
https://www.mql5.com/en/market/product/16823
https://algotrading-investment.com/portfolio-item/mean-reversion-supply-demand
Ace Supply Demand Zone Indicator MT5
Ace Supply Demand Zone indicator is our next generation supply demand zone indicator. It was built in non repainting and non lagging algorithm. On top of many powerful features, you can also make use of archived supply and demand zone in your trading to find more accurate trading opportunity.
Below are the links to MT5 version of the Ace Supply Demand Zone indicator.
https://www.mql5.com/en/market/product/40075
https://algotrading-investment.com/portfolio-item/ace-supply-demand-zone
In addition, we provide the YouTube video for Ace Supply Demand Zone Indicator. In terms of indicator operation, both mean reversion supply demand and ace supply demand zone indicator are similar. Hence, you can watch this YouTube Video to accomplish the supply demand zone indicator.
YouTube “Supply Demand Zone Indicator”: https://youtu.be/lr0dthrU9jo
For your information, both indicators provides many powerful features to complete for your trading. You can also use this indicators together with Harmonic pattern and Elliott wave pattern indicators.

Young Ho Seo
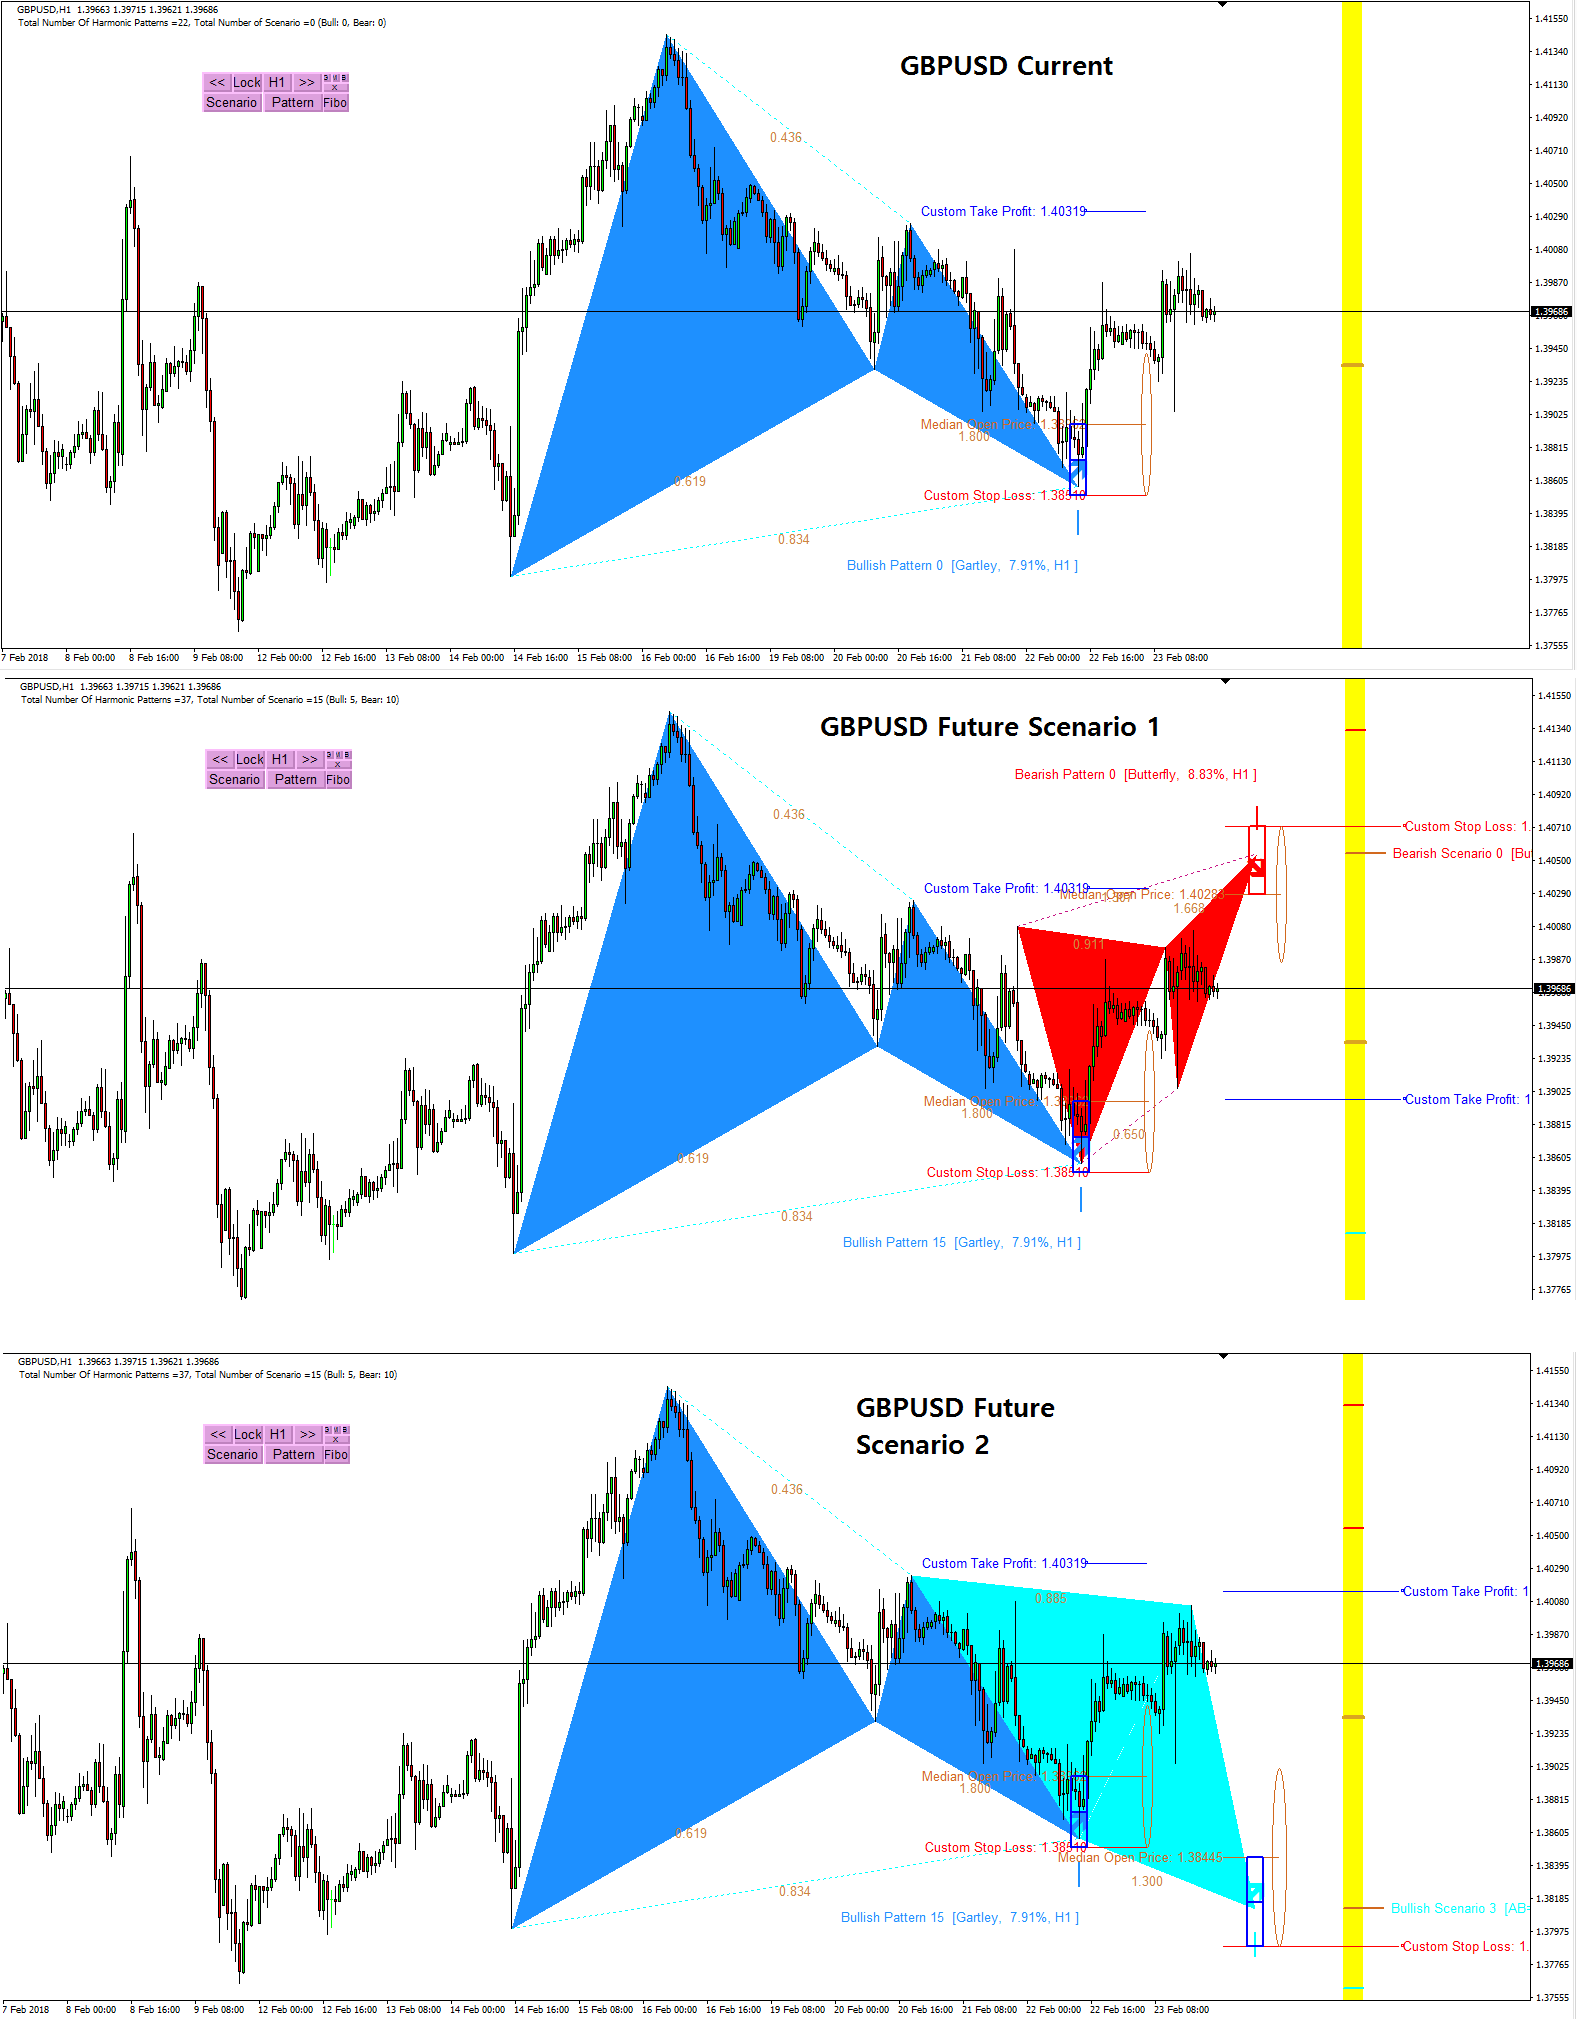
Scan and search future harmonic patterns with Harmonic Pattern Scenario Planner
Harmonic Pattern Scenario Planner is a tool you can scan and search future harmonic patterns in just one button click. It would detect any potential future harmonic patterns in your search range using the algorithm like Monte Carlo simulation. You can even get the potential take profit and stop loss of the future patterns even before they form. What is even more, you can use all the features and functionality of harmonic pattern plus from your harmonic pattern scenario planner too.
Have watched this interesting movie called “Next” ? Check out the guy can see the few minutes into the futures. How powerful the 2 minutes vision for future is. Predicting future is very tactical game but it is hard because future keep changing based on the presents. However, it is definitely an interesting game. As a trader, you can gain a lot of advantage over other traders by predicting futures.
http://www.imdb.com/title/tt0435705/
This movie like predicting concept was equipped in our Harmonic Pattern Scenario Planner. check the power of predictive harmonic pattern for your trading. We are only one selling this future predictive harmonic pattern scanner in the universe.
https://algotrading-investment.com/portfolio-item/harmonic-pattern-scenario-planner/
https://www.mql5.com/en/market/product/6101
https://www.mql5.com/en/market/product/6240

Young Ho Seo
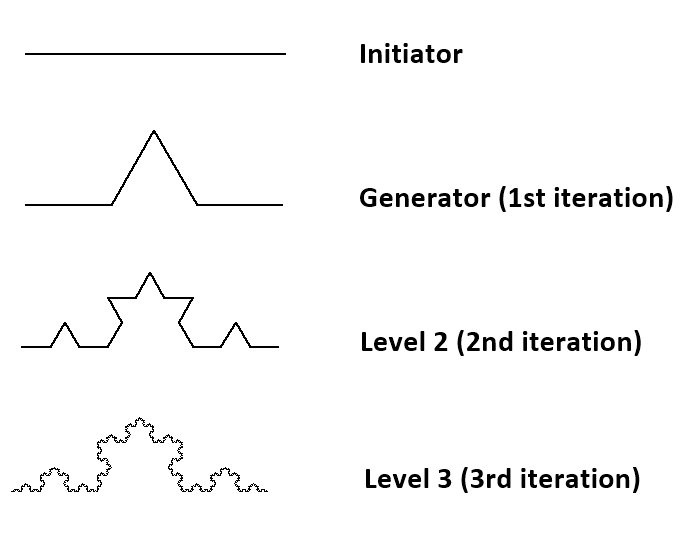
Fractal-Wave Process
Figure 8-1: Fractal-Wave process is corresponding to price pattern (1, 5) in the table.
Fractal-Wave process is the representation of the Fractal geometry in the time dimension. Fractal geometry is made from a repeating pattern at many different scales. Simply speaking it is repeating patterns with varying size. Fractal geometry can be a self-similar pattern with the strictly same patterns across at every scale. Or if the pattern loosely matches to the past one, this can be still considered as fractal geometry. We call this as near self-similarity against the strict self-similarity. Many examples of Fractal geometry can be found in nature. Snowflakes, coastlines, Trees are the typical example of the Fractals geometry in space. Fractal-Wave is the fractal geometry generated in time dimension. Just like Fractal Geometry can be described by self-similar patterns. Fractal-Wave can be described by self-similar patterns repeating in time. The concept of Fractal-Wave can be illustrated well by Weierstrass function.
Loosely speaking, Weierstrass function is the cyclic function generated from infinite number of Cosine functions with different amplitude and wavelength. By combining infinite number of Cosine functions, it can generate a complex structure repeating self-similar patterns in different scales. This is a typical synthetic example of Fractal-Wave patterns with strict self-similar patterns. We present this function to help you to understand the properties of the self-similar process. The real world financial market shows the loose fractal geometry. They do not repeat in the identical patterns in shape and in size. The repeating patterns are similar to each other up to certain degree. Since Weierstrss function is the synthetic example for the strict fractal geometry, reader should note that Weierstrss function does not represent the real world financial market.
Figure 8-2: Weierstrass function to give you a feel for the Fractal-Wave process. Note that this is synthetic Fractal-Wave process only and this function does not represent many of real world cases.
In the real world application, Fractal-Wave process appears with the near self-similar patterns most of time. Therefore, detecting them is not easy. The Heart Beat Rate signal is one typical example of the Fractal-Wave process in nature (Figure 8-3 and Figure 8-4). If we zoom in on a subset of time series, we can see the apparent self-similar patterns. In Financial Market, Fractal-Wave process occurs frequently but the market typically shows the near self-similarity too. In terms of pattern shape, the financial market and Heart beat rate signal are different because their underlying pattern generating dynamics inside human organ and crowd behaviour are substantially different.
Figure 8-3: Self-similar process in Heart Beat rate (Goldberger et al, 2000).
Figure 8-4: Continuous Heart Beat time series.
Figure 8-5: Self-similar geometry in EURUSD daily series.
Fractal-Wave process is the basis for many popular trading strategies like Elliott Wave, Harmonic patterns, triangle and wedge patterns. However, these trading strategies were not well connected to existing science in the past. This was one of the important motivation for myself to step up to write and to connect these trading strategies into existing science. Most of time, day traders were referencing that these strategies will work because market repeats themselves. For me, this explanation would be not enough before I make the full time commitment on them.
Therefore, I had to do a lot of research to find the origin of these trading strategies and to see real value behind them. From my research, most likely, the repeating patterns in these strategies come from Fractal-Wave. I was very happy initially until I found that there is big difference between the underlying concepts of these trading strategies and Fractal-wave itself.
To see the difference, you might compare the heart beat signal and EURUSD price series in Figure 8-4 and Figure 8-5. You could also compare the heartbeat signal and S&P 500 series in Figure 8-6. With heart beat signal in Figure 8-4, you might think that it would look similar to Stock or Forex market data but different in some ways. If you felt this way, you are very correct. Here is the main difference.
Heartbeat signal seems to have fixed mean or horizontal patterns as we described in Stationary process in Chapter 5. However, EURUSD price series or S&P 500 series do not show any noticeable horizontal patterns. With human, the heartbeat increases dramatically to get more blood out during intensive activity like sprinting, but they must come back to normal range to maintain our life. Naturally, this makes up the horizontal patterns as we described in Stationary process. On the other hands, the operational range of the financial market does not have to create the horizontal patterns as if heartbeat does. Firstly, financial market is designed to grow or decline with time (Figure 8-6). Secondly, the underlying fundamental drives the rise and fall of the financial market (Figure 8-6) towards unknown destination.
With human, we know that our heartbeat rate must be kept between 60 and 100 times per minute. While you are a living man, this normal range is the destination of your heartbeat rate most of time. It is very predictable that your heartbeat will come back to 80 times per minute once it hits 130 times per minute. In the financial market, the final destination is not known and open. Even if S&P500 hits 3000 points tomorrow, we are not sure if it would even come back to 1000 points next year or ever. Hence, we are talking about similar but very different type of Fractal-Wave. Fractal wave alone can not explain the difference between these two. In the past, many day traders were having misleading picture between fractal wave and these trading strategies because no one or no literature attempted to give clear or easy explanation on them. This was another motivation for me to write this book too.
The open and unknown destination of the financial market is there because the underlying fundamental drives the market towards the price level, at which majority of people think it is most reasonable. In another words, market will move towards the equilibrium price. We have covered this in Equilibrium process in Chapter 8. Financial market is not only made up from Fractal-Wave but with Equilibrium process too. Hence, this is why financial market is different from heartbeat series although both have fractal wave in them. We have just pinned down the important concept of Equilibrium Fractal Wave process. In next two chapters, we will take you to the details of Equilibrium Wave process and Equilibrium Fractal Wave process to give you the complete and systematic view of the trading strategy and financial market.
Figure 8-6: S&P 500 growth last 70 years.
Analytical Note
In the Fractal Geometry, two important quantifiable properties are fractal dimension and self-similarity. Fractal dimension is a measure of how much an N dimensional space is occupied by an object. For example, a straight line have dimension of 1 but a wiggly line has a dimension between 1 and 2. More precisely, their Fractal Dimension can be expressed as Log (N)/Log (r) where N = number of self-similar pieces and r = linear scale factor. Now to illustrate the concept, we will present the four cases from dimension 1 to 2. If we reduce size of straight line by linear scale factor r = 2, then then we get two self-similar piece, N = 2. Therefore, the dimension of the straight line is 1.
Figure 8-7: Iteration of self-similar process for straight line (Dimension = 1).
Likewise, if we remove the middle third of the straight line and replace it with two lines with the same length, then we get the first iteration of the Koch Curve. In this example, for the linear scale factor r = 3, we get the four self-similar pieces. Therefore, the dimension of Koch Curve is 1.26816 = Log (4) / Log (3).
Figure 8-8: Iteration of self-similar process for Koch Curve (Dimension = 1.26816).
Sierpinski Triangle is another good example of Fractal Geometry. If we connect the mid points of the three side inside an equilateral triangle, then we get 3 equilateral triangles inside the first equilateral triangle. Note that we do not count the resulting upside down triangle as a self-similar piece. In this case, the linear scale factor r is 2 since generated triangle have the half of the width and height. The Fractal dimension D = 1.585 = Log (3)/ Log (2).
Figure 8-9: Iteration of self-similar process for Sierpinski Triangle (Dimension = 1.585).
About this Article
This article is the part taken from the draft version of the Book: Scientific Guide to Price Action and Pattern Trading (Wisdom of Trend, Cycle, and Fractal Wave). Full version of the book can be found from the link below:
https://algotrading-investment.com/portfolio-item/scientific-guide-to-price-action-and-pattern-trading/
Advanced Price Pattern Scanner uses highly sophisticated pattern detection algorithm. However, we have designed it in the easy to use and intuitive manner. Advanced Price Pattern Scanner will show all the patterns in your chart in the most efficient format for your trading. It is non repainting pattern detector. Below are the links to Advanced Price Pattern Scanner.
https://algotrading-investment.com/portfolio-item/advanced-price-pattern-scanner/
https://www.mql5.com/en/market/product/24679
https://www.mql5.com/en/market/product/24678
Below is the landing page for Optimum Chart (Standalone Charting and Analytical Platform).
https://algotrading-investment.com/2019/07/23/optimum-chart/

Young Ho Seo
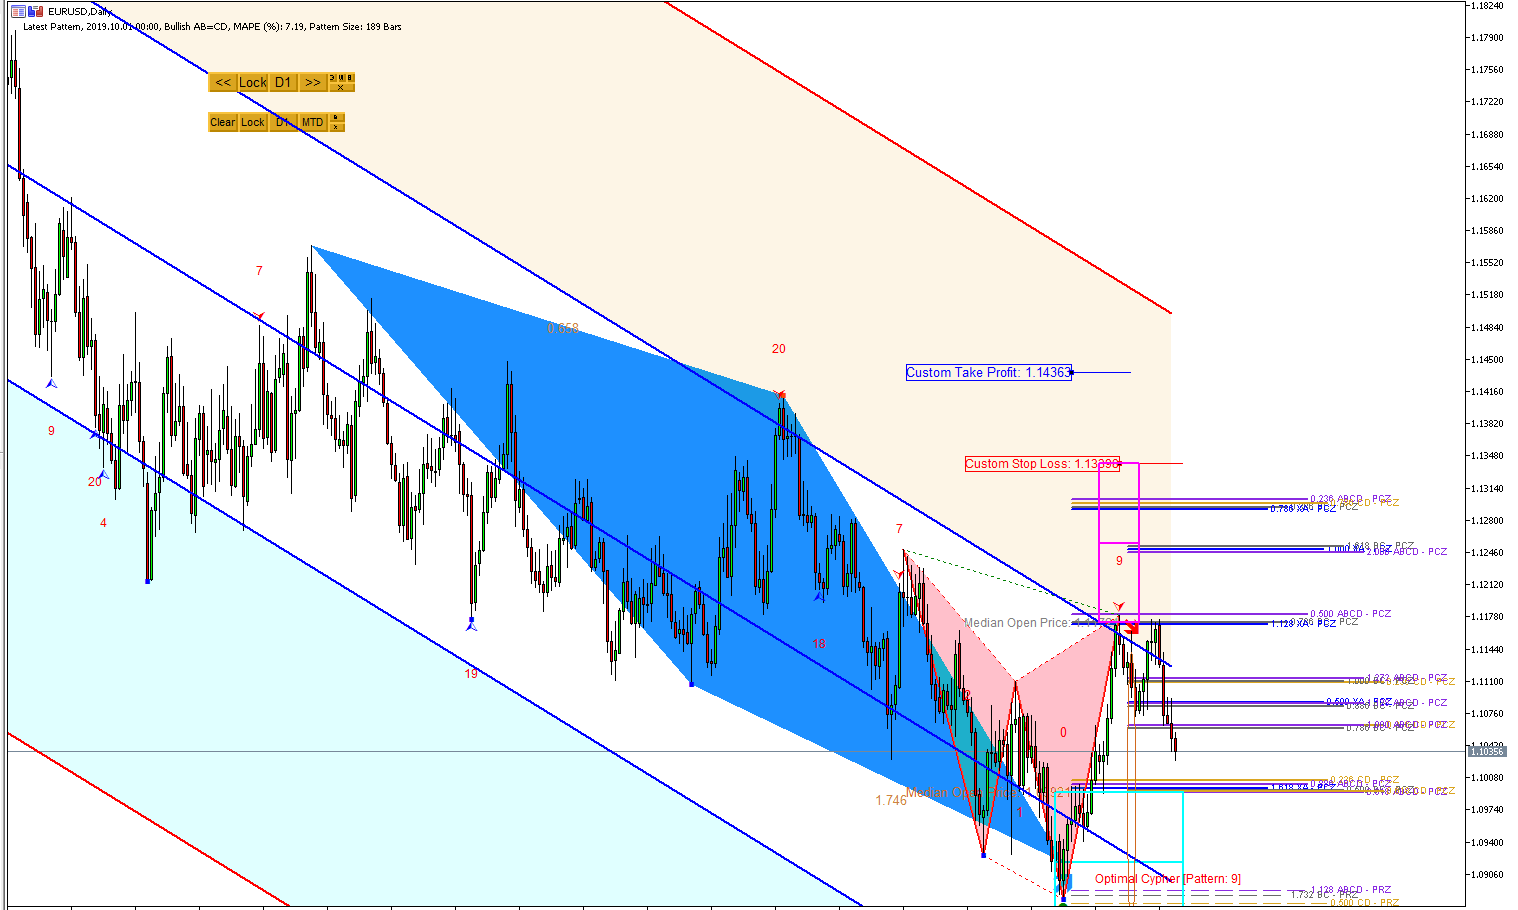
Using Harmonic Pattern Plus and X3 Chart Pattern Scanner Together
Harmonic Pattern Plus and X3 Chart Pattern Scanner are the great harmonic pattern detection indicator. Some trader asked me if they can use Harmonic Pattern Plus and X3 Chart Pattern Scanner together.
The short answer is yes. It is possible to combine them. Even though both indicators detect harmonic patterns, they are using completely different pattern detection algorithm. Harmonic pattern Plus uses the classic pattern detection algorithm whereas X3 Chart Pattern Scanner uses non repainting pattern detection algorithm (i.e. latest pattern detection technology).
There can be some overlapping in the detected patterns. However, many patterns can be detected in different timing. If both indicator detect the same patterns, then the patterns are often more accurate. At the same time, with non overlapping patterns, you have less chance to miss out the good signals.
When you want to use the channel function together with Harmonic Pattern, then use the channel function in X3 Chart Pattern Scanner because it is more advanced version. Of course, the same logic applies to Harmonic Pattern Scenario planner.
In addition, you can watch the YouTube Video to feel what is the automated harmonic pattern indicator like. For your information, we provides two YouTube videos with title and links below.
YouTube “Harmonic Pattern Indicator (Repainting but non lagging)”: https://youtu.be/CzYUwk5qeCk
YouTube “Non Repainting Non Lagging Harmonic Pattern Indicator”: https://youtu.be/uMlmMquefGQ
Link to Harmonic Pattern Plus
https://www.mql5.com/en/market/product/4488
https://www.mql5.com/en/market/product/4475
https://algotrading-investment.com/portfolio-item/harmonic-pattern-plus/
Link to X3 Chart Pattern Scanner
https://www.mql5.com/en/market/product/41993
https://www.mql5.com/en/market/product/41992
https://algotrading-investment.com/portfolio-item/profitable-pattern-scanner/

Young Ho Seo
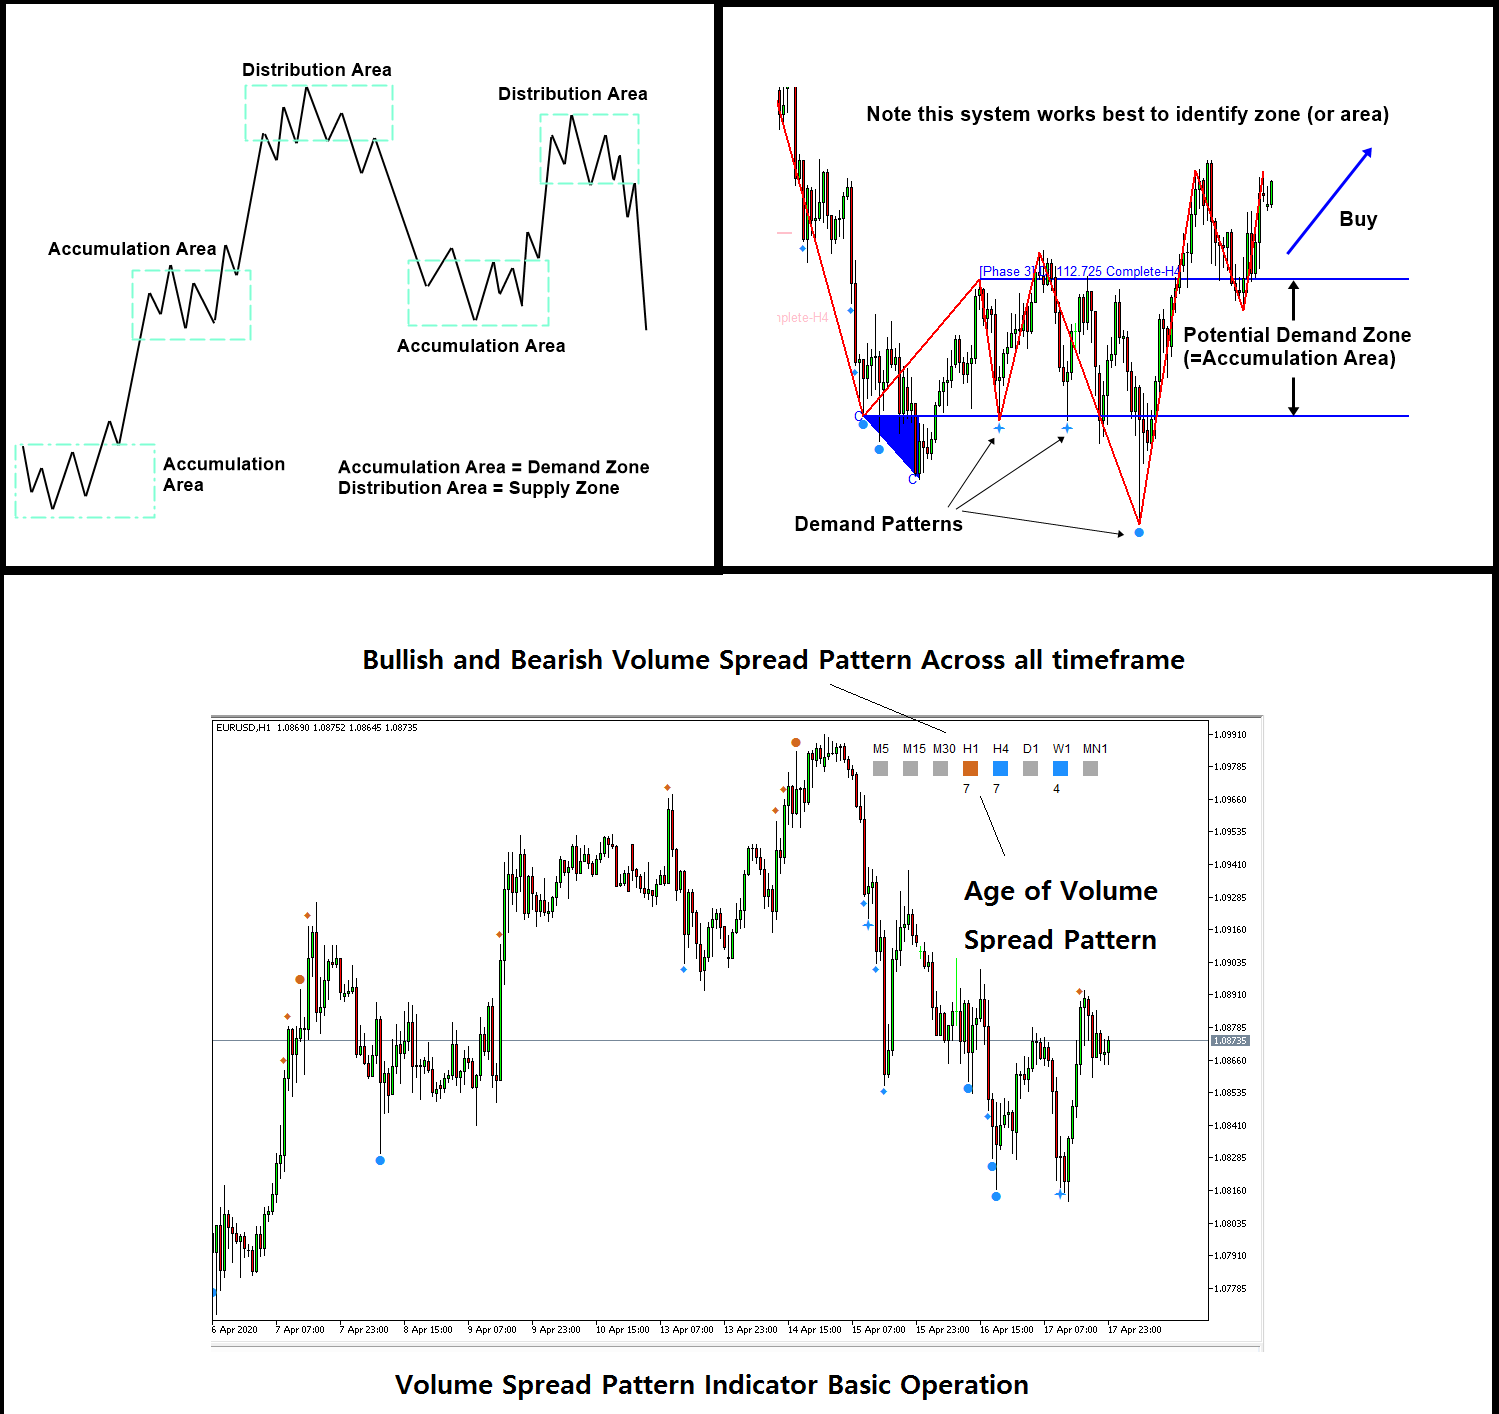
Volume Spread Analysis Indicator List
We provide three different Volume Spread Analysis indicators and volume based tools. Our volume spread analysis tools are the hybrid of volume spread analysis and signal processing theory.
These tools will help you to complete your trading decision with high precision. As long as you understand the concept of the Accumulation and Distribution area in the volume spread analysis, these tools will help you to predict the presence of Accumulation and Distribution area. Hence, you can predict the best trading opportunity.
Firstly, Volume Spread Pattern Indicator is the powerful volume spread analysis indicator that operated across multiple timeframe. Volume Spread Pattern Indicator will not only provide the bearish and bullish volume spread pattern in the current time frame but also it will detect the same patterns across all timeframe. You just need to open one chart and you will be notified bullish and bearish patterns in all timeframe in real time.
Here is the link to Volume Spread Pattern Indicator.
https://www.mql5.com/en/market/product/32961
https://www.mql5.com/en/market/product/32960
https://algotrading-investment.com/portfolio-item/volume-spread-pattern-indicator/
Secondly, Volume Spread Pattern Detector is the light version of Volume Spread Pattern Indicator above. This is free tool with some limited features. However, Volume Spread Pattern Detector is used by thousands of traders. Especially, it works great with the support and resistance to confirm the turning point. This is free tool. Just grab one.
https://www.mql5.com/en/market/product/28438
https://www.mql5.com/en/market/product/28439
https://algotrading-investment.com/portfolio-item/volume-spread-pattern-detector/
Both Volume Spread Pattern Indicator and Volume Spread Pattern Detector works well with Excessive Momentum indicator as Excessive Momentum indicator helps to detect the potential Accumulation and Distribution area automatically. Hence, if you are using Excessive Momentum Indicator, then you can use one between Volume Spread Pattern Indicator or Volume Spread Pattern Detector. In addition, we provide the YouTube video to accomplish the basic operations of Excessive Momentum Indicator.
YouTube Video (Excessive Momentum Indicator): https://youtu.be/oztARcXsAVA
YouTube Video (Excessive Momentum Indicator Explained): https://youtu.be/A4JcTcakOKw
Here is link to Excessive Momentum Indicator for MetaTrader 4 and MetaTrader 5.
https://algotrading-investment.com/portfolio-item/excessive-momentum-indicator/
https://www.mql5.com/en/market/product/30641
https://www.mql5.com/en/market/product/30621
Thirdly, we provide the volume Zone Oscillator. This is another useful free tool that utilizes the volume information for your trading. You can use these tools for volume spread analysis, Harmonic Pattern, Elliott Wave Pattern, X3 Price Pattern further. This is free tool. Just grab one.
https://algotrading-investment.com/portfolio-item/volume-zone-oscillator/

Young Ho Seo
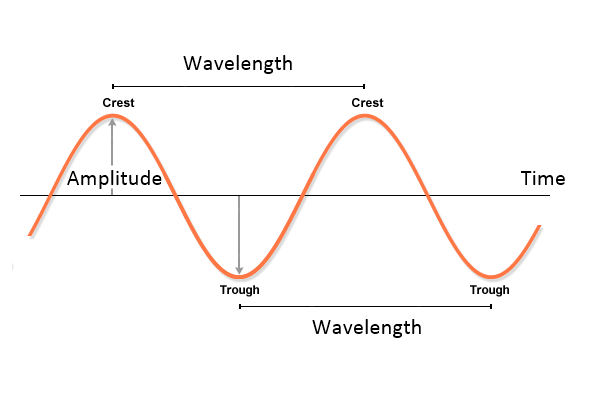
Wave Process (Cycle)
Figure 7-1: Wave process is corresponding to price pattern (1, 2), (1, 3) and (1, 4) in the table.
Wave process is any cyclic patterns repeating in the fixed time interval. Two main references for Wave process can be found from Physics and Time series Analysis. Both references deal exclusively with periodic cycle of an object or a signal. However, they use different methodology to describe the periodic cycle. In physics, wave is the main term describing the periodic cycle of an object or a signal. In time series analysis, the term “Seasonality” is used to deal with seasonal fluctuations in the price series. In the Price Pattern Table (Figure 7-1), Wave Process covers both wave in Physics and seasonality in time series analysis. To better illustrate the Wave process, we provide simple description for Wave and Seasonality in this section.
In Physics, Wave can be described by three independent variables, which are frequency, wavelength and amplitude. Frequency is the number of waves passing a point in certain time interval. Scientists and engineers normally use a time of one second. Therefore, number of waves passing a point in 1 second is described by the unit called Hertz. 1 Hertz equals to one Wave per second. Wavelength is the distance from any point on one wave to the same point on the next wave along. Amplitude is the height of wave from the top of a crest to the centre line of the wave.
Figure 7-2: Description of Wave in Physics.
Normally textbook will show you a clean sine or cosine wave function to describe the property of wave. In the real world, the wave often consists of multiple cyclic components. For example, Figure 7-3 shows the synthetic multiple cycles built by adding three Sine Wave Functions: Sine (2x) + Sine (13x) + Sine (30x). Many real world signals can have more complex cyclic structure than this example. In addition, many real world signal will exhibit decreasing or increasing amplitude to make your analysis more difficult as shown in Figure 7-4.
Figure 7-3: Synthetic Cyclic Function of Sine (2x) + Sine (13x) + Sine (30x).
Figure 7-4: Synthetic Cyclic Function with increasing amplitude.
In time series analysis, seasonal fluctuation is described with smoothing factor gamma and previous seasonal level. Alternatively, one can use multiple regression with dummy variable or artificial intelligence techniques for the same task. Figure 7-5 shows typical annual seasonal fluctuations in the data. This type of series can be modelling using either additive seasonality or multiplicative seasonality.
Figure 7-5: Annual Seasonal fluctuations in the price series.
The ways to describe periodic wave in physics and in time series analysis are different. However, in fact, two concepts are still the very same thing. The main difference of the seasonality from the periodic wave in Physics is that seasonality are normally assumed to have some common seasonal period in calendar like hourly, daily, monthly or quarterly. Although modelling methodology might differ, the seasonality can be detected with Fourier Transformation and periodogram equally well. One disadvantage of seasonality in time series is that the math become quite complex if we have to model multiple seasonality. For example, if we have more than three distinctive seasonal fluctuations in our data, say hourly daily, weekly and monthly, then it is quite difficult to model using seasonal exponential smoothing model. At the same time, multiple periodic cycles present in price series can be modelled readily with combination of sine and cosine curve with various amplitude and wavelength.
It is very difficult to observe any strong seasonality in Forex market data. It is probably because the currency markets are traded all years around with high trading volume. However, some weak form of seasonality might be observed from Stock market and commodity market. If any price series shows wave process (cycle), then it is important to define seasonal period, the time interval repeating its cycle. With the identified seasonal period, one can determine period where price stays below or above the seasonal average for your trading advantage. For example, in Figure 7-6, we can observe some bullish effect on April and December on S&P500 monthly data. It is rare for forex trader. However, there are still many group of traders looking for seasonality in Stock market.
Figure 7-6: Seasonal Effects of the S&P 500 monthly price series. Seasonality was extracted from the central moving average construction.
About this Article
This article is the part taken from the draft version of the Book: Scientific Guide to Price Action and Pattern Trading (Wisdom of Trend, Cycle, and Fractal Wave). Full version of the book can be found from the link below:
https://algotrading-investment.com/portfolio-item/scientific-guide-to-price-action-and-pattern-trading/
Fractal Pattern Scanner provides the way to measure the fractal cycles in forex and stock market data. In addition, the turning Point Probability and trend Probability can be measured with Fractal Pattern Scanner at every price action in your chart. For the simplest usage, Fractal Pattern Scanner can turn the simple support and resistance to the powerful killer strategy. Below is the landing page to Fractal Pattern Scanner in MetaTrader 4 and MetaTrader 5.
https://www.mql5.com/en/market/product/49170
https://www.mql5.com/en/market/product/49169
https://algotrading-investment.com/portfolio-item/fractal-pattern-scanner/
Below is the landing page for Optimum Chart (Standalone Charting and Analytical Platform).
https://algotrading-investment.com/2019/07/23/optimum-chart/

Young Ho Seo
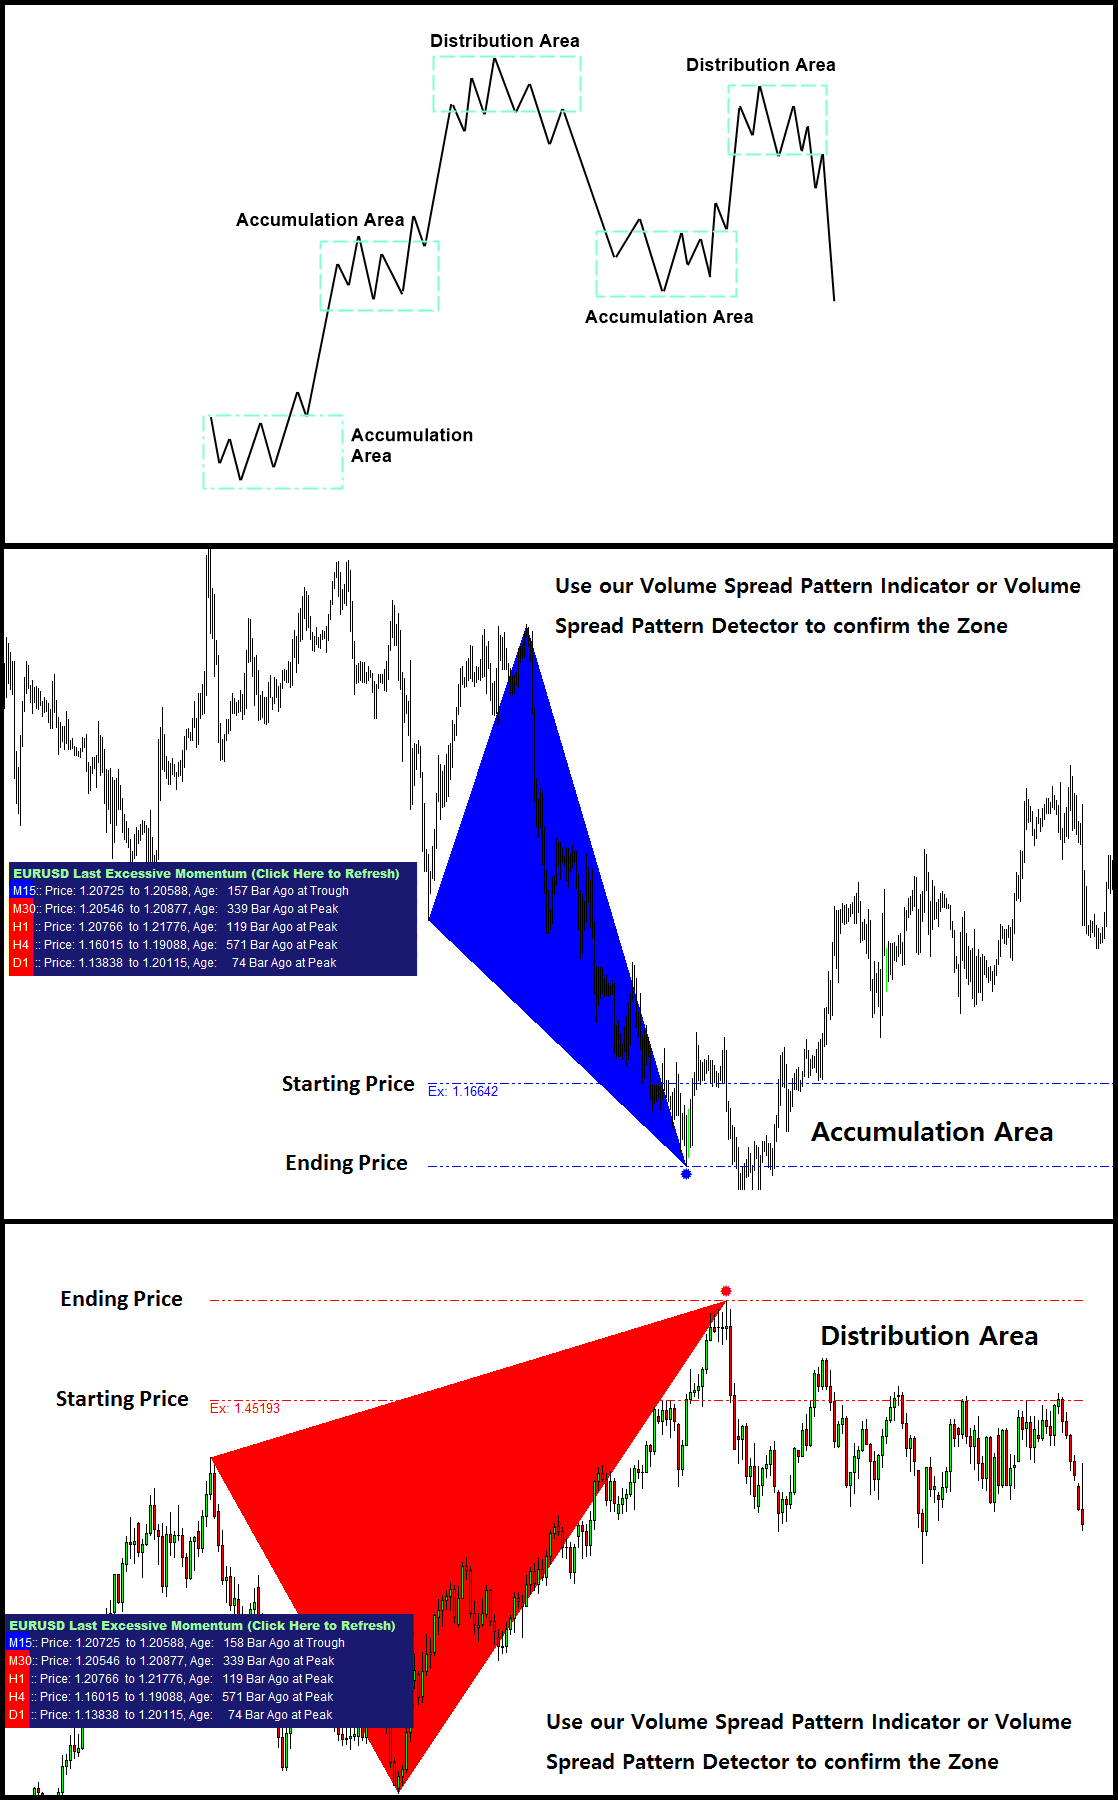
Excessive Momentum Indicator and Trading Operation
Excessive Momentum Indicator automatically detects the broken balance between supply and demand in the financial market. Detection of this broken balance provides the great market timing for the entry and exit for our trading. In this short article, we explain some of the controllable inputs in the Excessive Momentum Indicator.
There are the four main inputs, controlling the calculation process of Excessive Momentum Indicator. They are:
* Bars To Scan: amount of candle bars to calculate the indicator. Choose bigger numbers if you want to see the calculation over longer historical period.
* Momentum Strength Factor: Momentum Strength is the strength of Excessive Momentum to detect. It can stay between 0.1 and 0.5. In theory, it can go up to 1.0. However, you will not get many signals to trade. The default setting is 0.1. You can try various Momentum Strength Factor to optimize your trading performance if you wish.
* Equilibrium Fractal Wave Scale: This input controls the size of Fractal Wave when we detect the excessive momentum. If you put bigger number, then you get less signals to trade. The default setting is 0.5.
* Detrending Period: This input controls the statistical calculation in the algorithm. It should stay between 20 and 50.
Above four inputs are important because they can affect the number and quality of trading signals. You can use the default setting most of time. However, it is also possible that you can try different inputs and check how they perform in the historical data. Rest of inputs are probably self-explanatory from their name.
Now, let us cover the trading signals. In the Excessive Momentum indicator, you get two signal alerts. Firstly, you will get alert when the Excessive Momentum is starting in the market. In this case, it will notify you the starting price. At this stage, the excessive momentum is not completely expanded yet.
Secondly, you will get alert when the Excessive Momentum is completed in the market. At this stage, you will be notified both starting price and ending price of Excessive Momentum.
Both starting price and ending price of Excessive Momentum form the Excessive Momentum Zone. At which signal you want to trade is up to your choice. You can use the zone as the breakout trading when the zone is narrow. When the zone is sufficiently large, it might be possible to aim some reversal trading opportunity too.
At the same time, this Excessive Momentum Zone can be considered as either Accumulation or Distribution area in the Volume Spread Analysis. You can further find the symptoms of accumulation and distribution area using our Volume Spread Pattern Indicator (Paid and Advanced version) or Volume Spread Pattern Detector (Free and Light version).
YouTube Video 1: https://youtu.be/oztARcXsAVA
YouTube Video 2: https://youtu.be/A4JcTcakOKw
=============================================
Below is the landing page for Excessive Momentum Indicator.
https://algotrading-investment.com/portfolio-item/excessive-momentum-indicator/
https://www.mql5.com/en/market/product/30641
https://www.mql5.com/en/market/product/30621
Here is the link to Volume Spread Pattern Indicator (Paid and Advanced Version).
https://www.mql5.com/en/market/product/32961
https://www.mql5.com/en/market/product/32960
https://algotrading-investment.com/portfolio-item/volume-spread-pattern-indicator/
Here is the link to Volume Spread Pattern Detector (Free and Light Version).
https://www.mql5.com/en/market/product/28438
https://www.mql5.com/en/market/product/28439
https://algotrading-investment.com/portfolio-item/volume-spread-pattern-detector/

Young Ho Seo
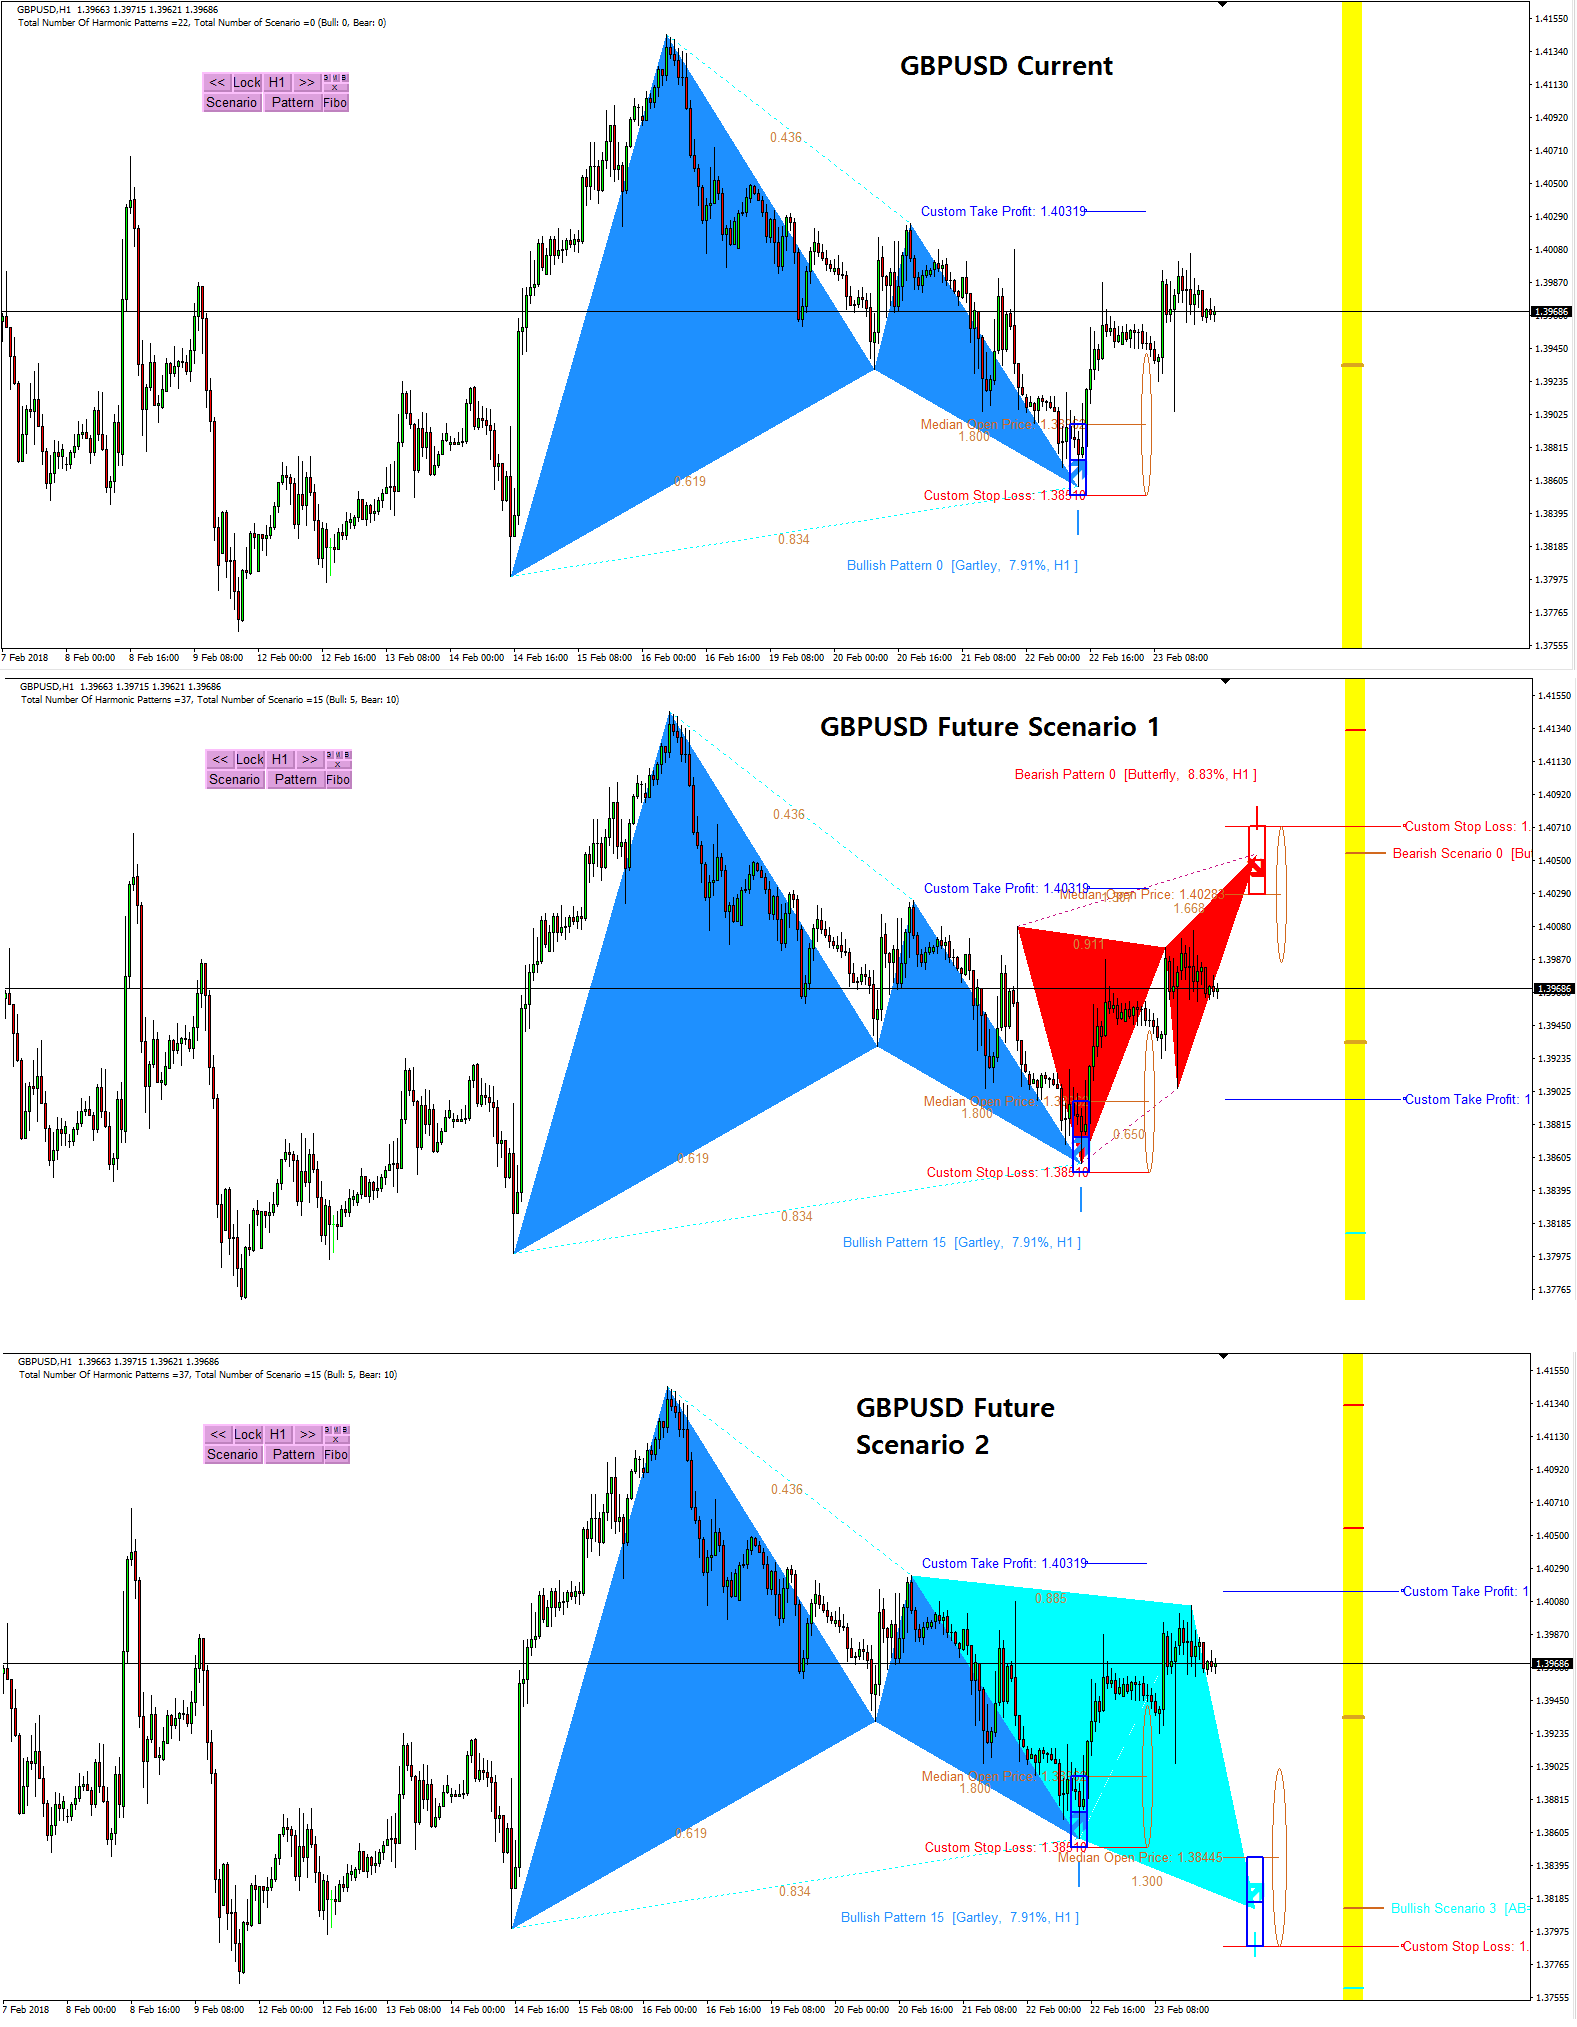
Advanced Harmonic Pattern Detection Indicator for MetaTrader 5
Harmonic Pattern Scenario Planner is an advanced Harmonic Pattern Detection Indicator. This is probably the most sophisticated harmonic pattern detection indicator for MetaTrader 5 platform.
Harmonic Pattern Scenario planner can be used like Harmonic Pattern Plus. Hence, it is easy and friendly to use. At the same time, it combines powerful Monte Carlos Simulation to provide you advanced harmonic pattern search capability.
Monte Carlo Simulation can help you to find future reversal points in advance.
In addition, you can watch the YouTube Video to feel what is the automated harmonic pattern indicator like. For your information, we provides two YouTube videos with title and links below.
YouTube “Harmonic Pattern Indicator”: https://youtu.be/CzYUwk5qeCk
YouTube “Non Repainting Non Lagging Harmonic Pattern Indicator”: https://youtu.be/uMlmMquefGQ
Here is the product link to Harmonic Pattern Scenario Planner for MetaTrader 5. You can find more about the features of this advanced Harmonic Pattern Scenario Planner.
https://www.mql5.com/en/market/product/6101
https://algotrading-investment.com/portfolio-item/harmonic-pattern-scenario-planner/

Young Ho Seo
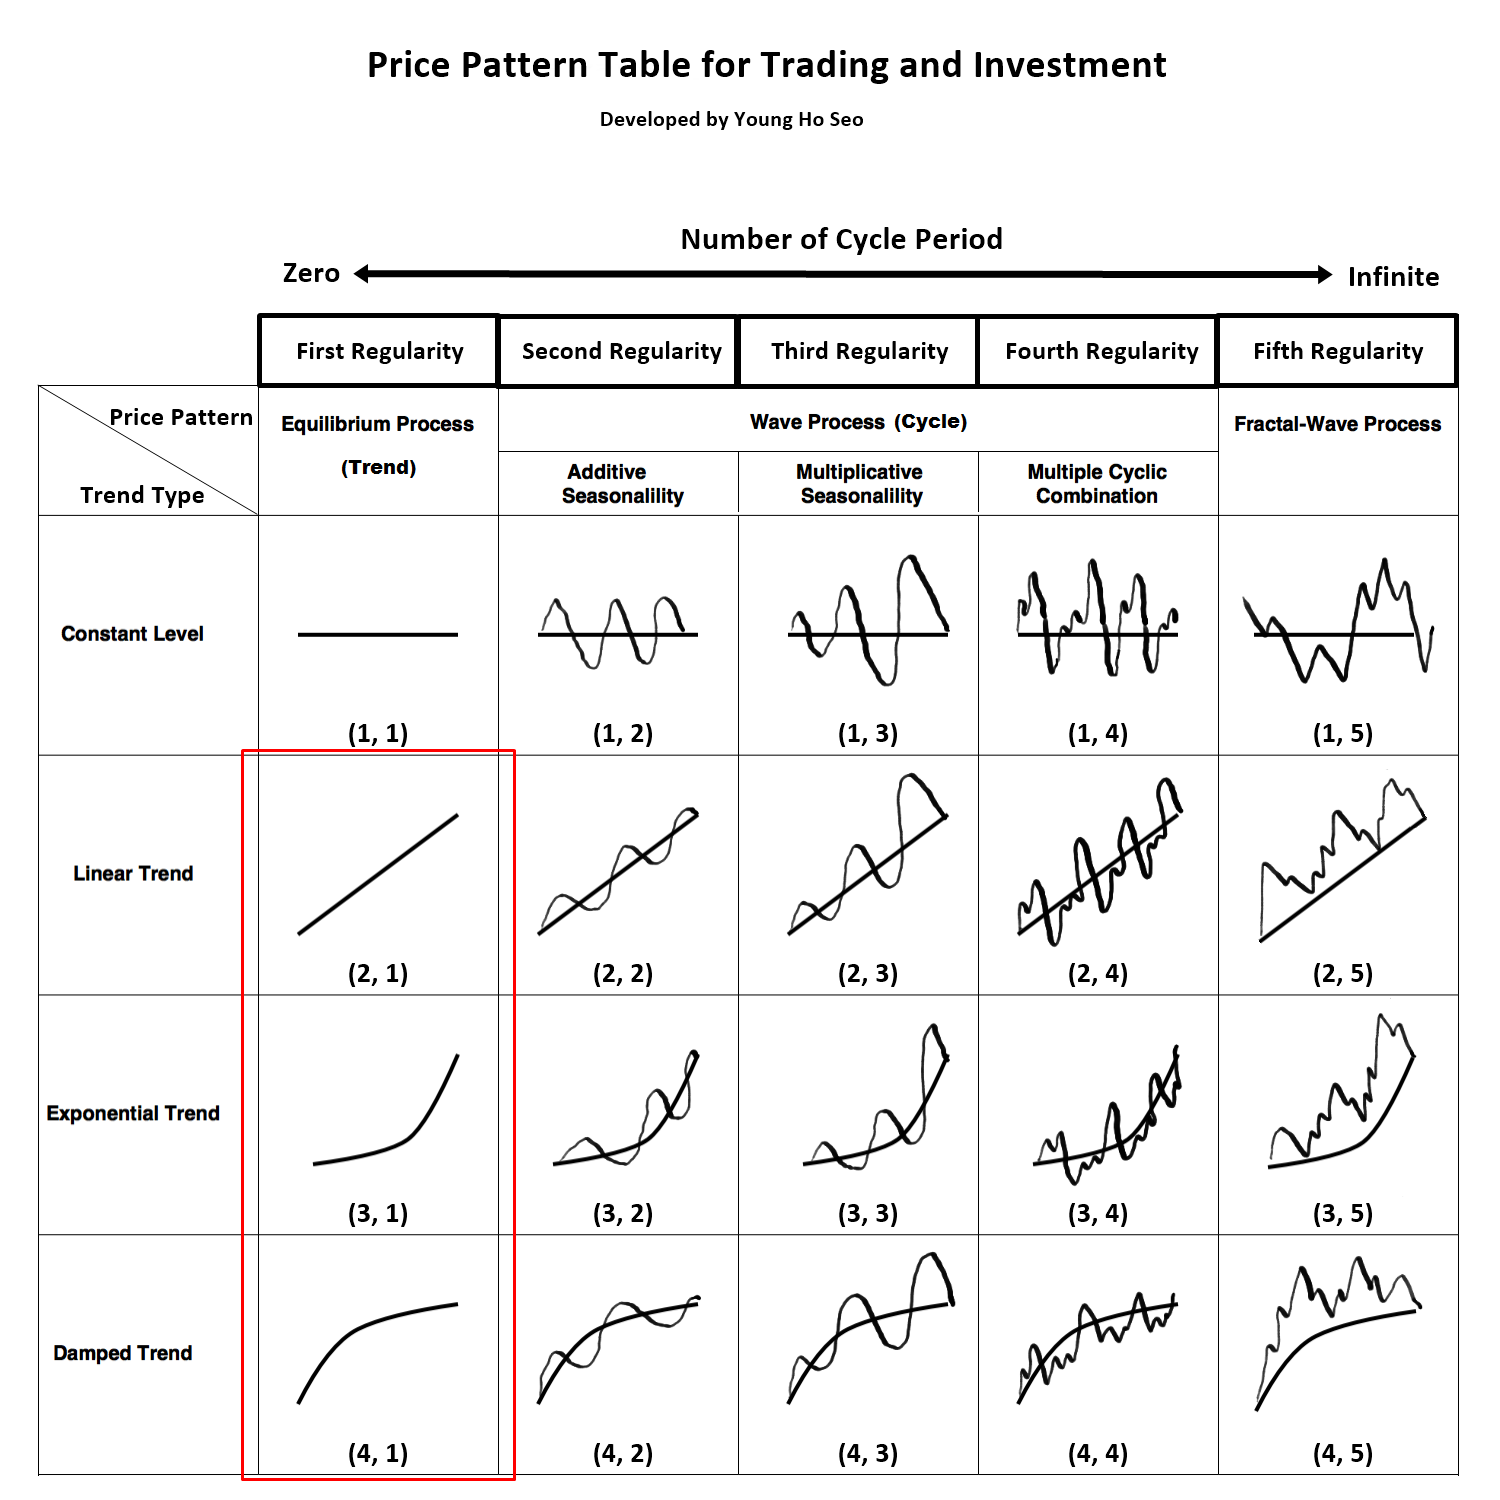
Equilibrium Process (Trend)
Figure 6-1: Equilibrium process is corresponding to price pattern (2, 1), (3, 1) and (4, 1) in the table.
Simply speaking, Equilibrium process is conceptually similar to trend. It is the market force moving the price series in one direction. Equilibrium process is not different from the equilibrium concept found in the classic supply-demand economic theory. Literally, it is the force to move price to release the unbalance between supply and demand. There are many types of Equilibrium process (trend). They might be linear trend like Pattern (2, 1) in Figure 6-2 or they might be nonlinear trend like Pattern (3, 1) and (4, 1) in Figure 6-2. The three trend patterns, that are linear, exponential and damped, are common. Exponential trend (3, 1) represents the strong trend with increasing momentum. Damped trend (4, 1) represents the trend with reducing momentum. Figure 6-2 presents the six trend patterns for both bullish and bearish markets. These six trend patterns are found most frequently in the financial market comparing to other trend patterns.
Figure 6-2: Trend Patterns for bullish and bearish market.
Equilibrium process is highly related to market fundamentals. Equilibrium process is the direct representation of the supply demand balance in the financial market. Assuming there is the fixed number of shares for Google, if more people want to buy a stock than sell it, then the share price for Google will move up. We call this as a bullish trend. Likewise, if more people want to sell a stock than buy it, there would be greater supply than demand and the price would fall. We call this as a bearish trend. When there is the imbalance in supply and demand force, then the price will try to move towards equilibrium to release the imbalance. The supply demand imbalance is often caused by the fundamental change in the market. For example, change in the taxation or interest rate can change the quantity of supply and demand force dramatically. Natural disasters like Earthquake or Hurricanes or other serious transmissible diseases can influence the dynamics of supply demand too in the financial markets. War, terror, or other political corruption can reduce the demand of the financial assets affected by them.
Figure 6-3: Economic Supply Demand curve.
If the Equilibrium process (trend) is overwhelmingly dominating in the price series, prediction is easier. However, the strength of Equilibrium process differs for different financial price series. It is also not easy to quantify or to isolate the portion of Equilibrium process from rest of regularities perfectly. In reality, Equilibrium process can be caused by multiple information sources introduced in different time (Figure 6-4). Each information source will be diffusing across the market in time. Some of them are slowly and some of them are quickly. Some information source will introduce bullish Equilibrium process, which increase demand and reduce supply. Some other information source will introduce bearish Equilibrium process, which reduce demand and increase supply. Since each trader and investor will react differently to different information sources, the diffusion process of each information source can vary dramatically. Modelling or visualization of diffusion process of multiple information sources is complex. If there are many bullish and bearish Equilibrium process acts together in the price series, the simplest way of guessing the market direction is calculating the net of bullish and bearish equilibrium process in the market. However, with simple netting, you will still miss the time factor because each information source will be diffused in different speed. Another difficulty comes from quantifying bullish and bearish strength of each source. Typically, to quantify them correctly, we need good amount of historical data. Especially if you need the accuracy for trading quality, you will need much more data than just doing some academic research. To most of average trader, this is not accessible.
Figure 6-4: EURUSD candlestick chart with various Fundamental Data Release.
Therefore, trader uses technical indicator because technical indicator is simple alternative to the complex diffusion process modelling. Moving average type of technical indicators can work well for this type of market because they eliminate randomness and leave the trend pattern in the price series. Simple moving average, exponential moving average and zero lag moving average can be the great help for this type of market. Normally the strong Equilibrium process can be captured with typical momentum trading strategy. For example, all moving average cross over strategy will work well. In this type of market, following trend is wiser than using the counter trend trading strategy. The real question is “Can we have such a simple market we can trade with moving average alone”? If so, we will be very lucky. Most of time, the financial market will show more complex behaviour, which will be introduced in later chapters. However, in some stock market, you might be able to find few easy opportunities. In Forex market, I think there is not so much opportunity to win with moving average indicator alone.
Figure 6-5: Moving Average Cross over strategy. Fast simple moving average is cross over slow simple moving average for buy opportunity.
Figure 6-6: Moving Average Cross over strategy. Fast simple moving average is cross down slow simple moving average for sell opportunity.
About this Article
This article is the part taken from the draft version of the Book: Scientific Guide to Price Action and Pattern Trading (Wisdom of Trend, Cycle, and Fractal Wave). Full version of the book can be found from the link below:
https://algotrading-investment.com/portfolio-item/scientific-guide-to-price-action-and-pattern-trading/
You can also use Ace Supply Demand Zone Indicator in MetaTrader to accomplish your technical analysis. Ace Supply Demand Zone indicator is non repainting and non lagging supply demand zone indicator with a lot of powerful features built on.
https://www.mql5.com/en/market/product/40076
https://www.mql5.com/en/market/product/40075
https://algotrading-investment.com/portfolio-item/ace-supply-demand-zone/
Below is the landing page for Optimum Chart (Standalone Charting and Analytical Platform).
https://algotrading-investment.com/2019/07/23/optimum-chart/

Young Ho Seo
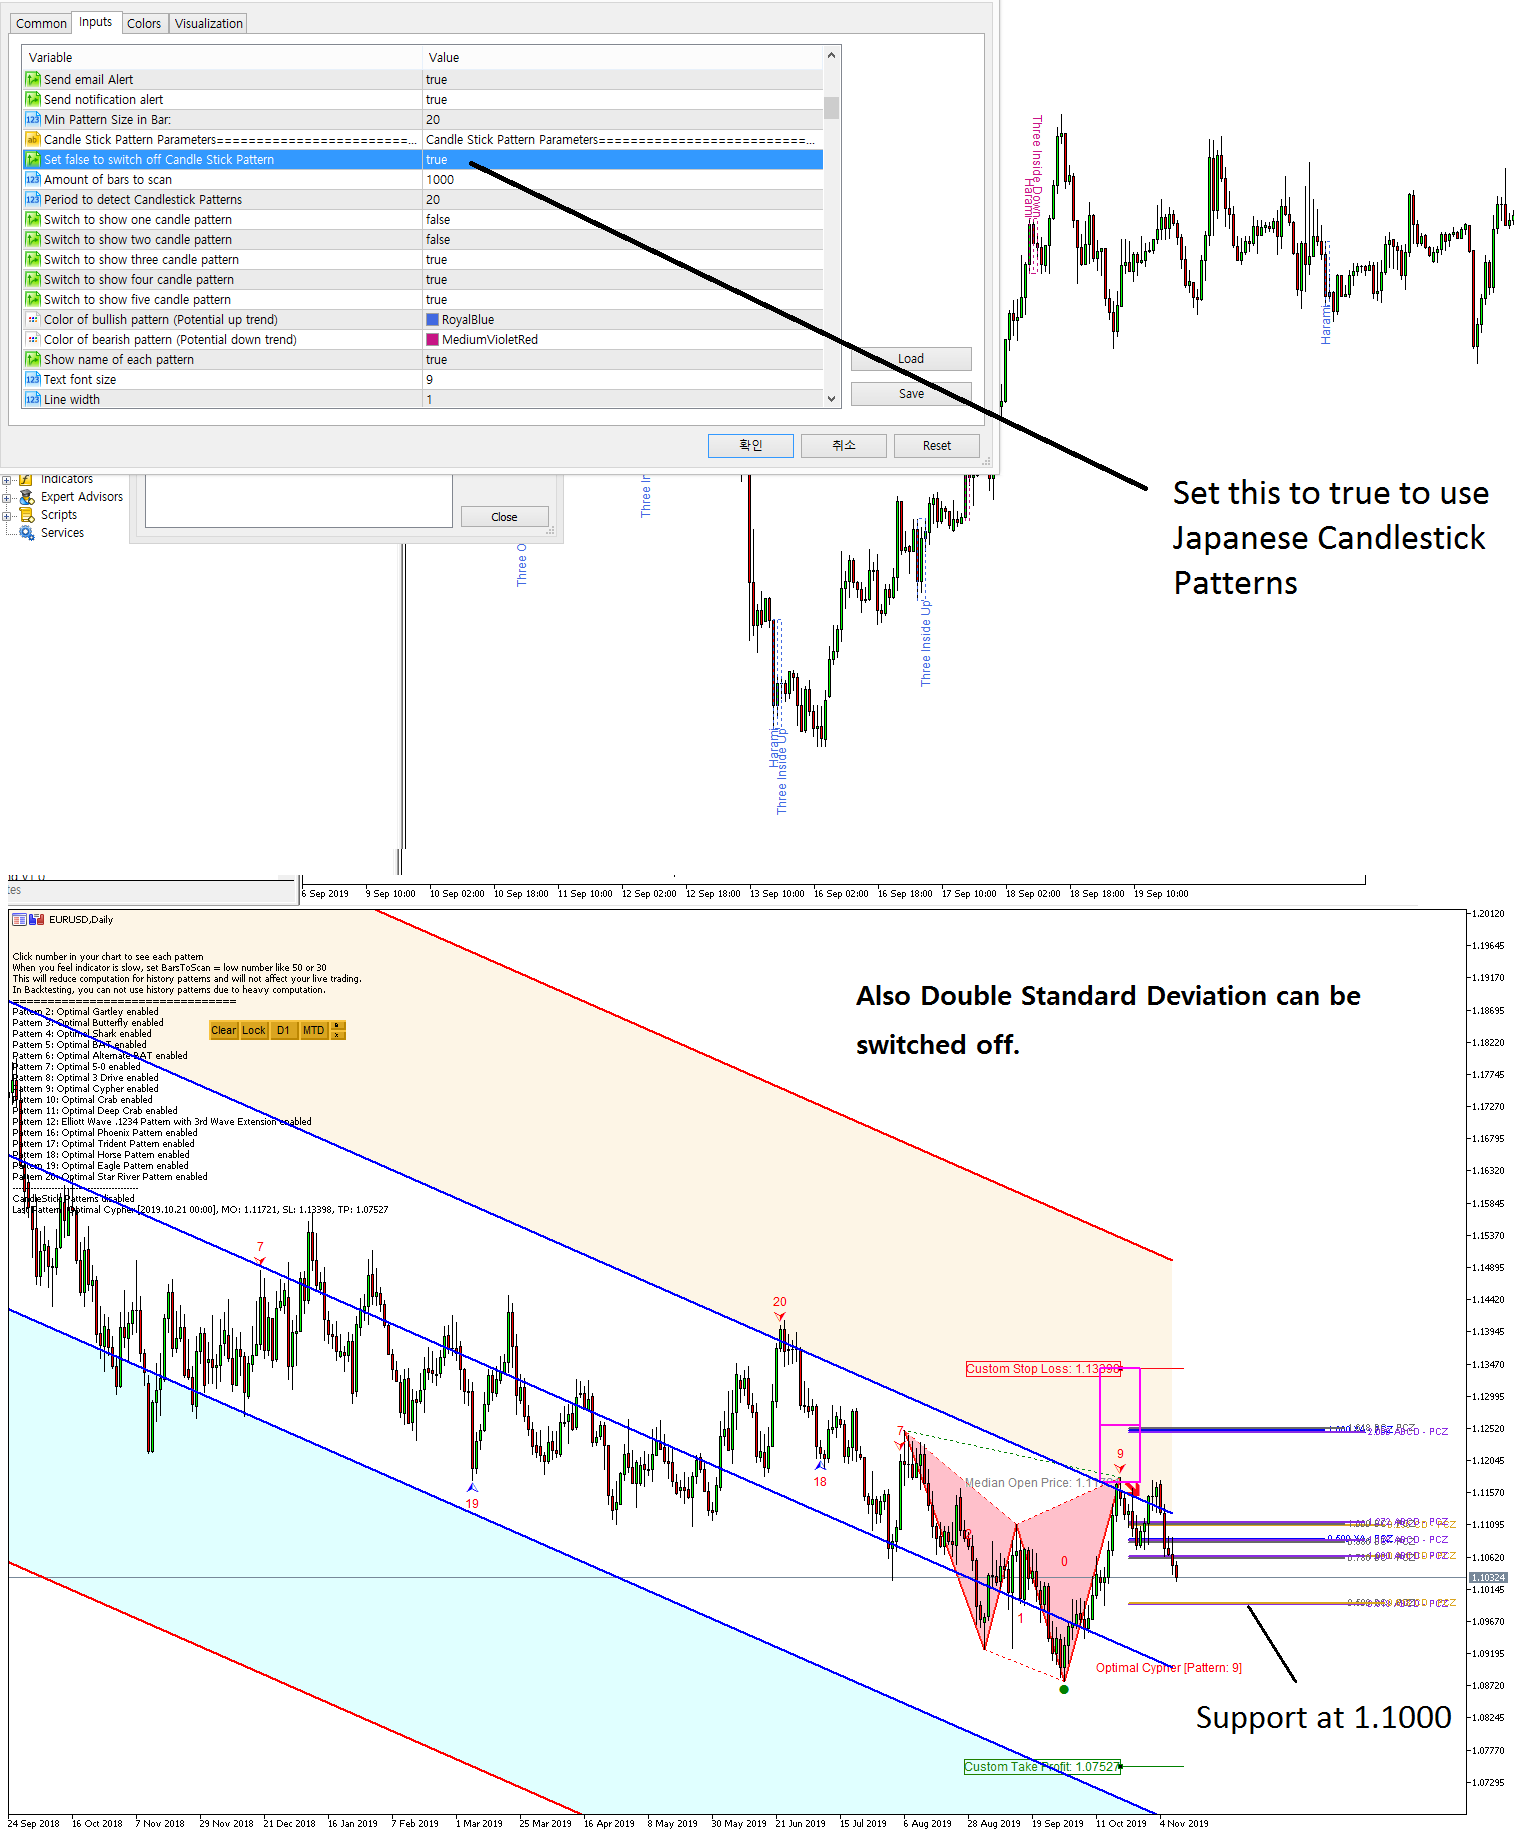
YouTube Video for X3 Chart Pattern Scanner
Video can explain a lot of details about how things works. You can use this video for first guide on using X3 Chart Pattern Scanner.
This video was originally created for the previous Optimal Turning Point Pattern Scanner. However, X3 Chart Pattern Scanner uses almost same user interface (with a lot of powerful additional features). Hence, you can use this video for X3 Chart Pattern Scanner too. For your information, since X3 Chart Pattern Scanner comes with a lot of new additional features, the video does not cover for those features. For example, X3 Chart pattern scanner can provide
Harmonic Patterns
X3 Chart Patterns
52 Japanese candlestick patterns
Automatic double standard deviation channel
and many more powerful features
Youtube: https://www.youtube.com/watch?v=uMlmMquefGQ
Also here is the product page for the X3 Chart Pattern Scanner. Enjoy the powerful non repainting and non lagging Harmonic Pattern, X3 Pattern and Elliott Wave Pattern indicator.
https://www.mql5.com/en/market/product/41993
https://www.mql5.com/en/market/product/41992
https://algotrading-investment.com/portfolio-item/profitable-pattern-scanner/

Young Ho Seo

Intro Video for Advanced Price Pattern Scanner
Advanced Price Pattern Scanner is the non repainting pattern scanner designed for both MetaTrader 4 and MetaTrader 5. It can detects many important price patterns for your trading like rising wedge, falling wedge, head and shoulder patterns, Cup and Handle, etc. Here is an intro video for Advanced Price Pattern Scanner from YouTube. Please check the YouTube Video titled as “Intro Video to Advanced Price Pattern Scanner”. This video covers some basic operation with Advanced Price Pattern Scanner in MetaTrader.
Advanced Price Pattern Scanner YouTube Video: https://www.youtube.com/watch?v=A1-IUr6u5Tg
In addition, you can watch the following YouTube Video to understand why price pattern is so important for your technical analysis.
Fractal to Advanced Technical Analysis YouTube Video: https://www.youtube.com/watch?v=RiTsWthvxfA
Below is the direct link to Advanced Price Pattern Scanner. As usual, we provide it for both MetaTrader 4 and MetaTrader 5 platforms.
https://algotrading-investment.com/portfolio-item/advanced-price-pattern-scanner/
https://www.mql5.com/en/market/product/24679
https://www.mql5.com/en/market/product/24678

Young Ho Seo
Impulse Wave Structural Score and Corrective Wave Structural Score
With the three tools including template, Fibonacci retracement and three wave rules, traders can identify the correct patterns to trade from their chart. We have provided six mechanical steps, which anyone can use to count waves in objective manner. Often, there are many traders focus more on fitting the wave counting to their chart. Fitting the wave counting can be useless unless every wave counting is accurate for every single label. For example, Figure 5-11 shows some complex wave labelling. Such a complex labelling can be often attempted by traders. The complex labelling does not results in high accuracy for your trading in general. Often the small error in the wave counting will be amplified later. Therefore, you will likely to override your counting repeatedly when the market does not move according to your wave counting. Complex labelling do not show your intellectual level either. For trading, we should aim to identify accurate pattern and avoid any complexity. Remember that in the financial market, the fractal geometry itself is not strict. In addition, financial market always have decent amount of random process going on. The random fluctuation will always contribute towards some unpredictable portion of the financial market. Therefore, we do not have to attempt labelling the wave for every single candle bar in our chart. Instead, we should try to use the most accurate pattern for our trading.
Figure 5-11: Example of complex wave counting fitted to chart.
Therefore, for better trading practice, we recommend “approach of the pattern detection” rather than “approach of fitting the wave counting”. We strongly emphasize not to use inaccurate wave counting for your decision-making. Instead, you can only rely on the wave patterns meeting certain quality for your trading. The question is how do we differentiate accurate pattern from inaccurate patterns? In order to assess the accuracy of wave patterns, we can revisit the pattern matching accuracy from the Harmonic Pattern. To recap what is the pattern matching accuracy in the case of Harmonic Pattern, it is the metrics showing how close our detected harmonic pattern matches to the perfect pattern made up from the ideal Fibonacci ratios. The concept of the pattern matching accuracy can be extended for the case of Elliott Wave counting too. Since three wave rules and the Fibonacci ratios provide the guideline for the quality of the pattern, we can incorporate such information into these error metrics as we did in the case of harmonic patterns:
Figure 5-12: Some possible Error Metrics for Elliott Wave pattern matching.
Once again, we can use the Mean Absolute Percent Error to quantify the pattern matching error for each Elliott Wave pattern.
Pattern matching accuracy can be calculated simply using the following formula:
Pattern matching accuracy (%) = 100 – Pattern matching error (%).
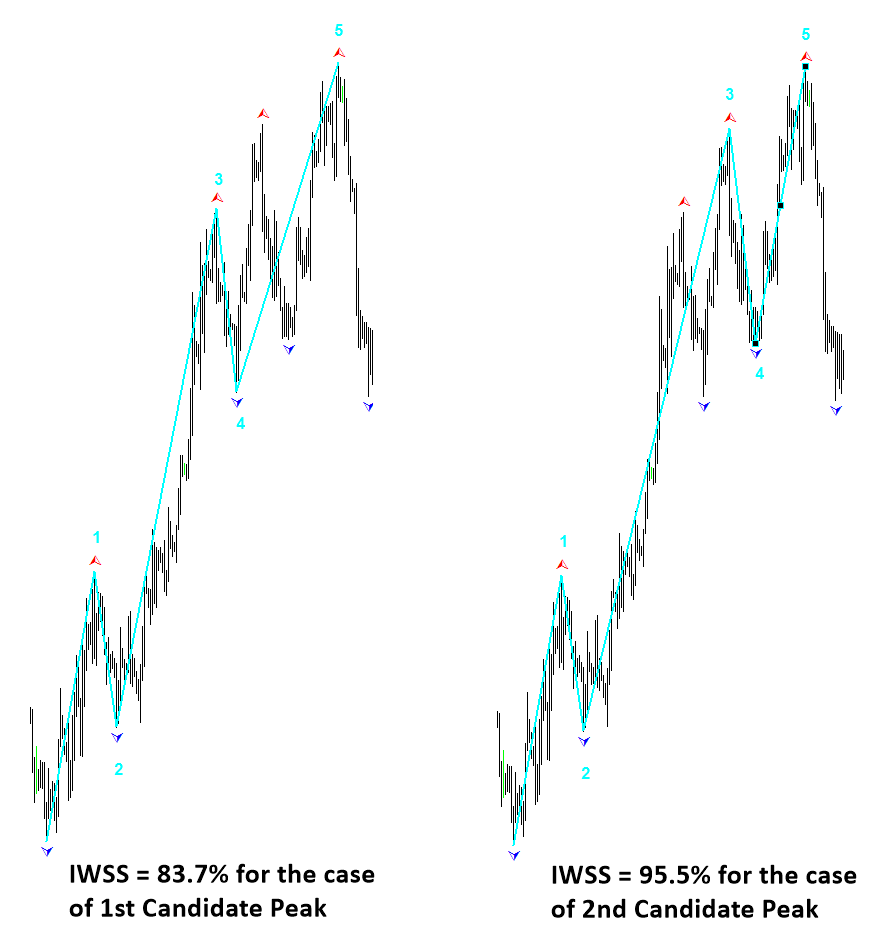
For both impulse wave and corrective wave, we can name the pattern matching accuracy as the Impulse Wave Structural Score (IWSS) and Corrective Wave Structural Score (CWSS). Since the term “impulse” and “motive” are used interchangeably. One can call the Impulse Wave Structure Score to Motive Wave Structural Score too. Simply speaking, Impulse Wave Structural Score tells you how closely the identified impulse wave pattern matches to the structure of the ideal impulse wave pattern. Likewise, Corrective Wave Structural Score tells you how closely the identified corrective wave pattern matches to the structure of the ideal corrective wave pattern. To give you working example on using the impulse Wave Structural Score and Corrective Wave Structural Score, consider our previous example with two candidate peaks for wave 3. With first candidate peak, our calculation for impulse Wave Structural Score was 83.7%. With second candidate peak, our calculation for impulse Wave Structural Score was 95.5%. This number support our conclusion made from our six steps. From our experience, Wave Structural Score below 80% considered as poor quality. For the decision making for trading, it is advised to use the Wave Structural Score over 80%. If you have two or three alternative scenarios for your wave counting at least satisfying three wave rules, then you can always choose the scenario with maximum Wave Structural Score. What if you never find any wave patterns that meet over 80% of Wave Structural Score at best, then you should not trade. It is always much better not to trade than trading with inaccurate pattern.
Figure 5-13: Impulse Wave Structural Score comparison. Impulse Wave Structural Score on the left was calculated when the first peak is considered as wave 3. Impulse Wave Structural Score on the right was calculated when the second candidate peak is considered as wave 3.
About this Article
This article is the part taken from the draft version of the Book: Scientific Guide to Price Action and Pattern Trading (Wisdom of Trend, Cycle, and Fractal Wave). Full version of the book can be found from the link below:
https://algotrading-investment.com/portfolio-item/scientific-guide-to-price-action-and-pattern-trading/
Elliott Wave Trend is the powerful metatrader indicator. It allows you to perform Elliott wave counting as well as Elliott wave pattern detection. On top of them, it provides built in accurate support and resistance system to improve your trading performance. You can watch this YouTube Video to feel how the Elliott Wave Indicator look like:
https://www.youtube.com/watch?v=Oftml-JKyKM
Here is the landing page for Elliott Wave Trend.
https://www.mql5.com/en/market/product/16479
https://www.mql5.com/en/market/product/16472
https://algotrading-investment.com/portfolio-item/elliott-wave-trend/

Young Ho Seo
Harmonic Pattern Indicator List for MetaTrader 4
Harmonic Pattern Indicator provide a mean of detecting the turning point in the market. It is one way to solve the puzzle of market geometry, which is often not solvable with technical indicators. How about automatic harmonic pattern detection for your trading ?
We provide the list of Harmonic Pattern Indicator for your MetaTrader 4 platform. These harmonic pattern indicators are not only detecting harmonic pattern but they also provide the addtional features to help you to win in your trading.
1. Harmonic Pattern Plus for MetaTrader 4
Harmonic Pattern Plus is the harmonic pattern scanner. It can detect harmonic patterns with predefined trading entries and stops. Pattern Completion Interval, Potential Reversal Zone and Potential Continuation Zone are supported. In addition, other dozens of powerful features are added like Japanese candlestick detection, automatic channel, etc.
https://www.mql5.com/en/market/product/4488
https://algotrading-investment.com/portfolio-item/harmonic-pattern-plus/
2. X3 Chart Pattern Scanner for MetaTrader 4
X3 Chart Pattern Scanner is non repainting and non lagging pattern scanner for Harmonic Pattern, Elliott Wave pattern and X3 patterns. It is the most advanced but user friendly harmonic pattern indicator. As a bonus, this tool can detect around 52 bearish and bullish Japanese candlestick patterns + advanced Channel features. This is the most advanced Harmonic and Elliott wave scanner in the market. You must try.
https://www.mql5.com/en/market/product/41992
https://algotrading-investment.com/portfolio-item/profitable-pattern-scanner/
3. Harmonic Pattern Scenario Planner for MetaTrader 4
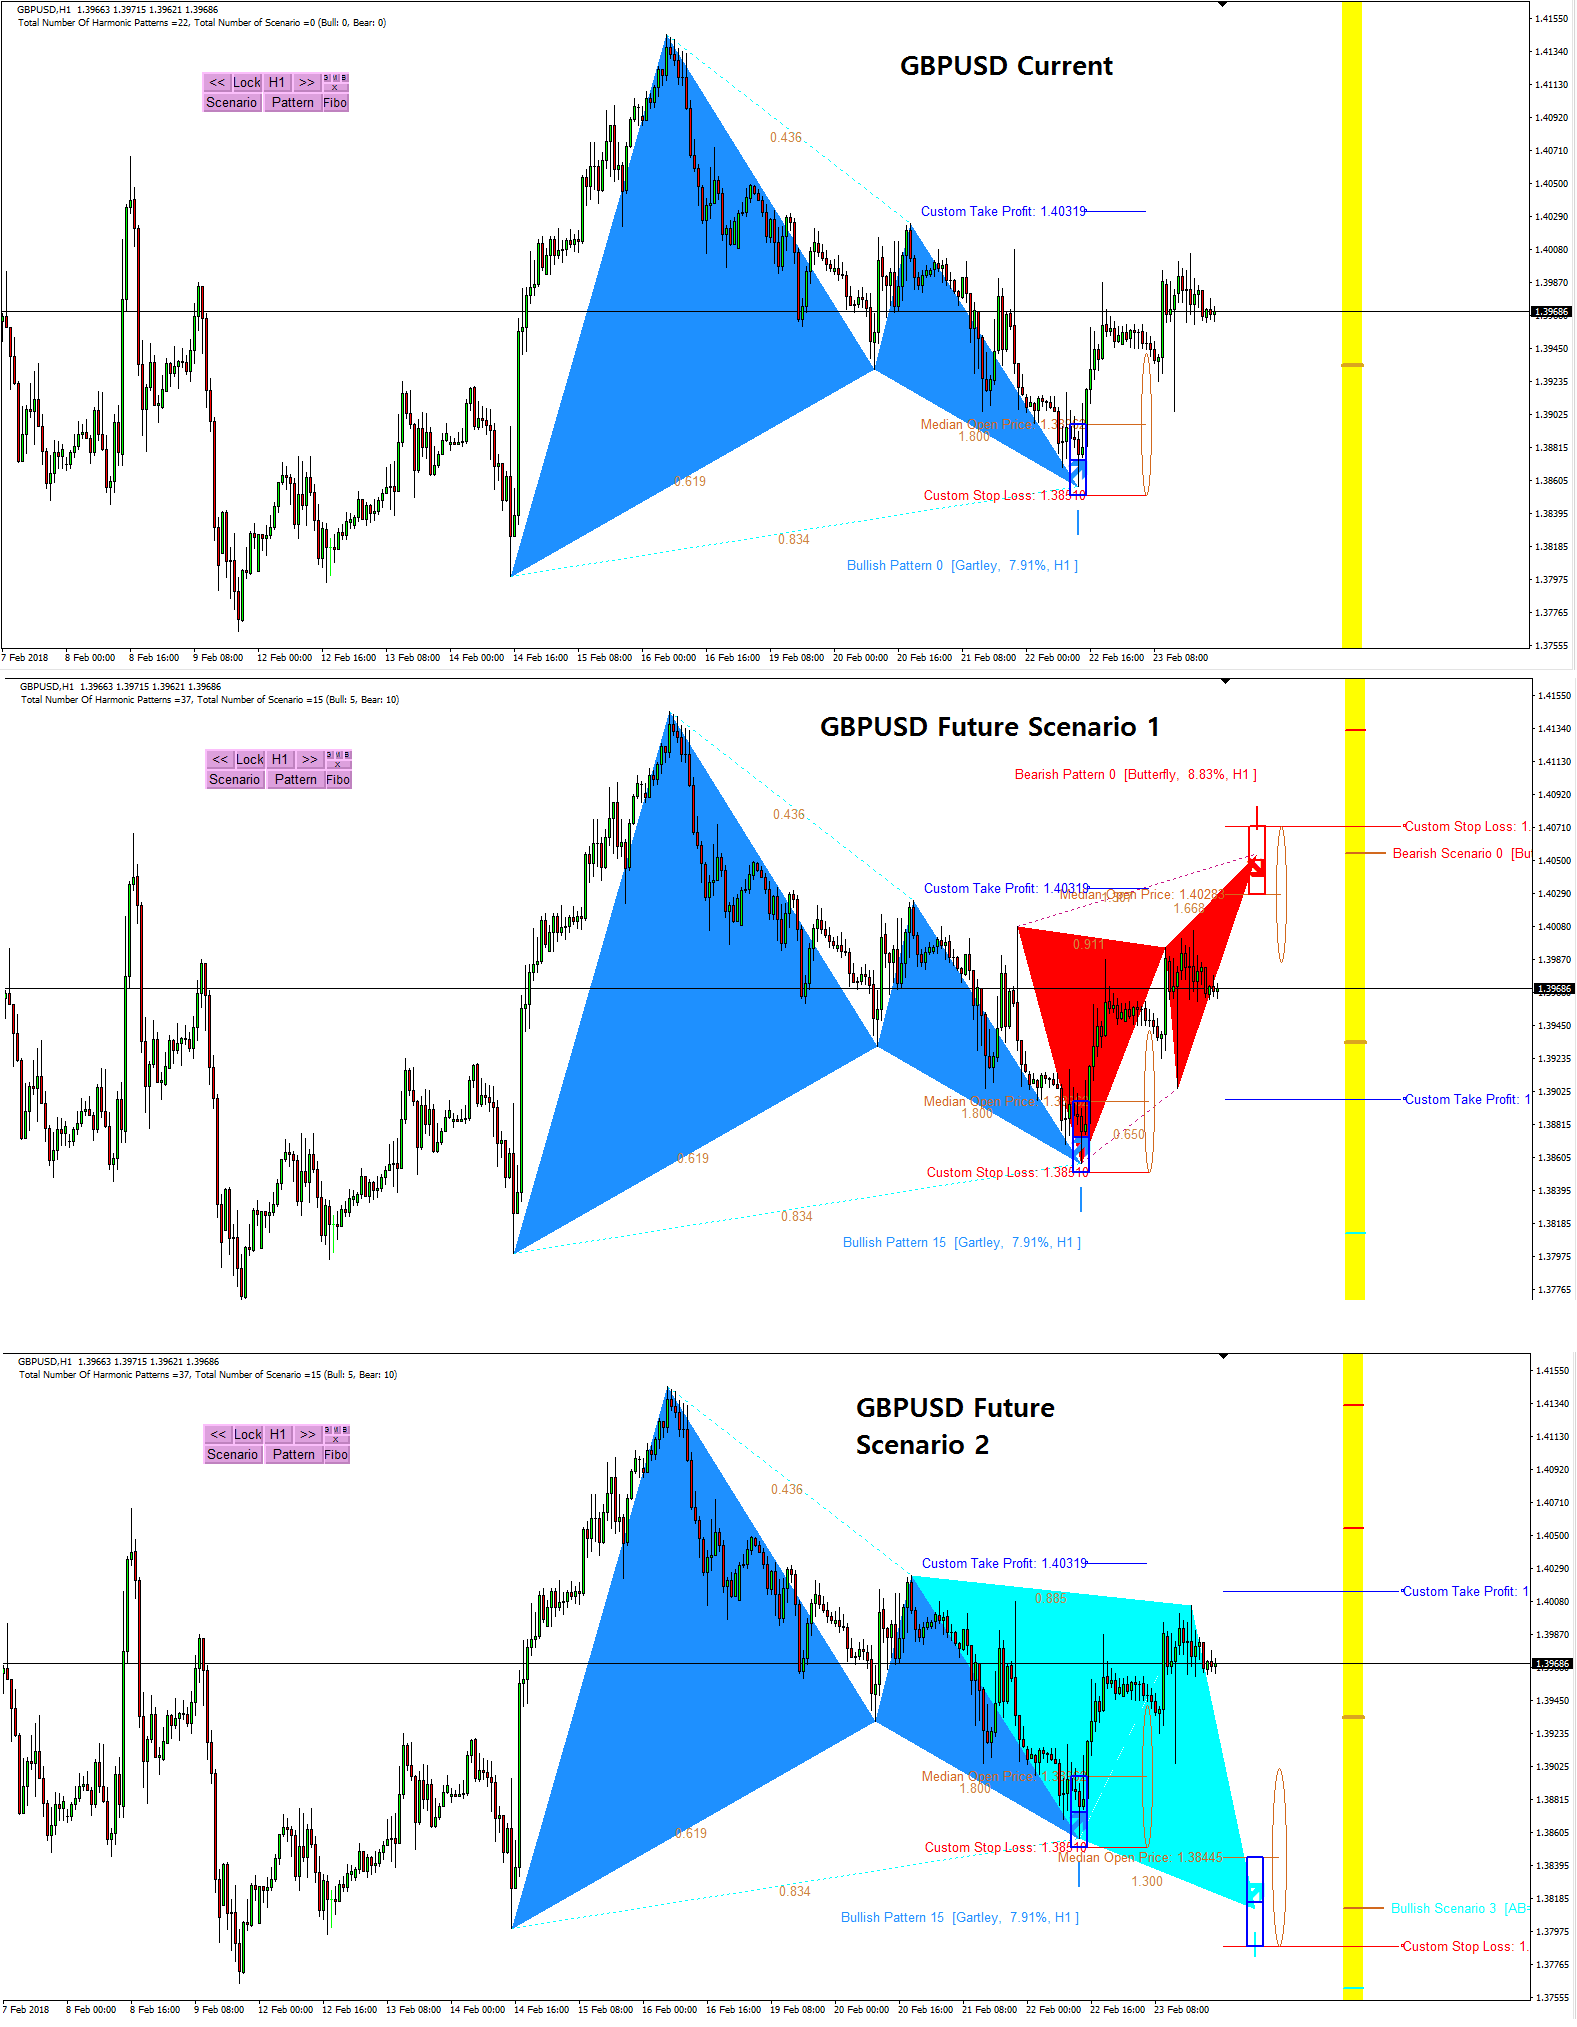
With additional features of predicting future harmonic patterns, this is the tactical harmonic pattern indicator with advanced simulation capability on top of many powerful features of harmonic pattern plus. Try it then you will know its power.
https://www.mql5.com/en/market/product/6240
https://algotrading-investment.com/portfolio-item/harmonic-pattern-scenario-planner/
In addition, you can watch the YouTube Video to feel what is the automated harmonic pattern indicator like. For your information, we provides two YouTube videos with title and links below.
YouTube “Harmonic Pattern Indicator”: https://youtu.be/CzYUwk5qeCk
YouTube “Non Repainting Non Lagging Harmonic Pattern Indicator”: https://youtu.be/uMlmMquefGQ

Young Ho Seo
Most advanced Elliott Wave Software for MetaTrader 5
MetaTrader 5 is the next generation trading platform developed by Meta Quote who developed MetaTrader 4. MetaTrader 5 is far exceeding trading platform of its predecessor, MetaTrader 4. MetaTrader 5 is accessible for free of charge for any trader from all over the world. More and more brokers are now offering MetaTrader 5 trading options even including US based firms.
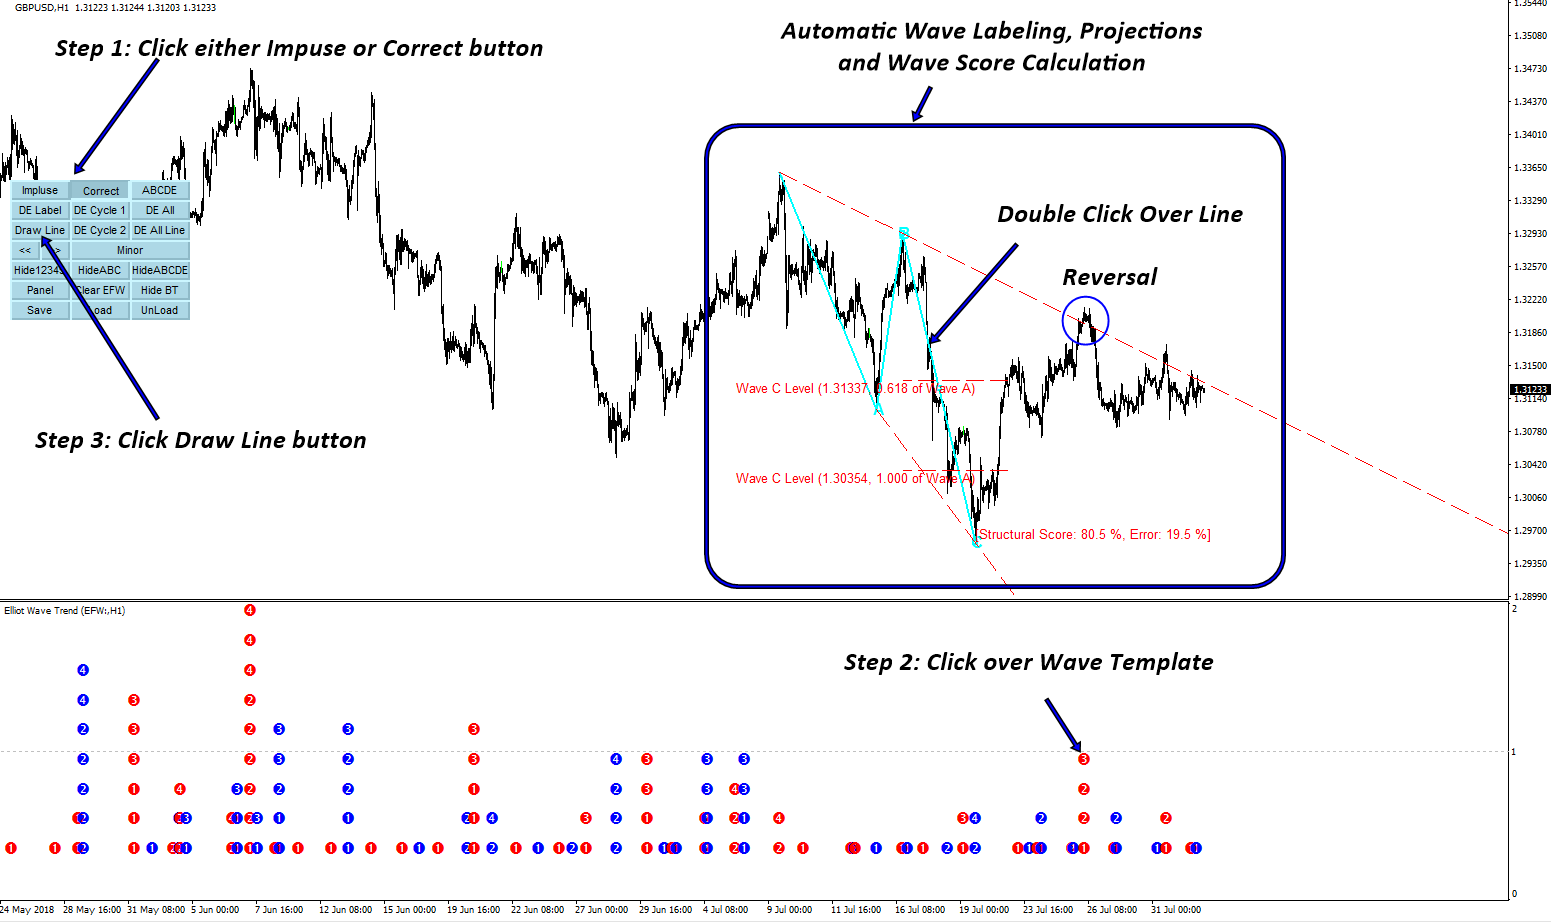
Elliott Wave Trend is the most advanced Elliott Wave Trading software, which helps you to trade with various Elliott Wave patterns like Wave .12345 pattern and Wave .ABC and Wave .ABCDE, etc. Elliott Wave Trend was built on the concept of Precision Trading with Elliott Wave Structure Score. Our Elliott Wave Trend is professional tool for professional trader. Yet, the price of it is affordable.
Our Elliott Wave Trend is available in both MetaTrader 4 and MetaTrader 5 version.
https://algotrading-investment.com/2018/10/25/how-elliott-wave-can-improve-your-trading-performance/
At the same time, you can watch YouTube video titled as “Elliott Wave Trend Intro to find out more about Elliott Wave Trend Indicator.
YouTube Link: https://youtu.be/Oftml-JKyKM
Link to Elliott Wave Trend.
https://algotrading-investment.com/portfolio-item/elliott-wave-trend/
https://www.mql5.com/en/market/product/16472
https://www.mql5.com/en/market/product/16479

: