|
8+ лет
опыт работы
|
3
продуктов
|
74
демо-версий
|
|
28
работ
|
0
сигналов
|
0
подписчиков
|
MQL5 Community:
Programmer + Forex Trader
Product on Market:
Forex Currency Power Index indicator for MT5
https://www.mql5.com/en/market/product/101322
Forex Currency Power Index indicator for MT4
https://www.mql5.com/en/market/product/101328
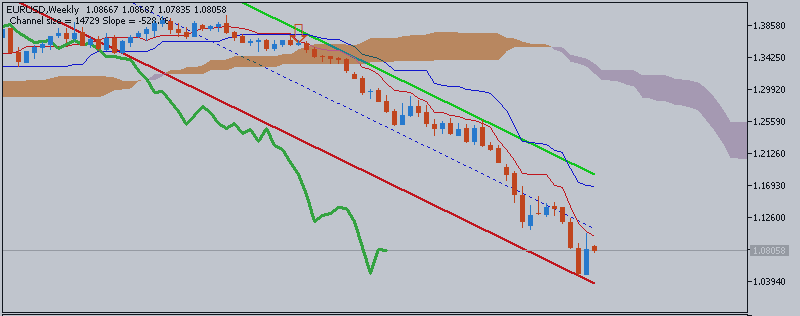
TrendColorBars
https://www.mql5.com/en/market/product/14715
Programmer + Forex Trader
Product on Market:
Forex Currency Power Index indicator for MT5
https://www.mql5.com/en/market/product/101322
Forex Currency Power Index indicator for MT4
https://www.mql5.com/en/market/product/101328
TrendColorBars
https://www.mql5.com/en/market/product/14715


Roberto Jacobs

· 6
9189
5701
Pankaj D Costa
2015.03.24
Thanks for sharing. Looks good as per image, will see in the real platform. Thanks again.
Roberto Jacobs

· 4
11005
14145
Matthew Todorovski
2015.03.24
Thank you for sharing! You could sell this as a product in MQL Market and make money, but instead you are freely sharing the product and code for the benefit of everyone! You are very kind - thank you very much sir!