К сожалению "Destiny Eurusd Matrix Indicator" недоступен.
Вы можете ознакомиться с другими продуктами GEORGIOS VERGAKIS:

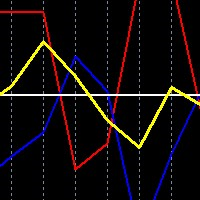
This is a simple free tool for simulating trades when trading both AUDUSD and NZDUSD in a hedge strategy, you can drop the indicator on either market chart. It is essential because you cannot tell at a glance, what a combined trade would be like, just by looking at the two individual charts separately.
New premium low cost indicator
How to use: Drop the indicator on either AUDUSD or NZDUSD chart, or any other chart, it will work.
You choose ploting period, to the number of days/weeks
FREE

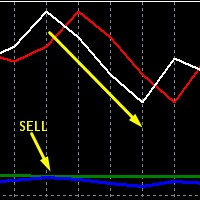
This is the original, simpler version of our core EURUSD algorithm (it calculates and displays 2 lines rather than 3), but it is still capable of detecting levels in the market where EURUSD will likely move to. These levels are indicated by unusual large gaps, formed by the two lines.
Detailed guidance is given to users. All in all it works on the very short term, and more importantly on the daily chart.
The differences between this and our top EURUSD indicator, is that this one only dis

Caution! This indicator is mainly for investors and medium term traders, Day-trading is not possible! This is because correlation is a medium to long term thing. Ideal use of this indicator is for currency Option sellers, where they can deploy sure fire profiable Option selling over few days to several weeks out. We provide further advice on this plus an optional hedge strategy idea and indicator on long time rentals*.
This indicator keeps performing very well, in all market conditions,

For the new traders of this strategy please remember the convention:
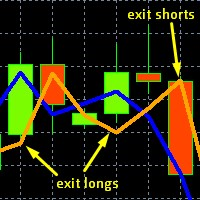
FORWARD trade = BUY AUDUSD and SELL NZDUSD at equal lot size
REVERSE trade = SELL AUDUSD and BUY NZDUSD at equal lot size
Risk is mittigated by the opposing nature of the trades, one tends to offset the other almost 70% of the time, and for when this is not the case we rely on the indicators accordingly - no stops are used in correlation hedge!
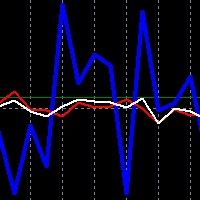
This is an enhanced oscillator like analysis of the relationship betw

This is a correlation hedge type indicator which helps trade the obscure relationship between crude oil and natural gas markets. Which is overall an unknown trading concept to most traders, yet a very impressive one.
Important!: this indicator is for Pepperstone users only, due to wide spread unavailability of symbols, we were unable to make this indicator for all brokers, only Pepperstone worked, so only for Pepperstone mt4 accounts, you can cofirm it will work if you have such an accoun