• Обзор
  • Отзывы (1)
  • Обсуждение (2)
  • Что нового

MACD Divergence Scanner MT5

5

50% off. Original price: $60

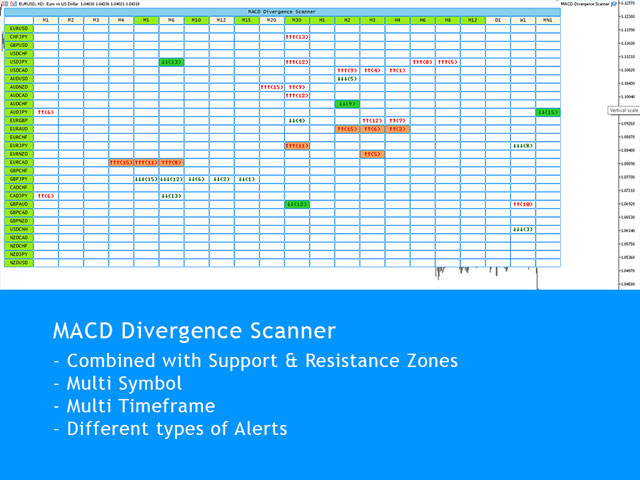
MACD Divergence Scanner is a multi-timeframe and multi-symbol dashboard and alert that checks all timeframes and symbols to find regular and hidden divergences between price chart and MACD indicator.

This divergence scanner is integrated  with support and resistance zones so you can check the MACD divergences in the most important areas of the chart to find trend reversals in the price chart.

Download demo version (works on M4,M5,M6,M12,H3,H8 timeframes)

Full description of scanner parameters -> click here.

How to get the most from the scanner -> read this article.

Using MACD divergences alongside other technical tools like price action, candlestick patterns and support resistance zones gives reliable signals for possible trend reversals.

If you are using MACD Divergence in your trading strategy, this scanner helps you find the best opportunities to trade without spending much time in front of your system.

MACD Divergence Scanner Features:

  • Scanner finds both regular (classic) and hidden divergences
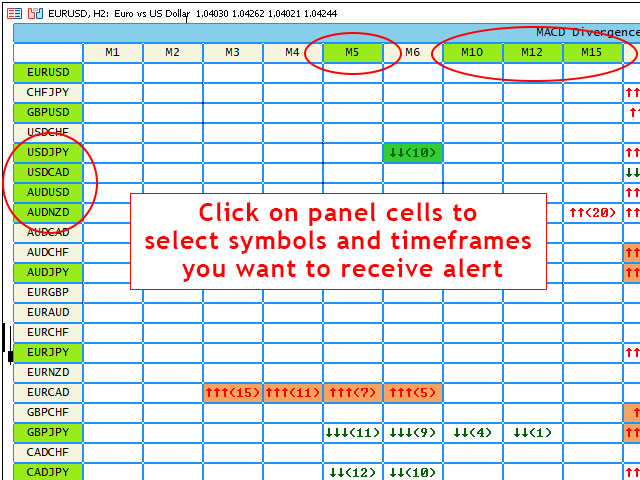
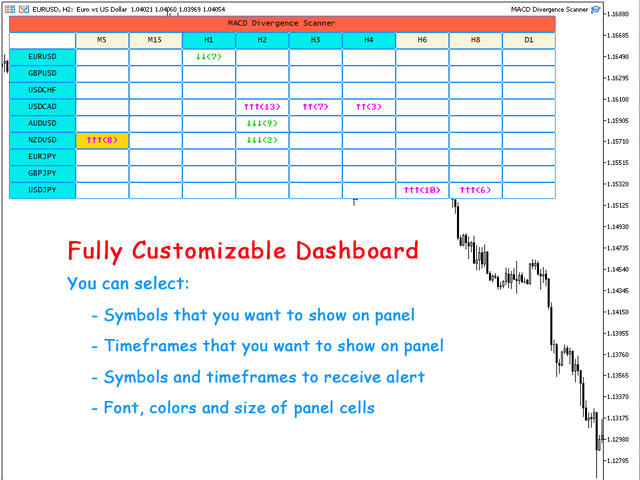
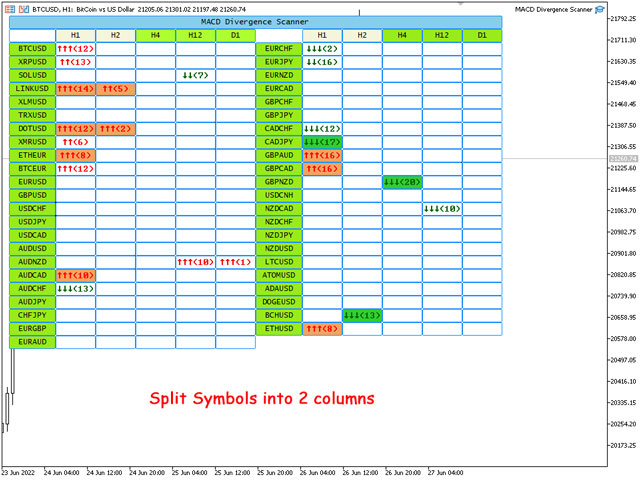
  • Run the dashboard on one chart and see the MACD Divergence for all selected symbols and timeframes.
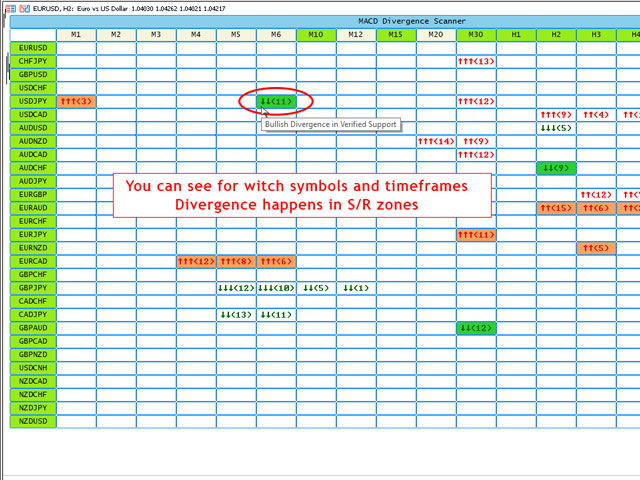
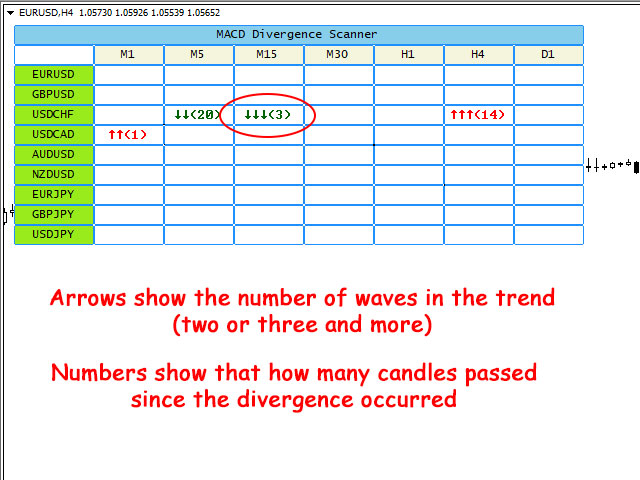
  • The panel shows that how many candles passed since the divergence occurred.
  • The panel shows the number of trend waves (2 or 3 and more) that leads to the divergence.
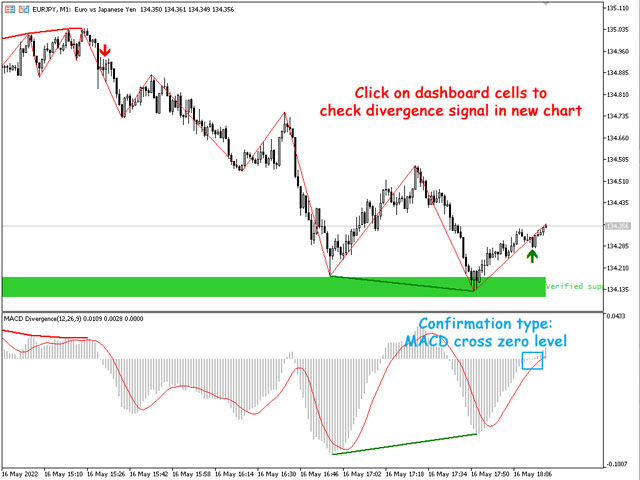
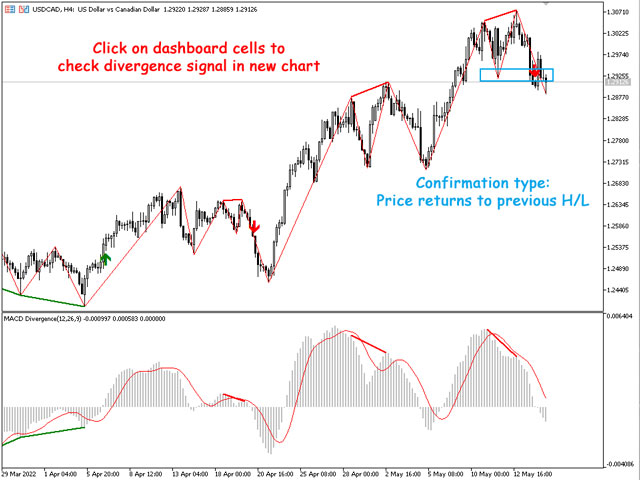
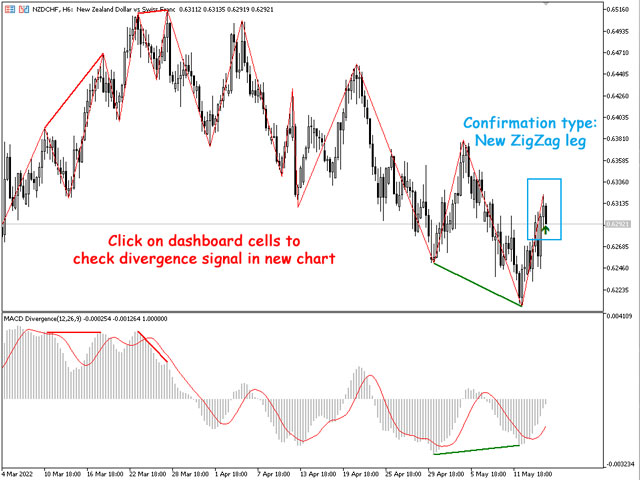
  • When you click on table cells, you can see the S/R zone, divergence line and divergence arrow on the opened price chart.
  • You can split the symbols into 2 or 3 columns to show more symbols on the chart.
  • You can separate symbols into multiple dashboards with different parameters for each dashboard (for example for different markets).
  • There are a full set of parameters for customizing the appearance of the dashboard.
  • You can enable/disable alerts for symbols and timeframes directly from the scanner dashboard.
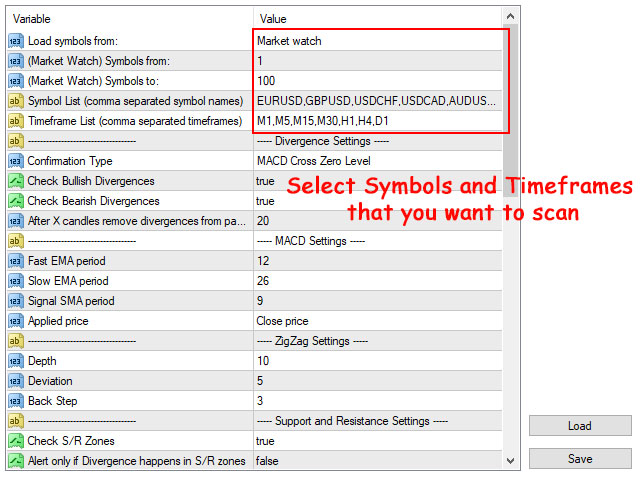
  • Scanner works in all markets (Forex, Stocks, Indices, Commodities, Crypto ...), you can write the symbol names in the settings (comma separated) or simply set the scanner to read the symbols from market watch.

Different confirmations for divergences

There are 8 confirmation option for MACD divergences that you can select in input parameters:

  • Candlestick Patterns
  • MACD cross Signal line
  • MACD line cross zero level
  • Price returns to previous H/L (known as change of character or momentum shift)
  • Heiken Ashi indicator - Changing the Color
  • Stochastic indicator - Lines Cross
  • Strong Reversing Candle (may not happen)
  • Immediate alert without confirmation

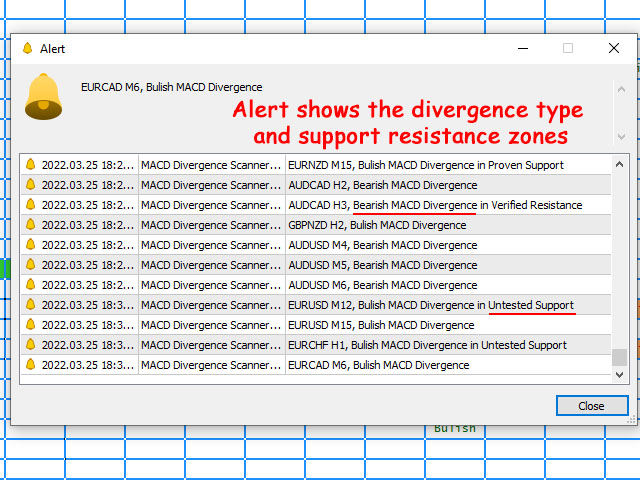
When divergence is confirmed, the panel shows it and you can set the scanner to receive alert for it.

Integrated with support and resistance zones

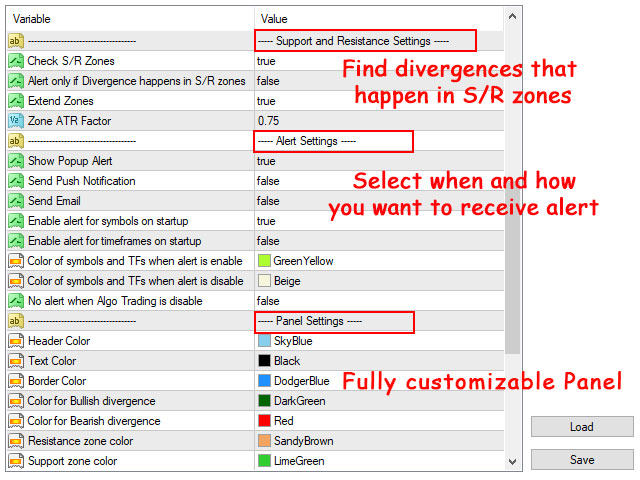
  • You can set the scanner to only receive alerts for MACD divergences that are inside the support and resistance zones.
  • You can see witch MACD divergences happen in support resistance zones through cell colors.
  • You can set the parameters for support and resistance zones in scanner input parameters.
  • Support and resistance zones are calculated based on shved supply and demand indicator that you can download for free from this link (scanner doesn't need it).

Different Alert Types:

You can enable the following alerts at the same time in the scanner settings.

  • Show Pop Up Alert: Show alert window when scanner alert triggers.
  • Send Push Notification: Send push notification to mobile phone when scanner alert triggers. (You should set metatrader Notifications options)
  • Send Email: Send email when scanner alert triggers. (You should set metatrader Email options)

Notes:

  • MACD Divergence Scanner uses ZigZag indicator to determine trend direction and HH/LL of the price, you can change the ZigZag parameters in the indicator's input window.
  • You can add the free MACD Divergence Indicator to your default chart template, so when you click on the dashboard cells, you can see the divergence on the opened chart (dashboard doesn't need the indicator to run).
  • Dashboard works smoothly for 70 symbols and 10 timeframes on an average PC, you can add more symbols when you reduce the number of timeframes.
  • If there are many symbols in the market watch, in the first run of the scanner on the chart it may take some time to load the history data for all timeframes of all symbols.
  • If you don't want to find MACD divergences on W1 and MN1 timeframes, don't load them on the dashboard. Charts must have at least 300 candles for checking the trend and finding the divergences.
  • Dashboard updates every 1-minute candle open time, run it on more volatile symbols like EURUSD and BTCUSD to receive new price ticks faster.

Отзывы 1
boga1
171
boga1 2024.04.04 12:43 
 

I don't know why there isn't much reviews on this great scanner. This is the best Divergence scanner on this platform. The signals on the H1 and H4 are awesome. I highly recommend for anyone trading

Рекомендуем также
50% off. Original price: $60 RSI Divergence Scanner is a multi-timeframe and multi-symbol dashboard and alert that checks all timeframes and symbols to find regular and hidden divergences between price chart and RSI indicator. This divergence scanner is integrated with support and resistance zones so you can check the RSI divergences in the most important areas of the chart to find trend reversals in price chart. Download demo version   (works on M4,M5,M6,M12,H3,H8 timeframes) Full description
Индикатор Elliott Wave Trend был разработан для научного подсчета волн на основе шаблонов и паттернов, впервые разработанных Чжон Хо Сео. Индикатор нацелен на максимальное устранение нечеткости классического подсчета волн Эллиотта с использованием шаблонов и паттернов. Таким образом индикатор Elliott Wave Trend в первую очередь предоставляет шаблон для подсчета волн. Во-вторых, он предлагает структурный подсчет волн Wave Structural Score, которые помогает определить точное формирование волны. Он
Introducing the Consecutive Green/Red Candle Alert Indicator for MT5 - Your Trend Spotting Companion! Are you ready to take your trading to the next level? We present the Consecutive Green/Red Candle Alert Indicator, a powerful tool designed to help you spot trends and potential reversals with ease. Whether you're a new trader looking for clarity in the market or an experienced pro seeking additional confirmation, this indicator is your trusted companion. Key Features of the Consecutive Gre
This indicator can automatically scan the RSI values of all varieties on the mt5 and set an alarm. Note that it is fully automatic scanning, you do not need to enter which varieties, do not need to open the variety chart, as long as there are some varieties in the market quotation column, will be automatically scanned to reach the set rsi alarm value, will pop up the alarm, and cycle with the market changes to scan the latest RSI values of all varieties, and alarm. This is very helpful t
Trend Trading - это индикатор, предназначенный для получения максимальной прибыли от трендов, происходящих на рынке, путем определения времени отката и прорыва. Он находит торговые возможности, анализируя, что делает цена во время установленных тенденций. [ Руководство по установке | Руководство по обновлению | Устранение неполадок | FAQ | Все продукты ] Торгуйте на финансовых рынках с уверенностью и эффективностью Прибыль от устоявшихся тенденций без проволочек Признать прибыльные откаты,
QM (Quasimodo) Pattern is based on Read The Market(RTM) concepts. The purpose of this model is to face the big players of the market (financial institutions and banks), As you know in financial markets, big traders try to fool small traders, but RTM prevent traders from getting trapped. This style is formed in terms of price candles and presented according to market supply and demand areas and no price oscillator is used in it. RTM concepts are very suitable for all kinds of investments, includi
Индикатор Fractals отображает на графике только фракталы с заданными параметрами в настройках индикатора. Это позволяет с большей точностью фиксировать разворот тренда исключая ложные развороты.  По классическому определению фрактал, это свеча - экстремум на графике, который не пересекала цена 2 свечи до и 2 свечи после появления свечи фрактала. В данном индикаторе есть возможность настройки количества свечей до и после экстремума, а также минимальное количество пунктов терминала ухода цены от э
Индикатор определяет паттерны гармоник (XABCD) согласно разработок H.M.Gartley ( "Profits in the Stock Market" , 1935г). Проецирует D-point -- как точку в перспективной проекции (в настройках указать параметр ProjectionD_Mode = true ). Не перерисовывает. На закрытии бара рабочего тайм-фрейма, если в течение Patterns_Fractal_Bars баров последняя обнаруженная точка паттерна не сдвинулась - возникает стрелка на графике (в направлении предполагаемого движения цены). С этого момента стрелка остается
Технический индикатор Universal Oscillator является комбинацией торговых сигналов самых популярных и широко используемых осцилляторов. Индикатор представлен гистограммами, а также линиями fast и slow MA, что позволяет расширить список получаемых торговых рекомендаций и работать как по тренду, так и в боковом движении рынка. Таким образом, гистограммы позволяют определить момент пробоя ценовых значений и движение в новой фазе рынка, а линии указывают на зоны перекупленности и перепроданности.  Ос
Premium level - это уникальный индикатор с точностью правильных прогнозов  более 80%!  Данный индикатор тестировался более двух месяцев лучшими Специалистами в области Трейдинга!  Индикатор авторский такого вы больше не где не найдете!  По скриншотах можете сами увидеть точностью данного инструмента!  1 отлично подходит для торговли бинарными опционами со временем экспирации на 1 свечу. 2 работает на всех валютных парах, акциях, сырье, криптовалютах Инструкция: Как только появляется красная стре
Stochastic  Reversal  allows you to recognize reversals professionally. Stochastic Indicator: This technical indicator was developed by George Lane more than 50 years ago. The reason why this indicator survived for so many years is because it continues to show consistent signals even in these current times. The Stochastic indicator is a momentum indicator that shows you how strong or weak the current trend is. It helps you identify overbought and oversold market conditions within a trend.  Rules
Description : Rainbow EA MT5 is a simple Expert advisor based on   Rainbow MT5 indicator witch is based on Moving average with period 34. The indicator is incorporated in the EA, therefore, it is not required for the EA to operate, but if you wish, you can download it from   my product page . The Expert Advisor settings are as follows : Suitable for Timeframes up to H1 The parameters below can be set according to your trading rules. StopLoss ( Stop Loss in pips) TakeProfit ( Take Profit in pi
Это инновационный индикатор измерения силы валют от INFINITY является незаменимым помощником для скальперов и трейдеров торгующих в долгую. Система анализа Силы/слабости валют давно известна и применяется на рынке ведущими трейдерами мира. Любая арбитражная торговля не обходится без этого анализа. Наш индикатор легко определяет силу базовых валют по отношению друг к другу. Он выводит линейные графики по всем или по текущей паре валют, позволяя проводить мгновенный анализ и поиск наиболее силь
ET9 New on the Market, Launch promo! Only a few copies left at: $599 Next price: $799 Final price: $1599 The Best Expert Advisor  on   XAUUSD   any timeframes , It can also be used on GBPUSD at the same time! ET9  for MT5 Updated v4.20 !!      Important update: Enable automatic closing of profits,  Various parameters of the ET1 strategy can be modified, Optimized the stability of ET1 strategy Include Free ET1 for MT5:  https://www.mql5.com/en/market/product/113131 Descriptions ET9 for MT5
Noize Absorption Index - is the manual trading system that measures the difference of pressure between bears forces and bulls forces. Green line - is a noize free index that showing curent situation. Zero value of index shows totally choppy/flat market.Values above zero level shows how powerfull bullish wave is and values below zero measures bearish forces.Up arrow appears on bearish market when it's ready to reverse, dn arrow appears on weak bullish market, as a result of reverse expectation.
Прежде всего стоит подчеркнуть, что этот торговый индикатор не перерисовывается, не перерисовывает и не отставает, что делает его идеальным как для ручной, так и для роботизированной торговли. Атомный аналитик - это индикатор ценового действия PA, который использует силу и импульс цены, чтобы найти лучший край на рынке. Оборудованный расширенными фильтрами, которые помогают убирать шумы и ложные сигналы, и повышают торговый потенциал. Используя несколько слоев сложных индикаторов, Атомный анали
Простая, но эффектиная система для определения форекс-тренда. Представляет собой два индикатора в одном: Heiken Ashi и Heiken Ashi Smoothed Moving Average (сглаженная скользящая средняя). Heiken Ashi (HA) и Heiken Ashi Smoothed (HAS) рассчитываются в рамках одного события с необходимыми буферами и циклом, повышая скорость их работы, улучшая оптимизацию и эффективность . По вашему выбору на графике могут отображаться одновременно оба индикатра или только один. Входные параметры Display Heiken A
Развитие идей, заложенных в популярный индикатор MACD: Находит и наглядно отображает классические и обратные дивергенции (два способа обнаружения дивергенций). Выделяет на индикаторе разными цветами тренд вверх, вниз. Два метода определения тренда: а) MACD пересекает уровень 0 (классический сигнал); б) MACD пересекает свою среднюю (ранний сигнал). Индикатор мультитаймфреймовый - может показывать данные MACD других таймфреймов. Два способа отрисовки индикатора: классическая гистограмма и линия. З
Price Breakout pattern Scanner - это полностью автоматический и мощный анализ для трейдеров и инвесторов. Он определяет следующие паттерны на графике. Голова и Плечи - Распространенный паттерн для торговли. Обратная Голова и Плечи - эта модель обратна паттерну Голова и плечи. Двойная вершина - когда цена дважды достигает уровня сопротивления и снизится к уровню поддержки, трейдер может ожидать внезапный медвежий прорыв уровня поддержки. Двойное дно - двойное дно является противоположностью формы
Утилита для автоматического управления ордерами и рисками.   Позволяет взять максимум с прибыли и ограничить свои убытки.   Создан практикующим трейдером для трейдеров.   Утилита  проста в использовании,  работает с любыми рыночными ордерами, открытыми трейдером вручную или при помощи советников. Может фильтровать сделки по магическому номеру. Одновременно утилита может работать с любым количеством ордеров.  Имеет такие функции: 1. В ыставление уровней стоплосс и тейкпрофит; 2. З акрытие сдело
Schaff Trend Cycle STC
Mohammad Taher Halimi Tabrizi
The Schaff Trend Cycle indicator is the product of combining Slow Stochastics and the moving average convergence/divergence (MACD). The MACD has a reputation as a trend indicator, but it's also notorious for lagging due to its slow responsive signal line. The improved signal line gives the STC its relevance as an early warning sign to detect currency trends. this indicator is converted from Trading View code of STC Indicator - A Better MACD [SHK]
Excessive Momentum Indicator – один из немногих индикаторов, измеряющий чрезмерный импульс на финансовом рынке с использованием ценового поведения. Индикатор полностью разработан Янгом Хо Сео (Young Ho Seo). Этот показатель демонстрирует концепцию и практическое применение Равновесной фрактальной волны (Equilibrium Fractal Wave). Чрезмерный импульс на рынке может рассказать о психологии толпы и помочь спрогнозировать направление цены. Таким образом, вы можете основывать свои торговые решения на
Introduction to Chart Pattern MT Chart Pattern MT is a chart pattern scanner to detect the triangle pattern, falling wedge pattern, rising wedge pattern, channel pattern and so on. Chart Pattern MT uses highly sophisticated chart pattern detection algorithm. However, we have designed it in the easy to use with intuitive user interface. Chart Pattern MT will show all the patterns in your chart in the most efficient format for your trading. You do not have to do tedious manual pattern detection an
Buy CTS scalping indicator, provide buying and selling signals, automatic channeling and sending signals to mobile phones Using technical analysis and price action methods and modern methods, CTS indicator can draw price channels and recognize price trends with high accuracy and issue entry and exit signals according to them. Traders can easily fluctuate using this indicator in different time frames and in different markets. With the CTS indicator, you can signal in different ways. This indicat
Индикатор кумулятивной дельты Как считает большинство трейдеров, цена движется под давление рыночных покупок или продаж. Когда кто-то выкупает стоящий в стакане оффер, то сделка проходит как "покупка". Если же кто-то наливает в стоящий в стакане бид - сделка идет с направлением "продажа". Дельта - это разница между покупками и продажами. А кумулятивная дельта - разница между покупками и продажами накопленным итогом за определенный период времени. Она позволяет видеть, кто в настоящий момент конт
Oscilador Yacht
Ignacio Agustin Mene Franco
Package Yacht indicator 2/3 Oscillator yacht, has the strategy of breakouts with the oscillator in the levels, 1.05, 0.50, 0.00, 050 and 1.05 are 5 levels where the volume no longer gives in the period of 1.05 on the lower side, the red candle begins to form, rising ay gives long signal, where it verifies it with 3 yellow, green and red dots, the same is for short when it breaks the green level, and breaks the line changing color starts entry works for forex markets and synthetic indices all tem
The ChanLun or Chan theory is one of the most popular trading theories in China. But it seems like that it has little influence in western countries. Actually, the Chan Theory is based on a sophisticated mathematical model. The basic idea ChanLun is to simplify the bar chart by its model. With the help of ChanLun, a trader can analyze and predict the trend of future goods, stocks. In ChanLun, there are several basic elements called fractals, strokes, line segments and pivots . A trader should p
An Ultimate Tool  for quick and efficient market analysis. Unique combination of solid indicators defining market direction for trend tracking and filtration designed for you to stay on the   right   side of the market. Market Rider Oscillators  gives you access to one of the most used from professional trades indicators on worldwide, which were not build in for MT4 and MT5 terminals . These are unique non-repainting oscillators designed to be used on all time frames for all instruments class
DYJ TRADINGVIEW — это многоиндикаторная рейтинговая система, использующая подсчет рейтинговых сигналов и инструменты анализа для поиска возможностей входа на мировые рынки. DYJ TRADINGVIEW имеет 10 встроенных индикаторов для анализа рынка. Анализ на основе индикаторов используется многими трейдерами, чтобы помочь им принять решение о том, какие сделки заключать и где входить и выходить из них. Мы используем несколько разных типов, которые могут хорошо дополнять друг друга. Используйте нас, чтобы
Версия MT4   |   FAQ Индикатор Owl Smart Levels – это полноценная торговая система внутри одного индикатора, которая включает в себя такие популярные инструменты анализа рынка как усовершенствованные фракталы Билла Вильямса , Valable ZigZag, который строит правильную волновую структуру рынка, а также  уровни Фибоначчи, которые   отмечают точные уровни входа в рынок и места взятия прибыли. Подробное описание стратегии Инструкция по работе с индикатором Советник-помошник в торговле Owl Helper При
С этим продуктом покупают
Trade Assistant MT5
Evgeniy Kravchenko
4.4 (171)
Помогает рассчитать риск на сделку, простая установка нового ордера с помощью линий, управление ордерами с функциями частичного закрытия, 7 типов трейлинг-стопа и другие полезные функции. Внимание приложение не работает в тестере стратегий.  Manual, Description, Download demo Функция Линии   - отображает на графике линию открытия, стоп-лосс, тейк-профит. С помощью этой функции легко установить новый ордер и увидеть его дополнительные характеристики перед открытием. Управление риском   -  
Считаете ли вы, что на рынках, где цена может измениться за доли секунды, размещение ордеров должно быть максимально упрощено? Если вы хотите создать ордер в Metatrader, вы должны открыть окно, в котором надо ввести цену открытия, stop loss и take profit, а также размер сделки. В торговле на финансовых рынках управление капиталом необходимо для сохранения и приумножения первоначального депозита. Итак, когда вы хотите разместить ордер, вы, вероятно, задаетесь вопросом, насколько крупную сделку в
TradePanel MT5
Alfiya Fazylova
4.89 (112)
Trade Panel – это многофункциональный торговый помощник. Приложение содержит более 50 функций для ручной торговли, и позволяет автоматизировать большую часть торговых действий. Основные возможности утилиты: Работа с любым торговым инструментом (Forex, CFD, Futures и другие). Работа со всеми символами из одного окна терминала. Может управлять ордерами, открытыми с мобильного телефона. Создание до четырех рабочих списков с символами. Выделения символов в избранное. Быстрое переключение символа на
Local Trade Copier EA MT5
Juvenille Emperor Limited
5 (63)
Опыт экстремально быстрого копирования сделок с помощью Local Trade Copier EA MT5 . Благодаря простой установке в течение 1 минуты этот копировщик сделок позволяет вам копировать сделки между несколькими терминалами MetaTrader на одном компьютере с Windows или на Windows VPS с крайне быстрыми скоростями копирования менее 0.5 секунды. Независимо от того, новичок вы или профессиональный трейдер, Local Trade Copier EA MT5 предлагает широкий спектр опций, чтобы настроить его под ваши конкретные п
Trade Manager, который поможет вам быстро входить и выходить из сделок, автоматически рассчитывая риск. Включает функции, которые помогут предотвратить чрезмерную торговлю, торговлю из мести и эмоциональную торговлю. Сделками можно управлять автоматически, а показатели эффективности счета можно визуализировать в виде графика. Эти функции делают эту панель идеальной для всех трейдеров, занимающихся ручной торговлей, и помогают улучшить платформу MetaTrader 5. Многоязычная поддержка. Версия для МТ
The product will copy all telegram signal to MT5 ( which you are member) , also it can work as remote copier.  Easy to set up, copy order instant, can work with almost signal formats, image signal,  s upport to translate other language to English Work with all type of channel or group, even channel have "Restrict Saving Content", work with  multi channel, multi MT5 Work as remote copier: with signal have ticket number, it will copy exactly via ticket number. Support to backtest signal. How to s
Mentfx Mmanage mt5
Anton Jere Calmes
4.43 (7)
The added video will showcase all functionality, effectiveness, and uses of the trade manager. Drag and Drop Trade Manager. Draw your entry and have the tool calculate the rest. Advanced targeting and close portions of a trade directly available in tool (manage trades while you sleep). Market order or limit order on either side with factored spread. Just draw the entry, the tool does the rest. Hotkey setup to make it simple. Draw where you want to enter, and the stop loss, the tool calculates al
MT5 to Telegram Signal Provider — это простой в использовании полностью настраиваемый инструмент, который позволяет отправлять определённые сигналы в чат, канал или группу Telegram, превращая вашу учётную запись в провайдера сигналов . В отличие от большинства конкурирующих продуктов, он не использует импорт DLL. [ Демо ]   [ Руководство ] [ Версия MT4 ] [ Версия для Discord ] [ Канал в Telegram ] Настройка Доступно пошаговое руководство пользователя . Никаких знаний API Telegram не требуется
Adam FTMO MT5
Vyacheslav Izvarin
5 (1)
ADAM EA Special Version for FTMO Please use ShowInfo= false for backtesting ! Our 1st EA created using ChatGPT technology Trade only GOOD and checked PROP FIRMS  Default parameters for Challenge $100,000 Tested on EURUSD and GBPUSD only  Use 15MIN Time Frame Close all deals and Auto-trading  before Weekend at 12:00 GMT+3  Friday For Prop Firms MUST use special Protector  https://www.mql5.com/en/market/product/94362 Signal using ADAM  https://www.mql5.com/en/signals/2190554 --------------------
Trade copier MT5
Alfiya Fazylova
4.35 (26)
Trade Copier — это профессиональная утилита, предназначенная для копирования и синхронизации сделок между торговыми счетами. Копирование происходит от счета/терминала поставщика к счету/терминалу получателя, которые установлены на одном компьютере или vps. Перед покупкой вы можете протестировать демо-версию на демо-счете. Демо-версия здесь . Полная инструкция здесь . Основной функционал и преимущества: Русифицированный интерфейс, поддержку на русском языке. Поддерживает копирование МТ5 > МТ5, МТ
Копируйте сигналы из любого канала, участником которого вы являетесь (без необходимости использования токена бота или разрешений администратора, прямо на ваш MT5. Он был разработан с учетом потребностей пользователей и предлагает множество необходимых вам функций. Этот продукт представлен в простом в использовании и визуально привлекательном графическом интерфейсе. Настройте свои параметры и начните использовать продукт в течение нескольких минут! Руководство пользователя + Демо  |   Версия M
Самые продаваемые советники на рынке стоят очень дорого, и в один прекрасный день они внезапно исчезают. Это связано с тем, что одна стратегия не будет работать на рынке форекс все время. Наш продукт уникален среди всех других на MQL Marketplace, потому что наш советник имеет более 34 встроенных индикаторов, которые позволяют каждый раз добавлять больше стратегий. Вы строите свою стратегию и постоянно обновляете ее. Если одна стратегия не работает, просто постройте другую, используя только одног
-25% discount ($199 -> $149) Advanced trading tool: One click smart orders that execute under your conditions Developed by trader for trading community:  position size calculator (lot size), open position after price action, strategy builder, set and forget trading, mobile notifications... Risk Management -  Risk percentage position size calculator, gain percentage, target risk reward ratio, spread and commissions are included in calculations 7 Advanced order types  - Set and forget trading w
OrderManager MT5
Lukas Roth
4.88 (16)
Представляем   OrderManager : Революционный инструмент для MT5 Управляйте своими сделками как профессионал с новейшим инструментом Order Manager для MetaTrader 5. Разработанный с учетом простоты и удобства использования, Order Manager позволяет вам легко определять и визуализировать риски, связанные с каждой сделкой, что позволяет принимать обоснованные решения и оптимизировать вашу торговую стратегию. Для получения дополнительной информации о OrderManager, пожалуйста, обратитесь к руководству.
Bots Builder Pro MT5
Andrey Barinov
4.75 (4)
Это визуальный конструктор стратегий. Единственный в своем роде. Превратите свои торговые стратегии и идеи в советники, не написав ни одной строчки кода. Создавайте файлы исходного кода mql в несколько кликов и получайте полнофункциональных советников, готовых к реальной работе, тестеру стратегий и облачной оптимизации. Вариантов для тех, кто не имеет навыков программирования и не может создавать свои торговые решения на языке MQL, очень мало. Теперь с помощью Bots Builder Pro каждый может созд
Tired of complex order placement and manual calculations? Trade Dashboard is your solution. With its user-friendly interface, placing orders becomes effortless, by a single click, you can open trades, set stop loss and take profit levels, manage trade lot size, and calculate risk to reward ratios, allowing you to only focus on your strategy. Say goodbye to manual calculations and streamline your trading experience with Trade Dashboard. Download   demo version   right now. You can find   deta
UTM Manager — это интуитивно понятный и простой в использовании инструмент, предлагающий быстрое и эффективное исполнение сделок. Одной из выдающихся функций является режим «Игнорировать спред», который позволяет вам торговать по цене свечей, полностью игнорируя спреды (например, позволяет торговать парами с более высокими спредами на LTF, избегая выхода из сделок из-за спреда). Еще одним ключевым аспектом UTM Manager является его уникальный локальный копировщик сделок, позволяющий гибко запуска
Копируйте сигналы из любого канала, участником которого вы являетесь (в том числе частного и ограниченного), прямо на свой MT5. Этот инструмент был разработан с учетом потребностей пользователей и предлагает множество функций, необходимых для управления и мониторинга сделок. Этот продукт представлен в простом в использовании и визуально привлекательном графическом интерфейсе. Настройте свои параметры и начните использовать продукт в течение нескольких минут! Руководство пользователя + Демо  |
Grid Manual MT5
Alfiya Fazylova
4.83 (12)
Grid Manual — это торговая панель для работы с сеточными стратегиями. Утилита универсальная, имеет гибкие настройки и понятный интерфейс. Работает с сеткой ордеров не только в сторону усреднения убытков, но и в сторону наращивания прибыли. Трейдеру не нужно создавать и сопровождать сетку ордеров, это сделает утилита. Достаточно открыть ордер и Grid manual автоматически создаст ему сетку ордеров и будет сопровождать его до самого закрытия. Основные особенности и возможности утилиты: Сопровождает
Торговая панель для торговли в один клик.  Работа с позициями и ордерами!  Торговля с  графика  или  клавиатуры  . Используя нашу торговую панель, вы можете торговать в один клик с графика и совершать торговые операции в 30 раз быстрее, чем стандартное управление MetaTrader. Автоматические расчеты параметров и функций, которые облегчают жизнь трейдеру и помогают трейдеру вести торговую деятельность намного быстрее и удобнее. Графические подсказки и полная информация о торговых сделках на графике
Trade Assistant 38 in 1
Makarii Gubaydullin
4.87 (15)
Многофункциональная утилита: более 65 функций в едином интерфейсе, включая: калькулятор лота, индикатор Price Action, менеджер ордеров, рассчет R/R Демо веpсия  |   Инструкция  |   Версия для MT4 Утилита не работает в тестере стратегий: вы можете скачать демо версию ЗДЕСЬ , чтобы протестировать продукт перед покупкой. Напишите мне  если есть вопросы / идеи по улучшению / в случае найденного бага Упроситите и сделайте вашу торговлю быстрее, при этом расширяя стандартные возможности терминала.
Ultimate Trailing Stop EA MT5
BLAKE STEVEN RODGER
4.57 (7)
This EA Utility allows you to manage (with advanced filtering) unlimited open orders (manual or EA) with 16 trailing stop methods: fixed, percent, ATR Exit, Chandelier Exit, Moving Average, Candle High Low Exit, Bollinger Bands, Parabolic, Envelope, Fractal, Ichimoku Kijun-Sen, Alligator, Exit After X Minutes or Bars, RSI and Stochastic. The trailing stop can be either real or virtual, and you can exit fully or with a partial close percent on touch or bar close.  Moreover, you can add (overri
Hedge Ninja
Robert Mathias Bernt Larsson
Не забудьте присоединиться к нашему сообществу Discord на сайте www.Robertsfx.com , вы также можете купить советник на сайте robertsfx.com. ВЫИГРЫВАЙТЕ НЕЗАВИСИМО ОТ КАКОГО НАПРАВЛЕНИЯ ДВИЖЕТСЯ ЦЕНА Этот робот выигрывает независимо от того, в каком направлении движется цена, следуя изменяющемуся направлению в зависимости от того, в каком направлении движется цена. Это самый бесплатный способ торговли на сегодняшний день. Таким образом, вы выигрываете независимо от того, в каком направлении она
Take a Break MT5
Eric Emmrich
4.71 (14)
The most advanced news filter and drawdown limiter on MQL market NEW: Take a Break can be backtested against your account history! Check the " What's new " tab for details. Take a Break has evolved from a once simple news filter to a full-fledged account protection tool. It pauses any other EA during potentially unfavorable market conditions and will continue trading when the noise is over. Typical use cases: Stop trading during news/high volatility (+ close my trades before). Stop trading when
DrawDown Limiter
Haidar, Lionel Haj Ali
5 (17)
Drawdown Limiter EA You are in the right place if you were searching for Drawdown control, Drawdown limiter, Balance protection, Equity Protection or Daily Drawdown Limit related to Prop Firm, FTMO, or Funded account trading, or if you want to protect your trading account. Have you suffered from controlling your drawdown when trading funded accounts? This EA is meant for you. Prop firms usually set a rule called “Trader Daily Drawdown”, and if it is not respected, you are disqualified.  I am an
Советник Auto Trade Copier предназначен для копирования сделок на нескольких счетах/терминалах MetaTrader 4/MetaTrader 5 со 100% точностью. С помощью этого инструмента вы можете выступать как в роли поставщика (источник), так и получателя (назначение). Все торговые действия будут скопированы от поставщика к получателю без задержки. Ссылки: Если копирование производится через Интернет, посмотрите продукт Trade Copier Pro MT5 по ссылке: https://www.mql5.com/ru/market/product/5531 Если копирование
-25% discount ($149 -> $111) Everything for chart Technical Analysis indicator mt5 in one tool Draw your supply demand zone with rectangle and support resistance with trendline and get alerts to mobile phone or email alert -  Risk reward indicator mt5 Video tutorials, manuals, DEMO download   here .   Find contacts on my   profile . 1.   Extended rectangles and trendlines Object will be extended to the right edge of the chart when price will draw new candles on chart. This is rectangle extend
MT5 to Discord Signal Provider — это удобный, полностью настраиваемый инструмент, предназначенный для отправки торговых сигналов напрямую в Discord. Этот инструмент превращает ваш торговый счет в эффективного поставщика сигналов. Настройте формат сообщений под свой стиль! Для удобства выберите из предварительно разработанных шаблонов и решите, какие элементы сообщения включить или исключить. [ Демо ] [ Руководство ] [ Версия MT4] [ Версия Telegram ] Настройка Следуйте нашему подробному пользов
Riskless Pyramid Mt5
Snapdragon Systems Ltd
5 (2)
Introduction This powerful MT4 trade mangement EA offers a way potentially to aggressively multiply trade profits in a riskfree manner. Once a trade has been entered with a defined stoploss and take profit target then the EA will add three pyramid add-on trades in order to increase the overall level of profit. The user sets the total combined profit target to be gained if everything works out. This can be specified either as a multiple of the original trade profit or as a total dollar amount. Fo
Exp COPYLOT CLIENT for MT5
Vladislav Andruschenko
3.76 (17)
Trade copier for MT5 - копировщик позиций/СДЕЛОК/ордеров для МetaТrader 5  из МТ4/МТ5) Для копирования на терминал MetaTrader 5 между терминалами МТ5 - МТ5, МТ4 - МТ5  для версии COPYLOT MT5 ( или МТ4 - МТ4 МТ5 - МТ4 для версии COPYLOT MT4). Версия МT4 Полное описание +DEMO +PDF Как купить Как установить    Как получить файлы журналов   Как тестировать и оптимизировать    Все продукты от Expforex Вы также можете копировать сделки в терминал МТ4 (МТ4 - МТ4, МТ5 - МТ4):    COPYLOT CLIENT f
Другие продукты этого автора
50% off. Original price: $375 Reward Multiplier is a semi-automatic trade manager based on pyramid trading that opens additional orders with the running profit of your trades to maximize return exponentially without increasing the risk. Unlike other similar EAs, this tool shows potential profit/loss and reward to risk ratio before even entering the first trade! Download Demo here  (starting lot is fixed at 0.01) Guide + tips here MT4 version   here You only open the first order. When your trade
RSI divergence indicator finds divergences between price chart and   RSI   indicator and informs you with alerts (popup, mobile notification or email). Its main use is to find trend reversals in the chart. Always use the divergence indicators with other technical assets like support resistance zones, candlestick patterns and price action to have a higher possibility to find trend reversals. Three confirmation type for   RSI   divergences: RSI   line cross 50 level Price returns to previous H/L C
FREE
50% off. Original price: $375 Reward Multiplier is a semi-automatic trade manager based on pyramid trading that opens additional orders with the running profit of your trades to maximize return exponentially without increasing the risk. Unlike other similar EAs, this tool shows potential profit/loss and reward to risk ratio before even entering the first trade! Download Demo here  (starting lot is fixed at 0.01) Guide + tips here MT5 version   here You only open the first order. When your t
40% off. Original price: $50 Support and Resistance Dashboard for MT5 is a multi-timeframe and multi-symbol scanner and alert system that finds S/R zones and pivot points for all timeframes and symbols and alerts when price has interaction with them. If you are using support and resistance (or supply and demand) zones in your trading strategy, this dashboard and its alert and filtering system is a big time saver for you. Download demo version   (works on M4,M5,M6,M12,H3,H8 timeframes) Full desc
50% off. Original price: $60 RSI Divergence Scanner is a multi-timeframe and multi-symbol dashboard and alert that checks all timeframes and symbols to find regular and hidden divergences between price chart and RSI indicator. This divergence scanner is integrated with support and resistance zones so you can check the RSI divergences in the most important areas of the chart to find trend reversals in price chart. Download demo version   (works on M4,M5,M6,M12,H3,H8 timeframes) Full description
50% off. Original price: $60 Ichimoku Assistant is a multi-timeframe panel and alert system that scans all timeframes for multiple rules related to different ichimoku strategies. The Ichimoku indicator has 5 different lines, including Tenkan-sen, Kijun-sen, Senku Span A, Senku Span B and Chikou Span. This scanner checks the status of these lines compared to each other and gives alert based on your selected rules. If you are using ichimoku kinko hyo in your trading strategy, this scanner and its
40% off. Original price $50 ATR Scanner Pro is a multi symbol multi timeframe volatility scanner that monitors and analyzes Average True Range indicator value in up to 28 symbols and 9 timeframes in 3 modes : ATR value:  As a volatility dashboard it shows the ATR indicator value in all pairs and timeframes and signals when the ATR value reaches a maximum or minimum in a given duration. Short term ATR/Long term ATR ratio:  It shows ratio of 2 ATRs with different periods. It's useful in detecting
RSI divergence indicator finds divergences between price chart and RSI   indicator and informs you with alerts (popup, mobile notification or email). Its main use is to find trend reversals in the chart. Always use the divergence indicators with other technical assets like support resistance zones, candlestick patterns and price action to have a higher possibility to find trend reversals. Three confirmation type for RSI   divergences: RSI   line cross 50 level Price returns to previous H/L Creat
FREE
MACD divergence indicator finds divergences between price chart and MACD indicator and informs you with alerts (popup, mobile notification or email) . Its main use is to find trend reversals in the chart. Always use the divergence indicators with other technical assets like support resistance zones, candlestick patterns and price action to have a higher possibility to find trend reversals. Three confirmation type for MACD divergences: MACD line cross zero level Price returns to previous H/L Crea
FREE
50% off. Original price: $60 RSI Divergence Scanner is a multi-timeframe and multi-symbol dashboard and alert that checks all timeframes and symbols to find divergences between price chart and RSI indicator. This divergence scanner is integrated with support and resistance zones so you can check the RSI divergences in the most important areas of the chart to find trend reversals in the price chart. Download demo version   (works on M 1,M5,M30,W1 timeframes) Full description of scanner paramet
25% off. Original price: $40 Order Manager is a trade assistant with money manager that helps traders open, modify and close manual trades in a simple way to help them focus more on their market analysis and open orders with just a few clicks. Download Demo here  (It only works on demo accounts) Full guide   here MT4 version here Order Manager features: Works on all instruments such as currency pairs, CFD, metals, cryptocurrencies, etc. Proper money management with a built-in lot calculator
Ichimoku Trend Alert is the Ichimoku Kinko Hyo indicator with Alerts and signal filters. Ichimoku Trend Alert features: Optional check of Ichimoku cloud, Tenkan sen(Conversion Line), Kijun sen(Base Line), Senkou span A, Senkou span B, and Chikou span relative to price, and more. Popup, email, and phone notification alerts for selected symbols and timeframes. There are 9 classic Ichimoku trend filters you can enable/disable in settings: Price/Cloud Order:   Checks the price position relative
FREE
Moving Average Trend Alert is a triple MA indicator that helps traders to identify potential market trends based on 3 MAs alignment and crossover. Moving Average Trend Alert features: Customizable short-term, medium-term, and long-term MAs. Option to filter signals based on a minimum distance between moving averages to avoid premature MAs alignment. Optional Filter of signals with RSI indicator overbought/oversold levels. Optional Filter of signals with ADX indicator. Popup, email, and phone n
FREE
40% off. Original price: $50 Ichimoku Trend Finder is a multi symbol multi timeframe trend dashboard that helps traders to monitor and identify potential market trends from one chart. This panel scans the Ichimoku Kinko Hyo indicator in 28 configurable instruments and 9 timeframes for classic Ichimoku trend signals  with a deep scan feature to scan all market watch symbols (up to 1000 instruments!).    Download Demo here  (Scans only M1 and M5) Settings description   here MT5 version   here
50% off. Original price: $60 MACD Divergence Scanner is a multi-timeframe and multi-symbol dashboard and alert that checks all timeframes and symbols to find regular and hidden divergences between price chart and MACD indicator. This divergence scanner is integrated with support and resistance zones so you can check the MACD divergences in the most important areas of the chart to find trend reversals in the price chart. Download demo version   (works on M 1,M5,M30,W1   timeframes) Full descript
50% off. Original price: $60 Candlestick Pattern Scanner is a multi-timeframe and multi-symbol dashboard and alert system that checks all timeframes and currency pairs for different candlestick patterns that are formed in them. Scanner is integrated with support and resistance zones so you can check the candlestick patterns in the most important areas of the chart to find breakout and reversal patterns in the price chart. Download demo version   (works on M1,M5,M30,W1 timeframes) Read the full
40% off. Original price: $50 Support and Resistance Dashboard for MT4 is a multi-timeframe and multi-symbol scanner and alert system that finds S/R zones and pivot points for all timeframes and symbols and alerts when price has interaction with them. If you are using support and resistance (or supply and demand) zones in your trading strategy, this dashboard and its alert and filtering system is a big time saver for you. Download demo version   (works on M 1,M5,M30,W1   timeframes) Full descrip
50% off. Original price: $60 Triangle Finder is a multi symbol multi timeframe dashboard that finds symmetrical triangle pattern in 28 symbols and 9 timeframes with a deep scan feature to scan all market watch symbols (up to 1000 instruments!). Download Demo here  (Scans only M1, M5 and M10) Settings description   here MT4 version   here Triangle Finder features: Realtime monitoring of 28 customizable instruments and 9 timeframes at the same time. Deep scan mode to scan all market watch sym
40% off. Original price: $50 Moving Average Trend Scanner is a multi symbol multi timeframe triple MA crossover dashboard that helps traders to monitor, and identify potential market trends from one chart. This panel scans 3 moving averages in up to 28 configurable instruments and 9 timeframes for triple moving average alignment and moving average crossover  with a deep scan feature to scan all market watch symbols (up to 1000 instruments!). Download Demo here  (Scans only M1 and M5) Settings
MACD divergence indicator finds divergences between price chart and MACD indicator and informs you with alerts (popup, mobile notification or email). Its main use is to find trend reversals in the chart. Always use the divergence indicators with other technical assets like support resistance zones, candlestick patterns and price action to have a higher possibility to find trend reversals. Three confirmation type for MACD divergences: MACD line cross zero level Price returns to previous H/L Creat
FREE
Ichimoku Trend Alert is the Ichimoku Kinko Hyo indicator with Alerts and signal filters. Ichimoku Trend Alert features: Optional check of Ichimoku cloud, Tenkan sen(Conversion Line), Kijun sen(Base Line), Senkou span A, Senkou span B, and Chikou span relative to price, and more. Popup, email, and phone notification alerts for selected symbols and timeframes. There are 9 classic Ichimoku trend filters you can enable/disable in settings: Price/Cloud Order: Checks the price position relative to
FREE
Moving Average Trend Alert is a triple MA indicator that helps traders to identify potential market trends based on 3 MAs alignment and crossover. Moving Average Trend Alert features: Customizable short-term, medium-term, and long-term MAs. Option to filter signals based on a minimum distance between moving averages to avoid premature MAs alignment. Optional Filter of signals with RSI indicator overbought/oversold levels. Optional Filter of signals with ADX indicator. Popup, email, and phone n
FREE
50% off. Original price: $60 Candlestick Pattern Scanner is a multi-timeframe and multi-symbol dashboard and alert system that checks all timeframes and currency pairs for different candlestick patterns that are formed in them. Scanner is integrated   with support and resistance zones so you can check the candlestick patterns in most important areas of the chart to find breakout and reversal patterns in the price chart. Download demo version   (works on M4,M5,M6,M12,H3,H8 timeframes) Read the f
40% off. Original price: $50 Moving Average Trend Scanner is a multi symbol multi timeframe triple MA crossover dashboard that helps traders to monitor, and identify potential market trends from one chart. This panel scans 3 moving averages in up to 28 configurable instruments and 9 timeframes for triple moving average alignment and moving average crossover with a deep scan feature to scan all market watch symbols (up to 1000 instruments!).   Download Demo   here   (Scans only M1 and M6) Sett
Reward Multiplier is a semi-automatic trade manager based on pyramid trading that opens additional orders with the running profit of your trades to maximize return exponentially without increasing the risk.Unlike other similar EAs, this tool shows potential profit/loss and reward to risk ratio before even entering the first trade! Download full version here  ( In the mini version. Starting lot is fixed at 0.01 (or minimum allowed lot size ) Guide + tips here MT4 version   here You only open the
FREE
40% off. Original price: $50 Advanced Bollinger Bands Scanner is a multi symbol multi timeframe Bollinger bands dashboard that monitors and analyzes the Bollinger Bands indicator from one chart. This panel monitors the Bollinger bands indicator in up to 28 configurable instruments and 9 timeframes for price overbought/oversold, price consolidation (Bollinger bands squeeze), and consolidation breakout (squeeze break)  with a deep scan feature to scan all market watch symbols (up to 1000 instrume
50% off. Original price: $60 Support and Resistance zones indicator for MT5 is a multi-timeframe panel and alert that finds support and resistance zones and pivot points for all timeframes of MetaTrader 5 and gives alert when price has interaction with them. Download demo version (works on GBPUSD, EURJPY and NZDUSD symbols) Read the full description of scanner parameters in the blog page . Many unique features in one indicator: Integrating support and resistance zones and pivot points in one in
50% off. Original price: $60 Triangle Finder is a multi symbol multi timeframe dashboard that monitors and finds symmetrical triangle pattern in 28 symbols and 9 timeframes with a deep scan feature to scan all market watch symbols (up to 1000 instruments!). Download Demo here  (Scans only M1 and M5) Settings description   here MT5 version   here Triangle Finder features: Realtime monitoring of 28 customizable instruments and 9 timeframes at the same time. Deep scan mode to scan all market w
40% off. Original price: $50 Ichimoku Trend Finder is a multi symbol multi timeframe trend dashboard that helps traders to monitor and identify potential market trends from one chart. This panel scans the Ichimoku Kinko Hyo indicator in 28 configurable instruments and 9 timeframes for classic Ichimoku trend signals with a deep scan feature to scan all market watch symbols (up to 1000 instruments!).     Download Demo here  (Scans only M1 and M6) Settings description   here MT4 version   here
Reward Multiplier is a semi-automatic trade manager based on pyramid trading that opens additional orders with the running profit of your trades to maximize return exponentially without increasing the risk. Unlike other similar EAs, this tool shows potential profit/loss and reward to risk ratio before even entering the first trade! Download full version here  ( In the mini version. Starting lot is fixed at 0.01 (or minimum allowed lot size ) Guide + tips here MT5 version   here You only open the
FREE
Фильтр:
boga1
171
boga1 2024.04.04 12:43 
 

I don't know why there isn't much reviews on this great scanner. This is the best Divergence scanner on this platform. The signals on the H1 and H4 are awesome. I highly recommend for anyone trading

Ответ на отзыв
Версия 5.6 2023.11.02
+ The option “Mark divergences that happen after a long trend” added to the dashboard (for “Check trend length for regular divergences” parameter).
+ Improvement in detecting divergences with “Stochastic indicator” confirmation type.
+ Minor bug fixes and improvements.
Версия 5.5 2023.10.16
+ "Stochastic indicator" added for confirming the divergences, now you can choose to receive alert when the stochastic indicator lines cross each other. Also, you can set that the crossing must be in the overbought/oversold levels of the stochastic indicator.
+ Average body filter (for 2-bar and 3-bar patterns) and average height filter (for 1-bar patterns) parameters added to the dashboard, by enabling these filters you can set the dashboard to show only divergences that confirm by big size candlestick patterns.
+ Now you can use dashboard signals in your EAs. If you set the dashboard to show the divergences in new charts, then you can use the divergence information embedded in the Arrow name in your EA.
+ Now you can set the dashboard to mark the divergences that happen after a long trend (with L letter).
Версия 5.3 2023.09.19
+ Candlestick patterns (10 patterns) added to "Confirmation type" parameter, with this option divergence will be confirmed if a candlestick pattern forms after it.
+ Now you can filter divergences with 2 Moving Average indicators from same or upper timeframes, you can set timeframe and period of these MAs separately for each timeframe of the dashboard.
+ You can reverse the Moving Average filters and find divergences that are in the opposite direction of the MA, also you can set for each filter to be applied to which type of divergence (regular, hidden or both), also the filters can be reversed separately.
+ An option added to the dashboard to not remove the failed divergences from the dashboard, it is useful when you want to practice the divergence trading.
+ Now you can choose what information to see on the dashboard cells: “Divergence type, candles passed” or “Divergence type, divergence direction, candles passed” or “Compact detailed info”.
+ A parameter added to the scanner to use a second ZigZag indicator for detecting more divergences. Enabling this parameter slows down the scanner, so use it if you are loading a limited number of symbols and timeframes in the dashboard.
Версия 4.2 2023.03.24
Fixed a bug in changing the cell colors for S/R zones in the previous update.
Версия 4.1 2023.02.23
+ Added Moving Average indicator filter, you can now set the scanner to find divergences based on the direction of the moving average and/or the position of the divergence relative to the MA.
- Fixed a bug in loading symbols from the symbol list when the symbol names have lowercase letters.
Версия 4.0 2023.02.22
+ Now you can set the scanner to only find divergences that happen at the end of a long trend.
+ Two new confirmation type ("Changing the color of Heiken Ashi indicator" and "Strong Reversing Candle") added to the scanner and "New zigzag leg" confirmation type removed from the scanner.
+ Two filters (and their parameters) added for detecting the strong reversing candle.
+ You can choose to show the divergence lines and arrow on the opened charts with custom chart template (in addition to the default chart template).
+ Minor improvements and bug fixes.
Версия 3.0 2023.01.14
+ "Max. divergence pullback percent (Fibonacci retracement)" option added to the scanner, with this option you can set the maximum acceptable percent for the last pullback in the trend.
+ "Min. length ratio (last wave/previous wave)" options added to the scanner, with this parameter you can define the minimum acceptable length of the last wave of the trend compared to the length of the wave before it.
+ "Max. length ratio (last wave/previous wave)" options added to the scanner, with this parameter you can define the maximum acceptable length of the last wave of the trend compared to the length of the wave before it.
+ "Min. time ratio (last wave/previous wave)" parameter added to the scanner, with this parameter you can define the minimum acceptable duration of the last wave of the trend compared to the duration of the wave before it.
+ "Max. time ratio (last wave/previous wave)" parameter added to the scanner, with this parameter you can define the maximum acceptable duration of the last wave of the trend compared to the duration of the wave before it.
+ Improving the dashboard appearance.
- Fixing a bug where sometimes the dashboard didn't send immediate alert for new divergences.
Версия 2.9 2022.12.20
+ "Min. divergence pullback percent (Fibonacci retracement)" option added to the scanner, this option helps to filter out divergences caused by small pullbacks in the trend.
+ The direction of the arrows in the dashboard cells reversed to show the direction of the price legs that create the divergence (up arrows for bearish divergence and down arrows for bullish divergence).
+ "Cell background color" option added for the dashboard.
Версия 2.8 2022.12.08
+ You can select for each symbol to alert only bullish or bearish divergences by clicking on its cell on dashboard.
+ Panel cells show the strength of divergences (weak, medium, strong).
+ You can see divergence lines for both price and RSI indicator when checking divergences in new charts.
+ You can see nearest support and resistance zones when checking divergences in new charts to see the price distance to S/R levels.
Версия 2.7 2022.10.29
+ A parameter added to enabling alerts for selected timeframes on startup of dashboard.
Версия 2.6 2022.09.29
+ Added an option to receive alert immediately after divergence detected by scanner (before any confirmation, this may create repeated alerts).
+ Now you can split the symbols into 3 columns for showing more symbols in the dashboard on a single chart.
Версия 2.5 2022.09.10
Added a parameter to automatically open divergence chart after detecting the divergence, without clicking on dashboard cell.
Версия 2.3 2022.08.17
+ A new confirmation type added: MACD Cross Signal Line.
+ A parameter added to load a custom chart template when clicking on the dashboard cells.
! Fixed a bug in showing the zones when MetaTrader starts up.
Версия 2.2 2022.06.28
Fixed a bug in splitting symbols into 2 columns.
Версия 2.1 2022.06.27
“Split symbols in 2 columns” option added to parameters, now you can show more symbols in dashboard on a single chart.
Версия 2.0 2022.05.21
+ Two confirmation type added to scanner (MACD cross zero level, Price Returns to Previous H/L).
+ The panel shows that how many candles passed since the divergence occurred.
+ The panel shows the number of trend waves (2 or 3 and more) that leads to the divergence.
+ The panel shows current divergences at startup.
+ Now you can choose to receive alerts for bullish and bearish divergences separately.
- Input parameters modified and rearranged.
Версия 1.1 2022.04.03
- Fixed a problem in loading the dashboard on the chart.