• Обзор
  • Отзывы
  • Обсуждение

Fourteen plus nine TD Sequential

Fourteen plus nine

What is it for?

Applying Tom DeMark’s TD Sequential serves the purpose of identifying a price point where an uptrend or a downtrend exhausts itself and reverses.
.
What are the main components of TD Sequential?
TD Sequential has two parts – TD Setup and TD Countdown. The first phase of TD Sequential starts with a TD Setup and is completed with a 9 count. When the 9 count is completed, it is at that point, a price pause, price pullback, or reversal is likely. It is also at that point where TD Sequential starts the second phase with TD Countdown and is completed with a 13 count. When the 13 count is recorded, it is at that point, a price pause, price pullback, or a reversal is likely.
.
Just 9 and 13. Is it really that simple?
Absolutely not. Other DeMark indicators and other technical analysis indicators should align with TD Sequential’s ability to pinpoint potential reversals. For example, if a leading indicator identifies a condition for a market reversal is likely in the near future, the job of TD Sequential is to provide the “when” for the reversal is likely to take place.
.
What is TD Buy Setup, TD Sell Setup, TD Buy Countdown, and TD Sell Countdown?
TD Buy Setup is the name for a TD Setup when the DeMark counts are recorded as prices are trending lower. Conversely, TD Sell Setup is the name for a TD Setup when the DeMark counts are recorded as prices are trending higher. The same goes for TD Countdown. A TD Buy Countdown is the name for TD Countdown when the DeMark counts are recorded as prices are trending lower and a TD Sell Countdown is the name of TD Countdown when the DeMark counts are trending higher.
.
Are the rules of TD Sequential flexible?
Yes. There are many variations floating out there and modifications and filters can be experimented with.
.
Below are four visual examples in describing the components of TD Sequential.
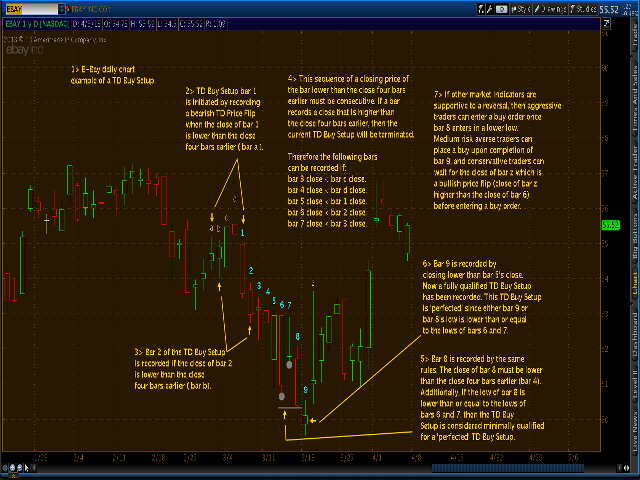
TD Buy Setup for  Ebay (EBAY)
TD Buy Countdown for  Zynga (ZNGA)
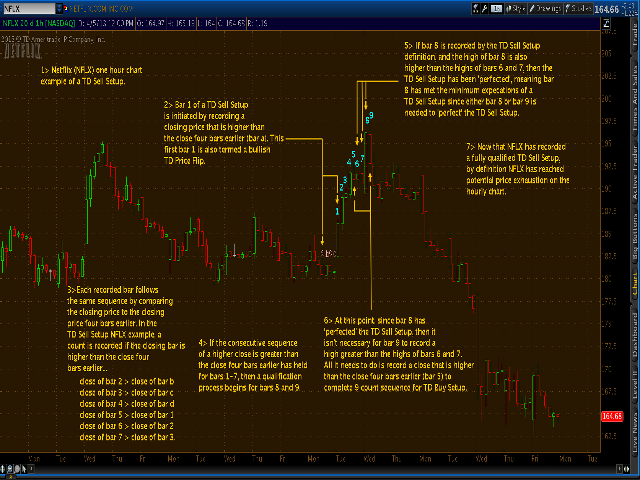
TD Sell Setup for  Netflix (NFLX)
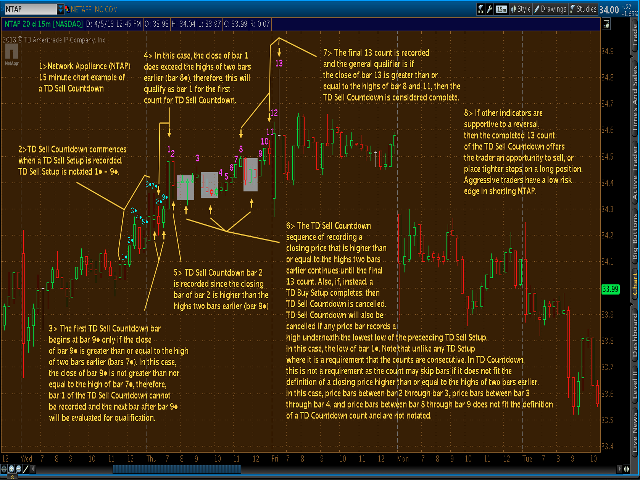
TD Sell Countdown for  Network Appliance (NTAP)
The written explanation of each example is numbered in order.
Рекомендуем также
Это трендовый индикатор без перерисовки Разработан вместо стратегии бля бинарках опционов (по цвету свечи мартингейл) Так же хорошо работает в торговле на рынке форекс Когда открывать сделки ( бинарные опционы ) Сигнал появится в месте с свечой сигналит на текущую свечу  Открывать сделку стоит на одну свечу текущего таймфрейма рекомендуется м1 и М5 При появлении синей точки открываем сделку вверх При появлении красной точки открываем сделку в низ. Как открывать сделки на Форекс. При полу
1 000 USD
"Тренд - друг трейдера" . Это одна из самых известных пословиц в трейдинге, потому что правильное определение тренда может помочь заработать. Однако проще сказать о торговле по тренду, чем сделать, потому что многие индикаторы основаны на развороте цены, а не на анализе тренда. Они не очень эффективны при определении периодов тренда или в определении того, сохранится ли этот тренд. Мы разработали индикатор Trendiness Index , чтобы попытаться решить эту проблему. Индикатор определяет силу и напра
49 USD
Daily Candle Predictor - это индикатор, который предсказывает цену закрытия свечи. Прежде всего индикатор предназначен для использования на графиках D1. Данный индикатор подходит как для традиционной форекс торговли, так и для торговли бинарными опционами. Индикатор может использоваться как самостоятельная торговая система, так может выступать в качестве дополнения к вашей уже имеющейся торговой системе. Данный индикатор производит анализ текущей свечи, рассчитывая определенные факторы силы внут
65 USD
Master scalping M1 -инновационный индикатор, использующий алгоритм для быстрого и точного определения тренда.Индикатор рассчитывает время открытия и закрытия позиций, алгоритмы индикатора позволяют находить идеальные моменты для входа в сделку (покупки или продажи актива), повышающие успешность сделок у большинства трейдеров. Преимущества индикатора: Прост в использовании, не перегружает график не нужной информацией. Возможность использования  как фильтр для любой стратегии. Работает на рынке
30 USD
Advanced Trend Regime
Shellard Securities (Pty) Ltd
The indicator has been designed to function on any time-frame and any pair.   This regime filter will help the trader better evaluate whether the current market is trending, and in which direction. It quickly reacts to changes in market dynamics using a series of advanced calculations. The user is able to select whether the calculation remains standard, or if a further filter constraint is added to the calculation.   A Yellow moving average of the signal has been included for the trader to smoot
50 USD
The Th3Eng PipFinite indicator is based on a very excellent analysis of the right trend direction with perfect custom algorithms. It show the true direction and the best point to start trading. With StopLoss point and Three Take Profit points. Also it show the right pivot of the price and small points to order to replace the dynamic support and resistance channel, Which surrounds the price. And Finally it draws a very helpful Box on the left side on the chart includes (take profits and Stop loss
89 USD
Tunafish EA MT4
Ismaele Daniele Lodetti
Tunafish EA is the most efficient EA on my profile. I spent a lot of time and effort to make this software sophisticated with possibilities of high potential returns while keeping the drawdown below 25%. The algorithms of the robot provide investors of any level of training with an investment opportunity that is both safe and aggressive. Tunafish EA imitating the work of the brain, capable of learning and adapting to changing conditions and predicting situations. When applied to trading in fina
69 USD
Индикатор Point61 - результат многолетнего наблюдения за поведением цены валютных пар и металлов. Не секрет, что в моменты неопределенности трейдеры ищут возможные уровни поддержки и сопротивления - точки, где цена должна остановить движение. В этих точках возможны 2 сценария: 1. Разворот (коррекция) в обратную сторону; 2. Пробой для продолжения движения. Очень часто эти точки используются для установки стоп-ордеров - ТейкПрофит или СтопЛосс. И важно определять эти точки для максимизации прибыли
249 USD
Chart Patterns Detect 15 patterns (Ascending Triangle, Descending Triangle, Rising Wedge, Falling Wedge, Bullish Flag, Bearish Flag, Bullish Rectangle, Bearish Rectangle Symmetrical triangle, Head and Shoulders, Inverted Head and Shoulders, Triple top, Triple Bottom, Double Top, Double Bottom) Use historical data to calculate the probability of each pattern to succeed (possibility to filter notification according to the chance of success) gives graphic indication about the invalidation level and
58 USD
Power Renko is an indicator which plots Renko bricks underneath the chart using a histogram. You can select the brick size and the timeframe of the Renko bricks as well as whether or not to use the close price or the high/low price of the candles. Renko bricks are based on price alone, not time, therefor the Renko bricks will not be aligned with the chart's time. They are extremely useful for trend trading and many different strategies can be formed from them. Buffers are provided allowing you t
30 USD
Индикаторы [ZhiBiCCI] подходят для всех циклов использования, а также подходят для всех разновидностей рынка. [ZhiBiCCI] Зеленая сплошная линия - разворот бычьей дивергенции. Зеленая пунктирная линия - классическая бычья дивергенция. [ZhiBiCCI] Сплошная линия к красному - обратная медвежья дивергенция. Красная пунктирная линия - классическая медвежья дивергенция. [ZhiBiCCI] можно установить в параметрах (Предупреждение, Отправить почту, Отправить уведомление), установить на (true) для отпр
58 USD
Super Gator
Agustinus Biotamalo Lumbantoruan
This indi shows the following 1. Supertrend 2. Alligator (Not a regular alligator) 3. ZigZag 4. Moving Average 5. Trend Continuation/Mini correction Signal (plotted in X) (See screenshots in green background color 6. Early Signal Detection (See screenshots in green background color) You may treat Alligator as the lagging indicator The leading indicator is the supertrend. The zig zag is based on the leading indicator where it gets plotted when the leading indicator got broken to the opposite.
150 USD
PipFinite Trend PRO
Karlo Wilson Vendiola
4.9 (2759)
Стратегия пробоя для торговли по тренду, фильтрация и все необходимые функции, встроенные в один инструмент! Интеллектуальный алгоритм индикатора Trend Pro с точностью определяет тренд, отфильтровывает рыночный шум и генерирует входные сигналы и уровни выхода. Новые функции с расширенными правилами статистического расчета улучшают общую производительность этого индикатора. Важная информация Для максимального использования потенциала Trend Pro прочитайте полное описание www.mql5.com/en/blogs/
98 USD
Trade with Gann on your side!! MASTER CIRCLE 360 CIRCLE CHART, originally created by Gann admitted that this is “The Mother of all charts”. It is one of the last studies that this great trader left for us. The numeric tab le is apparently quite simple like all the tables and is based on square numbers, the SQUARE OF 12 and is by evolution, one of the most important square numbers. Here we can find CYCLE, PRICE AND TIME thanks to angles and grades, to show past and future support and resistance.
149.99 USD
Are you tired of the uncertainty that arises when your orders fail to stop at a specific line due to the spread? Look no further! Introducing our  indicator that plots candlesticks based on the Ask price instead of the traditional bid-based chart commonly used in MQL4. With this indicator, you can say goodbye to the frustrations caused by the bid-based chart, as it provides you with a more accurate representation of market movements. By utilizing the Ask price, which represents the price at whic
80 USD
TPSpro TREND PRO   -   про версия индикатора  TPSproTREND ,  который  автоматически анализирует рынок и предоставляет информацию о тренде.    Индикатор легок в использовании. Э то отличный инструмент для новичков и профессионалов.  Использовать как минимум с двумя таймфреймами или с любыми уровнями (можно использовать уровни экстремумов индикатора) Telegram-канал TPSPROTRADING Что добавлено/модифицировано: Прорисовка прямоугольников отката после смены тренда /тенденции. Прорисовка пря
69 USD
Суть данного индикатора - анализ и предсказание котировок с помощью преобразования Фурье. Индикатор раскладывает ряд цен на гармоники и вычисляет их продукт на следующих барах. Вы можете использовать индикатор как самостоятельный продукт, однако для улучшения качества предсказания создан другой, родственный индикатор -  FreqoMaster  - который вызывает FreqoMeterForecast в качестве движка и объединяет результаты работы нескольких экземпляров FreqoMeterForecast для различных частотных диапазонов.
30 USD
Tочность правильных прогнозов  дo 83  % ! Данный индикатор тестировался на реальном графике в реальной торговле вся статистика об этом индикаторе с реальных торгов на рынке по данному индикатору 3 месяца велась торговля по нашей статистике получилось  дo 83  %   правильных прогнозов торговля велась на usd/jpy на таймфрейме m30 !  По скриншотам можете увидеть качество и количество сигналов данного инструмента если возникнут какие либо вопросы обращайтесь в личные сообщения или в обсуждениях под 
100 USD
Insider Scalper Binary   этот инструмент создан для торговли бинарными опционами на короткие вpеменые промижутки. заключить сделку стoит в момент получения сигнала и только на 1 свечу если это м1 то только на минуту и так в соответствии с таймфреймом. точность данного инструмента составляет oколо до 80% для лучших результатов нужно подбирать хорошо волотильные графики.... рекомендованые валютные пары  eur|usd, usd|jpy.... индикатор уже настроен вам остается только добавить его на график и торгов
103 USD
Скальпинговый форекс индикатор, который не перерисовывает свои стрелки. Он лучше всего работает на таймфреймах M5, M15, M30, H1. Настройки по умолчанию стоят для таймфрейма M5. На картинке которую мы разместили ниже пример работы на графике H1 со значением параметра "period=0.35". Ві можете скачать демо версию и сами протестировать его работу. Теперь мы почти во всех своих скальпинговых стратегия применяем сигналы этого индикатора. По нашим рассчетам точность его сигналов примерно 95% в зависимо
149 USD
Noize Absorption Index - is the manual trading system that measures the difference of pressure between bears forces and bulls forces. Green line - is a noize free index that showing curent situation. Zero value of index shows totally choppy/flat market.Values above zero level shows how powerfull bullish wave is and values below zero measures bearish forces.Up arrow appears on bearish market when it's ready to reverse, dn arrow appears on weak bullish market, as a result of reverse expectation. S
199 USD
Trend Trading - это индикатор, предназначенный для получения максимальной прибыли от трендов, происходящих на рынке, путем определения времени отката и прорыва. Он находит торговые возможности, анализируя, что делает цена во время установленных тенденций. [ Руководство по установке | Руководство по обновлению | Устранение неполадок | FAQ | Все продукты ] Торгуйте на финансовых рынках с уверенностью и эффективностью Прибыль от устоявшихся тенденций без проволочек Признать прибыльные откаты,
175 USD
The Stepping Trend Indicator     The Steppi ng Trend indicator uses the  average true range  (ATR indicator) in its calculation. This gives you control to set your own average true range period, I set the Default as 10.   Indicator Details. Green Arrow Up: This means you are at the starting point of a new bullish trend, it’s time to buy.   Red  Arrow  Down : This means you are at the starting point of a new  bearish  trend, it’ s time to sell .   What if you miss the Arrow Signal?   No
200 USD
Blahtech VWAP
Blahtech Limited
5 (1)
Blahtech VWAP - Volume Weighted Average Price (VWAP) is the ratio of price to total volume. It provides an average price over a specified time interval.  Links [  Install  |  Update  |  Documentation   ] Feature Highlights Configurable VWAP Line Sessions, intervals, anchored or continuous Previous day settlement line Standard Deviation bands Alerts at bar close or real time Automatic Broker or Tick volumes Significantly reduced CPU usage Input Parameters Expert Advisor Mode  - Reserved for
49 USD
For sure, this indicator has become very popular amongst traders. Through coding this indicator will give you the most accurate levels possible for your trading analysis. We have also added in the ability for you to receive alerts when the price breaks above or below a Support or Resistance lines! HOW TO USE The red rectangles represent your resistance/supply zone. The green rectangles represent your support/demand zone.  BONUS FEATURES We coded this indicator with the ability to switch between
197 USD
Суть данного индикатора - анализ и предсказание котировок с помощью преобразования Фурье. Индикатор раскладывает ряд цен на гармоники и вычисляет их продукт на следующих барах. Индикатор выводит на истории ценовые метки, обозначающие размах цен в прошлом, а также ценовые метки с предполагаемым движением в будущем. Также прогнозируемое решение о покупке или продаже и размер take profit указывается в текстовой метке в окне индикатора. Индикатор использует в качестве "движка" для расчетов другой ин
75 USD
Forex Gump
Andrey Kozak
2.83 (6)
Forex Gump - это полностью готовая полуавтоматическая торговая система. В виде стрелок на экран выводятся сигналы для открытия и закрытия сделок. Все, что вам нужно, это следовать указаниям индикатора. Когда индикатор показывает синюю стрелку, Вам нужно открывать ордер на покупку. Когда индикатор показывает красную стрелку, нужно открывать ордер на продажу. Закрываем ордера когда индикатор рисует желтый крестик. Для того, чтобы получить максимально эффективный результат, рекомендуем использовать
147 USD
The Chaikin Oscillator is a technical indicator developed by Marc Chaikin that combines price and volume data to measure the accumulation and distribution of a financial instrument. It aims to identify potential buying and selling opportunities in the market. The Chaikin Oscillator is calculated by subtracting a 10-day exponential moving average of the Accumulation Distribution Line (ADL) from a 3-day exponential moving average of the ADL. Here's how to use the Chaikin Oscillator indicator in tr
250 USD
Gvs Undefeated Trend   indicator is designed for trend and signal trading. This indicator generates trend signals.  It uses many algorithms and indicators to generate this signal. It tries to generate a signal from the points with the highest trend potential. This indicator is a complete trading product. This indicator does not need any additional indicators.  You can only trade with this indicator. The generated signals are displayed on the graphical screen.  Thanks to the alert features you ca
50 USD
Индикатор отображает на графике данные стохастик-осцилятора более старшего временного интервала. Основная и сигнальная линии отображаются в дополнительном окне. Ступенчатая характеристика не сглажена. Индикатор удобен для отработки "ручных" стратегий форекс-торговли, использующих данные от нескольких экранов с различными временными интервалами одного инструмента. В индикаторе используются настройки, аналогичные стандартному и выпадающий список для выбора тайм-фрейма. Параметры индикатора TimeF
30 USD
С этим продуктом покупают
Ultimate Sniper Dashboard
Hispraise Chinedum Abraham
4.65 (23)
Скидка $299! Цены могут вырасти в будущем! Читайте описание ниже! Лучшая система ввода для Ultimate Sniper Dashboard: ПРЕДЕЛЬНЫЕ ДИНАМИЧЕСКИЕ УРОВНИ. (Пожалуйста, проверьте мои продукты) Ultimate Sniper Dashboard работает ТОЛЬКО на реальных рынках из-за ограничений мультивалютного тестирования MT4. Представляем вам Ultimate-Sniper Dashboard! Наша самая лучшая панель, которая содержит HA-Sniper, MA-Sniper и множество специальных режимов. Ultimate Sniper Dashboard - это абсолютный зверь!
299 USD
А. Что такое A2SR?   * Это опережающий технический индикатор (без перерисовки, без запаздывания) . -- Учебники : -- на https://www.mql5.com/ru/blogs/post/734748/page4#comment_16532516   -- и https://www.mql5.com/ru/users/yohana/blog A2SR имеет особую технику определения уровней Поддержки (спроса) и Сопротивления (предложения). В отличие от обычного способа, который мы видели в сети, A2SR имеет оригинальную концепцию определения фактических уровней SR. Оригинальная техника не была взята из Инте
386 USD
Ваш успех как трейдера зависит от умения определять состояния перекупленности и перепроданности валюты или символа. То есть их силу или слабость. Именно этот подход и лежит в основе торговли на рынке Forex. Сделать это быстро и просто самому было бы практически невозможно, не будь индикатора Quantum Currency Strength - слишком много валют и символов. Вам определенно понадобится помощь! Индикатор Quantum Currency Strength был создан с единственной целью: дать вам глобальную картину по восьми осно
279 USD
THEQ Volumen
Luis Alberto Vazquez Carpio
5 (1)
THEQ Volume отображает точный осциллятор громкости. Его можно использовать для торговли в соответствии с тенденциями или возможными изменениями тренда. THEQ Volume также включает в себя стрелки объема THEQ, индикатор с сигналами и предупреждениями, а также советник THEQ Volume EA для реального / демонстрационного использования, тестирования и оптимизации или создания собственной стратегии. Дополнительный индикатор и советник-робот отправляются отдельно после оплаты. THEQ Volume не перерисовывает
495 USD
Этот индикатор астрономии для платформы MT4 выполняет множество функций с использованием сложных алгоритмов для выполнения собственных вычислений, которые настолько точны. Индикатор имеет панель, которая предоставляет астрономическую информацию, такую как гео/гелиоцентрические координаты планет, расстояние между Солнцем/Землей, величину, угловое расстояние, созвездие, эклиптические координаты, экваториальные координаты и горизонтальные координаты в зависимости от вертикальной линии, которую созд
600 USD
Robot Choppiness
Diego Mauricio Padilla Mendez
5 (1)
Робот Choppines загружается в качестве индикатора в папку индикаторов MT4. Рекомендуется использовать таймфрейм 5-минутной свечи, рекомендуемое время экспирации робота 5 минут. Робота можно настроить на отправку сигналов на платформы MT2, MX2, PRICEPRO. Для отправки сигналов необходимо использовать программу-коннектор платформы, с которой вы хотите работать. Для установки в коннектор выполните следующую процедуру (прилагается изображение, описывающее конфигурацию с коннектором платформы М
399 USD
Urgent reminder> Only 15 copies remaining for the price to double on all renting options. Get your copy Today! Introduction Dear Traders, I am always working to come up with tools that may help you to become a better trader and investor. Due to my experience in trading and market analysis and trading software design and development, I am glad to introduce to you my other tool called " Amazing Entries Indicator ". The Indicator is designed in a way that it combines different strategy to provide
1 500 USD
Это осциляратор с фильтром по уровням поддержки и сопровождения данный инструмент создан для бинарных опционов  он очень прост в использовании  Имеет очень хорошие показатели правильных сделок 80-90% ( на этом и обоснована стоимость) Сигналы Стрелка красного цвета направленая в низ сигнал на понижение Стрелка синего цвета направленая в верх сигнал на повышение Рекомендуемое время эксплуатации: 1-2 свечи Таймфрейм: любой  Символ для торговли: Любой Сесия: Любая Торговать во время выхода новостей
1 338 USD
Currently switched to the 4 hour chart - but use other time frames for confirmation. :-)  I change my main time frame based on the market movement at the time. The Hurricane Forex Indicator is a multi time frame indicator that includes such things as Trade Notifications, Trade Calculator, Momentum Indicator, risk reward and much more. We have a free Trade room for our users as well. Please check out the video for full details of how this indicator works as it has over 15 years worth of developme
599 USD
www.tradeightrading.com The tool identifies the real movement that the forex market uses, with real mathematical calculations based on the price changes. Tradeight execution is based on this mathematical relationship that be always existed. Most traders look at the same things on charts and study the same information.. the reason because the majority lose money. It is a tool based not on the ideas of the majority but on the real foundations that rule the forex market. The tool is a visual tool,
2 300 USD
INTRODUCING WORLD'S FIRST MT4 & MT5  Gann Dynamic Square, Circle and Equilateral Triangle  To Analyze Market Geometric Relationship. Gann Dynamic Square  has some of the most impressive features you will ever find in Gann & Geometric Analysis world. The Gann Dynamic Square is a tool to draw offset Square,Equilateral Triangle & Circle.Most charting software or MT4/MT5 market indicators don't have these features. You will be able draw your Geometric shapes like a professional geometric analys
399 USD
Buy and Sell Arrows On The Chart According To Price Action Sends Alerts On MT4 To Your Phone To You Email Does NOT repaint. Works on any pair, any timeframe.     10 Activations allowed so you are free from limitations. MT5 Version here . When you get a signal, all you need to do is check the previous structue highs and lows to use as your stop loss and take profit. See the video below. Settings: Apart from the times you want to get signals and where you want alerts, there is only o
297 USD
FFXMV Dashboard Plus
Opengates Success International
FFXMV Dashboard Plus This is a custom indicator created to give Traders a full view of what is going on in the market. It uses a real time data to access the market and display every bit of information needed to make successful trading. The PLUS there to produce the kind of RESULTS as you see in the SCREENSHOTS, I added a MultipleOrder Utility EA with it with instructions on how to use it with FFXMV Dashboard. INSTALLATION : Read the MANUALS that comes with the rest of the PACKAGE after yo
850 USD
The Nihilist 5.0 Indicator includes Forexalien and Nihilist Easy Trend trading strategies and systems. It is composed of an MTF Dashboard where you can analyze the different input possibilities of each strategy at a glance. It has an alert system with different types of configurable filters. You can also configure which TF you want to be notified on your Metatrader 4 platform and Mobile application The indicator has the option to view how could be a TP and SL by using ATR or fixed points, even
299 USD
Buy and sell arrows on the chart when the trend is about to continue. Aslo Sends Alerts – On MT4 To Your Phone To Your Email. Does not repaint. Works on any pair, any timeframe.   (Just ajust the settings for your pair and timeframe.) 10 Activations allowed so you are free from limitations See an example of alerts from today (23 May 2020) using this and 2 other indicators  here . MT5 version here . The indicator provides accurate buy and sell arrows on the chart when the trend is
297 USD
VTrende Pro MT4 - МТФ индикатор для трендовой торговли с панелью индикации для МТ5 !!! - Подробное описание на русском языке под видео (на Youtube) - !!! Хотя сигналы индикатора VTrende Pro можно использовать, как сигналы полноценной торговой системы, рекомендуется применять их в связке с ТС Билла Вильямса. VTrende Pro MT4 - это расширенная версия индикатора VTrende . Отличие Pro версии от VTrende: - Временные зоны - Сигнал V - сигнал 1-2 волн Основная задача индикатора - определить т
697 USD
Buy and Sell Arrows when price is about to retrace. It Also Sends Alerts – On MT4 To Your Phone To Your Email Does not repaint. Works ony any pair, any timeframe. 10 Activations allowed so you are free from limitations See an example of alerts from today (23 May 2020) using this and 2 more of my indicators  here . MT5 Version here . What is a Retracement and why is it important to you? As you know, the market goes through phases of trend and retracement. Price can only move so fa
297 USD
Наконец, был официально выпущен инструмент торговли ценовым действием без перерисовки. [V1.60] MTF Precise Price Action Arrow отфильтровано. Индикатор MTF Precise Price Action Arrow использует комбинацию нескольких индикаторов для усиления направления рынка. Чтение ценового действия и измерение его силы — дело субъективное, и на освоение этого метода уходят годы. Цель индикатора - сделать чтение направления ценового действия максимально объективным. Философия: Использование только одн
1 099 USD
MACD — один из самых популярных индикаторов моментума и тренда. Измеритель силы валюты также является индикатором тренда, основанным на нескольких валютах. Измеритель силы валюты MACD — это индикатор с одним графиком, который имеет алгоритм MACD и измерителя силы валюты. Он также имеет функцию одним щелчком мыши, в которой 28 основных и второстепенных пар отображаются на вашей панели инструментов. При нажатии на определенную пару ваша диаграмма автоматически изменится на диаграмму по вашему выб
299 USD
Algo Trading Indicaor  With this indicator , you’ll have zones and trends that hight probability the price will reverse from it. so will gives you all the help that you need  Why should you join us !?  1-This indicator is logical since it’s working in previous days movement , to predict the future movements. 2-Algo trading indicator will help you to draw trends which is special and are too strong than the basics trend , trends will change with the frame time that you work on . 3-We can
299 USD
Full Forex Market View Dashboard
Opengates Success International
5 (2)
ПОЛНЫЙ ОБЗОР РЫНКА FOREX Индикатор приборной панели Это пользовательский индикатор, созданный, чтобы дать трейдерам полное представление о том, что происходит на рынке. Он использует данные в режиме реального времени для доступа к рынку и отображения каждого бита информации, необходимой для успешной торговли. МОНТАЖ: Прежде чем прикреплять этот индикатор к оконному графику, перейдите на панель «Обзор рынка» вашего MT4 и СКРЫТЬ все валютные пары, которые вам не нужны или которыми вы торг
650 USD
DESCRIPTION The CHAOS INDICATOR has been developed to be used for the TRADING STRATEGY OF CHAOS, as described in the book. The book is in italian language only and can be obtained only on my website indicated below. DATAS COLLECTED AND SHOWN ON GRAPHS The CHAOS INDICATOR apply easily to any graph and any asset, and it is a TRADING FACILITATOR, as it identify immediately the following items on any graph: - The GP (= RIGHT PRICE) i.e. the price to which the asset should be attracted within 24
380 USD
Buy And Sell Signal Arrows On The Chart When The Price Is About To Reverse. Also Sends Alerts – On MT4 To Your Phone To Your Email. Does not repaint. Works on any pair, any timeframe.   (Just ajust the settings for your pair and timeframe.) 10 Activations allowed so you are free from limitations MT5 version here .   What is Price Rejection and Reversal and why is it important to you? If price shows certain signs of rejection e.g. a large wick, this often means that it will then r
297 USD
The breakout algorithm is a technique based on price, price features, to shape a breakout strategy. The strategy in this indicator will not be redrawn (none-repaint indicator), it is suitable for short or long term traders In the screenshot is the EURUSD pair, these currency pairs, commodities or stocks, it have similar strength *Non-Repainting (not redrawn) *For Metatrader4 Only *Great For Scalping *Great For Swing Trading *Arrow Entry, Green is Long, Red is Short *Works On Any Timeframe *Work
9 900 USD
Gartley Projection D
Oleksandr Medviediev
4.17 (6)
Индикатор определяет паттерны гармоник (XABCD) согласно разработок H.M.Gartley ( "Profits in the Stock Market" , 1935г). Проецирует D-point - как точку в перспективной проекции (в настройках указать параметр ProjectionD_Mode = true ). Не перерисовывает. На закрытии бара рабочего тайм-фрейма, если в течение Patterns_Fractal_Bars баров последняя обнаруженная точка паттерна не сдвинулась - возникает стрелка на графике (в направлении предполагаемого движения цены). С этого момента стрелка остается н
300 USD
WORLD'S FIRST AUTO SCALED GANN PERCENTAGES CHANEL AND GANN GRID                                                                     W.D. Gann Grid With auto Scale & Percentage Change.. Gann Grid is unique concept to finding major turning points  and Support/resistance level Our tools has additional feature for Scale point input method and price percentage method to use any stock and commodities charts scale. Normally people are using fix grid for a
300 USD
Ns_Geometric Chart Scale for MT4-Gann Grid,Gann Square & Gann box...To Draw any Geometric Shapes and Gann grid. #Forex Currecnies Pairs-Place same number & decimal in Gann Grid. if Commodities & Cryptocurrencies chart scale shows 0.66/66 same Scale for GannGrid ,for Gann square/Gann scale-66/660 Box only Numbers. #If Stocks & Index sale display - 3.03 that means Same scale input 3.03 for  Gann Grid and 303 for Gann Square & Gann Box Scale. Video Links :- https://youtu.be/Wnzq2-65GG4           
599 USD
Weis Wave with Alert
Trade The Volume Waves Single Member P.C.
4.76 (17)
Индикатор волны Вайса основан на теории Ричарда Вайкоффа. Работает на всех таймфреймах, флетовых и тиковых графиках. Может применяться к любому рынку. Индикатор добавляет объемы соответствующих ценовых волн и рисует кумулятивную гистограмму. Каждая ценовая волна движется в определенном направлении вверх или вниз, пока не изменится. Чтобы индикаторная волна развернулась, цена должна превышать количество точек (пипсы * 10), установленных в параметрах индикатора. Поэтому последняя волна перерисовыв
379 USD
Здравствуйте, я Айман (Ayman) из Египта, я хочу представить вам один интересный индикатор. Он зависит от Ichimoku Kinko Hyo, но у него есть секрет, который я использую. С помощью моего индикатора вы сможете узнавать множество полезной информации о рынке, такие как: Особенности Сможете избежать вхождения во время турбуленции рынка Сможете открывать ордера только по общему тренду Будете знать, является ли тренд сильным или слабым Если вы вошли с любым ордером, с помощью этого индикатора вы сможе
300 USD
Buy and Sell Arrows when price breaks away from mean price. Sends Alerts – On MT4 To Your Phone To Your Email Does not repaint . Works on any Forex pair, any timeframe. 10 Activations allowed so you are free from limitations >> MT5 Version Here What Is The Meaning Of Mean Reversion? Mean reversion, or reversion to the mean, is  a theory used in Forex Trading which uses the fact that asset price will come back to the mean (or average) price level . Similarly, therefore, it also breaks
297 USD
Другие продукты этого автора
Aikido
MOHAMMED IMAD HUSSEIN BASSEE
This indicator gives you the strength of currencies according to multiple frames With this indicator, you can know the true direction of the currency pair This indicator gives you good advice to bet on the best fighter If you know how to use this indicator, you do not need any other indicators This indicator is suitable for working on long-term, short or medium-term trades. This indicator is your loyal friend
100 USD
Daenerys Targaryn
MOHAMMED IMAD HUSSEIN BASSEE
This gives you many opportunities and gives you beautiful goals in a short time that you can see for yourself and this indicator depends on the foundations and rules of special knowledge It also gives you entry and exit areas with very good and profitable goals This is an indicator that I have been training on for a long time The results were more than impressive
50 USD
Gray Wurm
MOHAMMED IMAD HUSSEIN BASSEE
Grey worm  This indicator is a group of indicators combined Volatility and saturation give us buying and selling and many more things Use this indicator with your technical analysis or strategy Do not use it alone and it will give you very good results It is valid to work on all pairs, metals and instruments If you have any question, I will be happy to answer it Please do not forget to rate the good and the positive comment
150 USD
Фильтр:
Нет отзывов
Ответ на отзыв