• Тип индикатора
  • Цена
     - 
  • Сбросить
Смотри обучающее видео по маркету на YouTube
Как купить торгового робота или индикатор
Запусти робота на
виртуальном хостинге
Протестируй индикатор/робота перед покупкой
Хочешь зарабатывать в Маркете?
Как подать продукт, чтобы его покупали

Новые технические индикаторы для MetaTrader 4

icon На основании сигналов технических индикаторов из списка ниже вы сможете принимать решения относительно открытия или закрытия сделки в платформе MetaTrader 4. Работа индикаторов заключается в математическом преобразовании цены и/или объемов финансового инструмента для прогнозирования изменений цен.
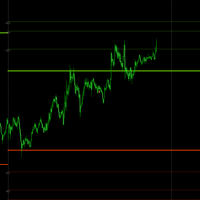
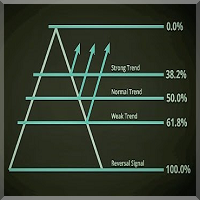
Индикатор показывает уровни золотого сечения Фибоначчии, и линию баланса цены Имеет три различными варианта чувствительности Позволяет визуально ориентироваться в каком состоянии находится рынок и где возможны развороты тренда Работает на всех таймфреймах, на любых валютных парах, металлах и криптовалюте Можно использовать при работе с бинарными опционами Отличительные особенности Основан на золотом значении Фибоначчи; Определяет балансную линию равновесия цены Имеет три различных настройки чувс
FREE
The indicator is the advanced form of the MetaTrader 4 standard Fibonacci tool. It is unique and very reasonable for serious Fibonacci traders. Key Features Drawing of Fibonacci retracement and expansion levels in a few seconds by using hotkeys. Auto adjusting of retracement levels once the market makes new highs/lows. Ability to edit/remove any retracement & expansion levels on chart. Auto snap to exact high and low of bars while plotting on chart. Getting very clear charts even though man
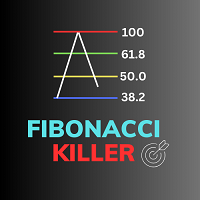
Fibonacci Killer - Your Ultimate Trading Assistant Are you ready to take your trading to the next level? Introducing Fibonacci Killer, the ultimate trading indicator designed to help you spot critical trading opportunities like never before. Key Features : Fibonacci Magic : Fibonacci Killer harnesses the power of Fibonacci retracement levels to provide you with precise entry signals. It monitors the market and generates signals as soon as a new candle begins, giving you a head start in your trad
Discover the power of precision and efficiency in your trading with the " Super Auto Fibonacci " MT4 indicator. This cutting-edge tool is meticulously designed to enhance your technical analysis, providing you with invaluable insights to make informed trading decisions. Key Features: Automated Fibonacci Analysis: Say goodbye to the hassle of manual Fibonacci retracement and extension drawing. "Super Auto Fibonacci" instantly identifies and plots Fibonacci levels on your MT4 chart, saving you tim
FREE
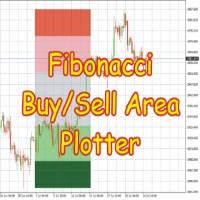
This Indicator is based on Fibonacci levels and draws Buy & Sell Areas. Buy areas are defined in green color (light green & dark green) while Sell areas are defined in red color (light red pink and darker color) Rectangles to easily know that whether price is in buy area or sell area. If price is in gray area, wait for price to come in to your desired area. You can use on any Forex Pairs. This indicator calculates on the basis of h4 timeframe no matter what time frame you have selected, its cal
Fibonacci retracement is an object or function that is often used by traders to determine values of fibonacci levels. When to open position, where is the breakout or limit point, stop loss position and take profit position can be determined based on fibonacci levels. But commonly, this object only can be used manually in Metatrader 4 (MT4).  Therefore we need an indicator of fibonacci retracement. The use of indicator will make decision making easier, faster, and more consistence. We recommend t
Fibonacci Currency Strength Meter (FCSM) Early Access Sale!! This new product is still in the process of adding new features and settings. For early bird buyers. The Price will be 50% Sale. In a few weeks, the product will be done. Go Grab your copy while it's still cheap. More details will be added soon. Things to be added. Alert Levels Mobile and Email Alert From it's name, Fibonacci Currency Strength Meter is a combination of Fibonacci levels and Currency Strength Meter. The plot of Fib
Fibonacci automatically draws Fibonacci retracement, Because Fibonacci automatically draws Fibonacci retracement, you can know at a glance the price to buy at a push or sell back. Therefore, you can trade in favorable conditions in a trending market. We are live-streaming the actual operation of the system. Please check for yourself if it is usable. Please check it out for yourself. https://www.youtube.com/@ganesha_forex We do not guarantee your investment results. Investments should be mad
The MT4 indicator that we are describing is designed to provide traders with an alert, notification, and email when Fibonacci levels are crossed. The Fibonacci levels are calculated based on the zigzag indicator, which helps to identify potential trend reversals in the market. When the indicator detects that a price has crossed a Fibonacci level, it will trigger an alert and send a notification to the trader's MT4 mobile app. Additionally, the indicator can be configured to send an email to the
FREE
Fibonacci Retracement object is an object that has been provided by metatrader 4 platform. But  Fibonacci Retracement  object doesn't automated adjust the chart. You have to put and manage it manually to the chart. Because of that, this indicator was created. If you like using filbonacci retracement indicator, highly recommended to use Automated Fibonacci Retracement Indicator if you want to get better result in here: https://www.mql5.com/en/market/product/95515 LT Automated Fibonacci Retrace
FREE
This dynamic indicator allows you to measure retracements of price between any two points in either direction. It displays the price points, percentages and also displays the extension levels. User may Modify and Add addition levels and extensions." User may also Add multiple Fibonacci indicators on the chart and change their colors,   style and sizes. Can be used on any timeframe. This is the only Fibonacci Tool you'll need to measure and trade on Structure. MT5 Version Available as we
FREE
Pivot Classic, Woodie, Camarilla, Fibonacci and Demark   Floor/Classic Точки разворота или просто развороты полезны для определения потенциальных уровней поддержки/сопротивления, торговых диапазонов, разворотов тренда и настроений рынка путем изучения максимума, минимума и значений закрытия актива. Точки разворота Floor/Classic можно рассчитать следующим образом. Pivot Point (P) = (High + Low + Close)/3 S1 = P * 2 - High S2 = P - (High - Low) S3 = Low – 2*(High - P) R1 = P * 2 - Low R2 = P + (H
FREE
Fibonacci colores
Carlos Augusto Cedeno Rocha
Fibonacci por color en niveles para aplicar estrategia profesional inicialmente se coloca en el punto mas alto del dia y mas bajo con esto es para ubicar operaciones a una distancia exacta con lo cual se busca generar ganancias residuales internas en el mismo dia con esto las lineas fusias es para colocar las entrdas sell y las lineas verdes amarillas van los buy
This indicator draws the projections of Fibonacci above the yesterday high and below the yesterday low.  Why?  1) First of all, in this you can take the pulse of the market (trend or range). For instance If the price runs above yesterday's high the trend is UP.  2) In this way you will have automatic targets for the trend 3) you can wait the market on excess levels for contrarian and low risk trades. If you buy the product feel free to contact me for additional tips or info. I wish you
XFibo Auto Fibonacci
Welinton Dos Reis Goncalves
Use with disciplined risk management. Fibonacci entry system based on the golden zone 38.2 - 61.8 where the entry is confirmed at 23.6 with indications of Take Profit 3:1. Automatically plotted Fibonacci contains retracement and expansion Fibonacci in a single indicator. Up to 77% win rate with this system. FTMO challenge pass with 0.50% risk and 1.50% R:R.
Basic Fibonacci Calculation Indicator  shows Trend, Stoploss, Profit 1,2,3, will show you your daily Highs and your Daily Lows , it will also show you where it expects the price to move to.  best time frame is H1 or higher .  For  a better system that also includes my Non-repaint Indicator please check out my paid Fibo Indicator  https://www.mql5.com/en/market/product/82323
FREE
Fibonacci Dimension MT4
Keni Chetankumar Gajanan -
5 (3)
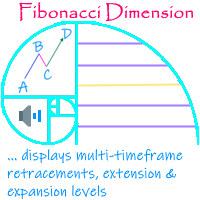
'Fibonacci Dimension' indicator allows display of preset or user-defined multi-timeframe Fibonacci levels. It automatically takes the previous high and low for two user-defined timeframes and calculates their Fibonacci retracement levels. It also considers the retraced level to draw the expansions on every change of price. A complete visual dimension in multiple timeframes allows deriving profitable strategies for execution. The functionalities included are: Provides an option to consider a pres
FREE
This indicator detects trade direction and sends notification to your mobile phone so that you can  enter/exit a trade without having to be seated in front of desktop computer all day and night. Although you have to execute/send an order yourself, you can setup rules through the setting made available for proper lots size base on the available balance/fund you are trading with. The opportunity to take a profit at the right time and set reasonable stop loss that will not be overwhelming and gett
MT5 Version Fibonacci Bollinger Bands MT4 Fibonacci Bollinger Bands is a highly customizable indicator that shows areas of support and resistance. This indicator combines the logic for the Bollinger Bands with the Fibonacci level. Fibonacci Bollinger Bands is the   first   indicator in the market that allows the user to 100% customize up to 12 Fibonacci levels, the Moving Average type and the price data source to use for the calculations. This flexibility makes the Fibonacci Bollinger Bands easi
FREE
Fibonacci Breakout
Agus Putu Gede Wira Adnyana
3 (1)
Прорыв Фибоначчи — это торговая стратегия, использующая уровни коррекции Фибоначчи. Эта техника на самом деле позволяет нам войти в начало тренда. Его очень легко понять даже новичку. Стратегия заключается в том, что вам просто нужно дождаться появления автоматического пользовательского числа Фибоначчи, а затем вручную разместить отложенный ордер, стоп-лосс и тейк-профит на уровне Фибоначчи. Позиция будет открыта, когда цена совершит успешный ретест. Прорыв Фибоначчи Подходит для Forex, Crypto и
Possible Price reversals levels - based on  Fibonacci + Support +  Resistance Levels Auto levels drawn based on input index (Bars Count )  ---->>> Price Over 50% Fibo line ---> UP TREND ---> BUY when price drop near Support Lines  ---->>> Price Down 50% Fibo line ---> DOWN TREND ---> SELL when price goes up  near Resistance Lines  --->>> The more close price levels ----> the more possibility for price reversals --->>> are you a scalper --> try it on M1 charts with big index like 5000 bars  or
Auto Fibonacci Button The Fibonacci retracement is a popular and reliable technical analysis tool for traders to determine support and resistance areas.  It employs the "Golden Ratio," a mathematical pattern seen throughout nature and even the universe, to forecast particular levels of support level and resistance level.  This tool is generated in technical analysis by dividing the vertical distance between two extreme points on the chart (typically a peak and a low) by the important Fibonacci
Fibonaccitools
Aymn Sʿyd Ahmd Hsn Alkwmy
Уровни коррекции Фибоначчи - популярные инструменты, которые трейдеры могут использовать для построения линий поддержки, определения уровней сопротивления, размещения стоп-ордеров и установки целевых цен. Восстановление Фибоначчи создается путем взятия двух крайних точек на графике акций и деления вертикального расстояния на ключевые соотношения Фибоначчи, составляющие 23,6%, 38,2%, 50%, 61,8% и 100%. Индикатор инструментов Фибоначчи будет рисовать инструменты Фибоначчи, например Восстановление
Fibonacci Retracements Pro
Savia Forex Software Solutions
Fibonacci Retracements Pro The Fibonacci Retracements Pro is a powerful yet easy to use indicator. It automatically plots all the important Fibonacci retracement and extension levels for you. FRP is dynamic powerful and seamlessly adjusts to whatever timeframe you are analyzing. Fibonacci Retracement Pro is optimized for ALL timeframes and ALL Currency pairs, Indices, Commodities, and Cryptocurrency pairs. Trade with improved confidence and maximize your success rate. Benefits Dynamic and Power
Fibonacci Magic Pivot Levels The  Fibonacci Magic Pivot Levels  is a  powerful yet easy to use indicator . It   continuously monitor s intra-day  price action  and uses complex algorithms to calculate and detect key support, resistance and pivot levels, using the D1 timeframe as a filter.  The    Fibonacci Magic Pivot Levels is optimized for H4, H1, M30, M15, M5 & M1 timeframes and  can be used on ALL Currencies, Indices, Commodities, and Cryptocurrency pairs . Trade with improved confidence an
This indicator identifies the major and minor swing high and low points on a chart. It then takes the most recent swing and draws a fibonacci pattern of retracement and extension levels to give you an idea of where price may move next. It allow allows you to set a pair of moving averages to help identify the direction of the overall trend. There are configuration parameters for the major and minor swing and the moving averages.
Fibonacci retracements can be used to draw support lines, identify resistance levels, place stop-loss orders and set target prices. The Advanced Automatic Fibonacci retracements draws automatically all the levels. You have a lot of options to choose. For exemple you can use the tracements of another time frame (MTF) in the current chart, you can also choose between the closest level or less close to draw the retracements. You can also add 2 levels of your choice. You can add levels extensions o
Fibonacci Level start form price Open as zero number. then do Fibonacci line offset on above and to below, base last Day High Low Fibonacci Percentage. With ADR Label for measure maximum and minimum pips running limit. Using ADR 5 days, ADR 10 Days, ADR 20 Days and ADR 50 Days. On current running price, there plot two line boundaries, are current High line and current Low line, with percentage running pips. Please see attachment pictures for more information. Regards
Fibonacci calculator is used with Elliot Waves, it can generate remarkable results. A trader could use these levels or ratios to find high probability trades with very small stop loss. You may also use these ratios to find Elliott Waves extensions and to book profit near those levels. For Elliot Wave experts, Fibonacci calculator is a highly useful tool that can assist them in calculating Fibonacci extension and retracement levels for the market price. The indicator proves itself as a useful one
LordAutoFibonnaci
Igor Pereira Calil
5 (1)
Lord Auto Fibonnaci is a free indicator for Meta Trader, in order to show the most famous chart in the financial market known as "Fibonnaci". As we can see in the images below, the fibonnaci table will automatically analyze the graph for you, with trend factors through percentage, almost infallible use, you can always work when the percentage is low or high, start shopping and sales on time, great for analyzing entries! In the images below we can see an example in gold in H4, where we are a
FREE
Fibonacci Sniper MT4 - No Repaint Features:  - Indicator sends signals and notifications on key Fibonacci Retracement and Fibonacci Extensions Levels - Once the buy/sell signal is set, targets ( TP1 TP2 TP3 )and stop loss levels are drawn by the indicator. - Fibonacci Calculations and Custom Patterns are identified by the last 3 or 5 Zig Zag exterum. - You can easily identify key harmonic patterns like Gartley, Bat, Butterfly and Crab patterns. Important Settings:  - Choose the Zig
The reason why many traders new to using the Fibonacci retracement tool find it hard to effectively use it is because they are having trouble identifying swing points that are significant enough to be considered. Main Features Show Fibonacci number with LL to HH in multitimeframe Show 23.6,38.2,50,61.8,78.6,88.6,100,112.8,127.2,141.4,161.8,200,224,261.8,314,361.8 and 423 of Fibonacci number Easy to use with simple interface. Real time information for the Fibonacci number . Settings Global
Chỉ báo tự động rút ra mức thoái lui fibonacci của tháng và năm. Draw from the same or under the same same or on the same of the tree before that. https://www.mql5.com/en/charts/12730171/audusd-pro-d1-axicorp-financial-services Màu đỏ là tháng fibonacci Màu vàng là tuần fibonacci White color is fibonacci date Red color is fibonacci month Yellow color is fibonacci tuần White color is fibonacci date Red color is fibonacci month Yellow color is fibonacci tuần White color is fibonacci date
The indicator is the advanced form of the MetaTrader 4 standard Fibonacci tool. It is unique and very reasonable for serious Fibonacci traders. Key Features Drawing of Fibonacci retracement and expansion levels in a few seconds by using hotkeys. Auto adjusting of retracement levels once the market makes new highs/lows. Ability to edit/remove any retracement & expansion levels on chart. Auto snap to exact high and low of bars while plotting on chart. Getting very clear charts even though many ret
We know for sure that The Fibonacci sequence is a science used to calculate or estimate target distances. How does this indicator work? 1. Tell the spread status 2. Tell me the current price 3. Indicate whether the candlestick status is bullish or bearish on each time frame. 4. Indicates the status of the past 2 candles 5. Tell Pivot Point 6. Tell the Fibonacci sequence. 7.The Fibonacci measurement can be set. 8. Pivot can be set backward. 9. Look at support and resistance. Suitable for 1.
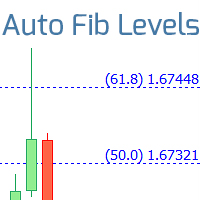
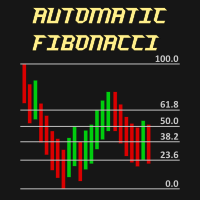
Автоматические уровни Фибоначчи Индикатор автоматически строит уровни Фибоначчи по последнему закрытому бару установленного тайм-фрейма. помогает видеть  потенциальные уровни разворота ; паттерны, сформированные около уровней, имеют больший потенциал; существенно экономит время, затрачиваемое на ручное перестроение уровней; абсолютно точное построение уровней, чего сложно добиться при ручном построении; Настраиваемые параметры: Используемый тайм-фрейм для построения уровней; Персонализация уров
ФТУ Фибоначчи Этот индикатор рисует уровни Фибоначчи для уровней восстановления от ценового действия. Функции: Регулировка нескольких уровней Фибоначчи Изменить цвет и количество баров из диапазона 2 линии для 50-барной истории, 2 линии для 20-барной истории, обе показывают уровни Фибоначчи 38 и 61 Использование: Цель состоит в том, чтобы изучить или измерить откат цены. Изменение цвета и количества баров из диапазона Использование на любом таймфрейме, продукте/паре, без пере
Introduction to Fibonacci Volatility Indicator Volatility indicator can help you to detect any statistical advantage for your trading. Especially, if you are trading with Price Action and Price Patterns, then we recommend to use the Volatility indicator together with your strategy. Especically, Fibonacci Volatility indicator combines the market volatiltiy with Fibonacci Analysis to provide you more advanced volatiltiy indicator. Main Features Fibonacci Volatility in Z score Configuration Mode Fi
El Fibonacci automatico de Grupo Bazan Inversores, permite al usuario que lo utiliza, ver desplegado de manera automatica los niveles Fibonacci de los periodos que el mismo usuario haya seleccionado. Esto permimte que el usuario no tenga que seleccionar el Fibonacci de la plataforma de metatrader 4 para colocar manualmente la figura, pudiendose concentrar exclusivamente en su analisis u operativa.
Как форекс-трейдер, вы понимаете ценность торговой стратегии   Фибоначчи   в техническом анализе. Однако ручное рисование и корректировка уровней Фибоначчи может занять много времени. Вот тут-то и появляется индикатор   Fibonacci Of Yesterday Ultimate   . Он разработан специально для трейдеров, использующих стратегию Фибоначчи, основанную на ценовом движении предыдущего дня, что экономит ваше время и усилия. Этот инновационный индикатор автоматически определяет уровни входа, стоп-лосса и тейк-пр
Fibonacci indicator based on fractal.This software can automatically draw the golden section proportional line of two trend lines, and mark all the recent high and low prices.And the percentage value of volatility is a multi-cycle, multi-currency oscillation indicator.It is very effective for traders to find support and resistance lines and find entry and exit points near them.
About: A Fibonacci indicator is best used with other indicators like Pivots, Support/Resistance etc. Price tends to use Fibo levels as Support or Resistance lines. So, this indicator is very useful to know when price might reverse or if a level is crossed, price might continue the trend. Also, to find the best Take Profit and StopLoss lines. Don't use Fibo Indicator alone for trading as it might not always be accurate. Use it to make your strategies better as a supporting indicator. Settings:
FREE
Индикатор пригодится тем, кто использует кластеры Фибоначчи в торговле и применяет построения с разными наборами уровней. Каждый набор уровней применителен как к уровням Retracement , так и к Expansion (выбирается в настройках). Уровни задаются перечислением в формате "0;50;61.8;100". Настройки индикатора: Fibonacci #1 – Набор уровней #1 Fibonacci – Тип уровней : Retracement или Expansion Levels – Набор уровней в формате "0;23.6;38.2;50;61.8;100" Color line – Цвет линии Style line – Стиль линии
FREE
Free version of  https://www.mql5.com/en/market/product/44606   Simple indicator to calculate profit on fibonacci retracement levels with fixed lot size, or calculate lot size on fibonacci levels with fixed profit. Add to chart and move trend line to set the fibonacci retracement levels. Works similar as default fibonacci retracement line study in Metatrader. Inputs Fixed - select what value will be fix, lot or profit  (available in full version, lot is set on free version) Fixed value - value t
FREE
mql5 version:  https://www.mql5.com/en/market/product/44815 Simple indicator to calculate profit on fibonacci retracement levels with fixed lot size, or calculate lot size on fibonacci levels with fixed profit. Add to chart and move trend line to set the fibonacci retracement levels. Works similar as default fibonacci retracement line study in Metatrader. Inputs Fixed - select what value will be fix, lot or profit Fixed value - value that will be fix on all levels Levels - levels for which to ca
How To Trade Execute your trades in 3 Easy Steps! Step 1: Trade Setup Entry Buy in Signal price and TP1 in price indicator, You can use trailing stop in TP1. Entry Sell in Signal price and TP1 in price indicator, You can use trailing stop in TP1. Success Rate ≥ 75% 100:25 Step 2: Set Stop Loss Stop loss BUY ----> You can set stop loss on Line Order SELL.  Stop loss SELL ----> You can set stop loss on Line Order BUY.  Step 3: Set Take Profit Option 1: Take profit on TP1. Option 2: Partial take
FREE
Launch promotion For a limited time only:  30$ instead of 157$ Summary Shows multiple Fibonacci retracements, projections and expansions ratios at a glance Description A Fibonacci confluence level is a price zone where Fibonacci retracements, projections and expansions meet closely when measuring a swing This technique is used by  intermediate and advanced traders to detect possible reversal zones Tired of manually drawing the same Fibonacci ratios for the same X, A, B, C points to eventually f
Fibonacci ZigArcs MT4 Indicator A Signals filter with breakout + 3 S/R levels Zigzag tops and bottoms auto draw and update the mt4 native fibonacci arcs. The zigzag parameter can be changed by the user. The Arcs color can be changed by the user. This trend map provides the view of the 360 fibo range with levels as filters and targets To have this map around the price in a graph, gives a safe trade, without get lost with trends, or be trapped by false signals from indicators
After the purchase, the current year free indicator, please contact me for your version As a bonus to the purchase, 3 months access to https://www.mql5.com/en/market/product/78772?source=Unknown%3Ahttps%3A%2F%2Fwww.mql5.com%2Fen%2Fmarket%2Fmy Fibonacci retracement This indicator is based on use of Fibonacci retracement. I use Fibonacci levels for last year for important levels, where market stops and turns. These levels are important Price Action levels and market respect them. I do not us
Automatic Fibonacci  is an indicator for automatic Fibonacci Levels drawing. It is fully customizable by user. User can also select different Fibobonacci Levels by user settings or can use multiple Automatic Fibonacci indicator in one chart. All details can be found >>HERE<< Instructions Move Indicator to the chart (simply drag and drop) When pop up window appears select desired settings. Confirm settings and enjoy the Automatic Fibonacci indicator. Features Any chart Any time-frame C
Основан на Волнах индикатора MACD со стандартными параметрами Наносит Уровни Фибоначчи по двум последним Волнам MACD, по положительной и отрицательной соответственно, если в текущий момент по индикатору MACD закончилась отрицательная Волна - то цвет зеленый, если в текущий момент по индикатору MACD закончилась положительная Волна - то цвет красный. Критерий окончания Волны- два тика с другим знаком по MACD. Наносит Трендовые линии по четырем последним Волнам MACD. Хорошо работает с экспертом  Fi
Fibonacci retracement and extension line drawing tool Fibonacci retracement and extended line drawing tool for MT4 platform is suitable for traders who use  golden section trading Advantages: There is no extra line, no too long line, and it is easy to observe and find trading opportunities Trial version: https://www.mql5.com/zh/market/product/35884 Main functions: 1. Multiple groups of Fibonacci turns can be drawn directly, and the relationship between important turning points
BeST_Fibonacci Retracement Lines is an MT4 Indicator that by default is based on common  Fibonacci levels but it can also draw any 3 desired levels of Retracement or Support of a trending move. It can be used to identify pullback points but also additionally as a kind of a Trailing Stop . BeST_Fibonacci Retracement Lines indicator: • by default draws 38.2%, 50% and 61.8% Retracement Levels of the current price move defined using the Highest High (HH) and Lowest Low (LL) of a desired Look Back Pe
Fibonacci retracement is one of the most reliable and used technical analysis tools for trading. It uses the so called “golden ratio” to predict certain levels of support (price movement reverses from downward to upward) and resistance (price movement reverses from upward to downward) which is a mathematical pattern seen through out nature and even the universe. Because so many traders make use of this trading strategy and watch these price levels, more often than not the Fibonacci levels become
Индикатор ForexAurum Fibonacci полезен для трейдеров, которые используют уровни Фибоначчи в сочетании с индикаторами ZigZag. Он вычисляет уровни для всех таймфреймов в режиме реального времени и отображает результаты. Кроме того, вы можете настроить индикаторы RSI, ADX и Stochastic для подтверждения входов. Инструкция по применению Просто перетащите индикатор на минутный график любого символа. Затем вы можете переключиться на более высокий таймфрейм в любое время после инициализации. Рекомен
Индикатор Fibonacci Target работает на основе уровней Low, High и Фибоначчи. Этот индикатор способен прогнозировать целевые уровни. Он старается определить целевой уровень, к которому в среднем стремится цена, и рисует целевую зону. Индикатор также служит в качестве осциллятора. Может использоваться в качестве трендового осциллятора после внесения необходимых настроек. Этот индикатор будет полезен для вашей стратегии. Нет возможности генерации сигналов. Параметры TargetPeriod - период линии це
Индикатор Automatic Fibonacci with Alerts автоматически отображает уровни коррекции Фибоначчи на основе количества баров, указанного в параметре BarsToScan. Уровни обновляются автоматически в режиме реального времени при появлении новых максимумов и минимумов среди выбранных баров. В настройках индикатора можно выбрать, какие значения уровней надо отобразить. Также в параметрах индикатора можно выбрать цвета уровней - это позволяет установить на графике несколько индикаторов с различными настрой
Mr Fibonacci
Thushara Dissanayake
5 (2)
Представляем   Mr. Fibonacci   , удивительный индикатор, разработанный для упрощения процесса рисования и корректировки уровней Фибоначчи на графике. Этот индикатор предлагает исключительные возможности настройки для профессиональных трейдеров, позволяя им с точностью рисовать любой уровень Фибоначчи. Кроме того, он предоставляет мобильные уведомления, оповещения по электронной почте и всплывающие оповещения, когда цена достигает уровней Фибоначчи, гарантируя, что вы никогда не упустите потенци
Ms Fibonacci
Thushara Dissanayake
3.75 (8)
Представляем   Ms. Fibonacci   , мощный и бесплатный индикатор, разработанный для упрощения процесса рисования и корректировки уровней Фибоначчи на графике. Этот индикатор автоматически идентифицирует и отмечает новые самые высокие и самые низкие уровни Фибоначчи, обеспечивая точное и точное размещение. Одной из ключевых особенностей Ms. Fibonacci является его способность правильно рисовать уровни Фибоначчи, указывать точки на точки и отмечать соответствующие ценовые уровни. Эта функция экономи
FREE
Индикатор автоматически рисует уровни Фибоначчи от самых высоких максимумов к самым низким минимумам и наоборот, которые можно сочетать со стратегией пирамидинга для улучшения соотношения риска к вознаграждению. Включает в себя настраиваемый диапазон Фибоначчи, а также функцию оповещения. Что такое стратегия пирамидинга? Основная идея пирамидинга в трейдинге заключается в доливках позиции при движении рынка в благоприятном направлении. При этом стоп-лосс движется вверх или вниз (в зависимости
Индикатор предназначен для определения уровней Фибоначчи. Не перерисовывается Синий уровень - это нулевое значение Фибоначчи (так же является Pivot-уровнем) Красные уровни - это расчётные уровни Фибоначчи (используются как место отскока или разворота цены) Автоматическое определение периода (можно использовать и ручной ввод периода) Изменяемый метод расчёта отображения. Настройки BarsHistory - сколько баров использовать для показа индикатора. Method - метод расчёта. AutoPeriod - автоматический р
Complex Fibonacci - это индикатор, который автоматически строит уровни Фибоначчи на всех таймфреймах. Линии Фибоначчи автоматически обновляются в реальном времени при появлении новых экстремумов. Параметры индикатора Period for H1 - период для H1; Period for H4 - период для H4; Period for D1 - период для D1; Period for W1 - период для W1; Period for MN - период для MN; Lines name - Название линий; Lines color - цвет линий.
PZ Fibonacci
PZ TRADING SLU
4.83 (12)
Устали от ручной установки уровней и расширений Фибоначчи? Индикатор самостоятельно рассчитывает уровни и расширения Фибоначчи из двух разных ценовых точек и автоматически отображает их. Прост в использовании Ручная привязка не требуется Идеально подходит для отслеживания пересечения с ценой Индикатор оценивает, нужны ли уровни или расширения После отображения привязку можно менять вручную Адаптриуется к размеру графика и масштабу: Уменьшите масштаб, чтобы получить общую картину Увеличьте масшта
FREE
Индикатор PipTick Fibo позволяет автоматически отображать уровни коррекции Фибоначчи, которые являются значимыми уровнями поддержки и сопротивления. Диапазоном для расчета индикатора может быть дневная, недельная, месячная или любая выбранная пользователем сессия. Levels - уровни 100 % (Максимум) диапазона предыдущей сессии. 0 % (Минимум) диапазона предыдущей сессии. 76,4 % диапазона предыдущей сессии. 61,8 % диапазона предыдущей сессии. 50 % диапазона предыдущей сессии. 38,2 % диапазона преды
FREE
TSO Fibonacci Chains
Dionisis Nikolopoulos
5 (1)
Уровни коррекции Фибоначчи представляют собой метод технического анализа для определения уровней поддержки и сопротивления. Индикатор TSO Fibonacci Chains отличается от стандартных уровней коррекции Фибоначчи тем, что для каждого уровня коррекции дополнительно доступны цели. Другими словами, для каждого уровня коррекции (С) доступен уровень расширения Фибоначчи (D). Индикатор сканирует график для определения точек максимального и минимального ценового уровня. Затем он начинает вычислять цепи Фиб
Индикатор отображает движения уровни Фибоначчи и треугольники на таймфреймах M1-W1. Параметры InDepth: параметр глубины. InDeviation: параметр отклонения. InBackstep: количество баров в истории. Fibonacci Expansion: отображать уровни Фибоначчи. true/false Triangle: отображать треугольники. true/false Интерпретация статусов: Если треугольник зеленого цвета, тренд направлен вверх. Если треугольник красного цвета, тренд направлен вниз.
Данный индикатор использует p-числа Фибоначчи для сглаживания ценового ряда. Это позволяет объединить достоинства простой и экспоненциальной скользящих средних. Коэффициенты сглаживания зависят от уровня p-числа, который устанавливается в параметрах индикатора. Чем выше уровень, тем больше становится роль простой скользящей средней и менее значимой становится экспоненциальная средняя. Параметры Fibonacci Numbers Order - порядок p-числа Фибоначчи, устанавливаемый трейдером. Допустимые значения
Free automatic fibonacci - это индикатор, который автоматически строит коррекции Фибоначчи, основываясь на количестве баров, выбранных в параметре BarsToScan. Линии Фибоначчи автоматически обновляются в реальном времени при появлении новых максимальных и минимальных значений среди выбранных баров. В настройках индикатора можно выбрать уровни, значения которых будут отображены. Также можно выбрать цвет уровней, что позволяет трейдеру прикреплять индикатор несколько раз с разными настройками и цве
FREE
Introduction The Fibonacci Level Professional indicator is a great tool for every day trading as a complement to other indicators for better confirmation of trade setups and where the market tends to move. This indicator is easy to setup and works on all currency pairs and time frames, M15-W1 is recommended. Purpose of this indicator is to show the Fibonacci levels on chart, the daily, upper & lower lines. As an additional function this indicator also draws the retrace and expansion lines to y
Точки разворота по уровням Фибоначчи на ценах предыдущего дня. Используются как сильные уровни поддержки/сопротивления на торговле внутри дня, а также как целевые уровни фиксации прибыли. Используются уровни в 100%, 61.8%, 50%, 38.2%, 23.6%. В настройках указываются количество дней для прорисовки на истории, а также цвета и типы линий. Удачи!
12

MetaTrader Маркет позволяет максимально безопасно покупать программы для платформы MetaTrader. Вы можете скачать демо-версии понравившихся роботов и индикаторов прямо из терминала и проверить их в тестере стратегий.

Протестируйте программы в различных режимах перед покупкой для получения максимального представления о продукте и оплатите понравившийся продукт через платежную систему MQL5.community.

Платежная система MQL5.community обеспечивает оплату продавцам, а возможность тестирования программ в различных режимах позволяет покупателям получить максимальное представление о продукте.