Hello,
I need an indicator that draws two lines (or dots) on the chart, one above and one under the last price and moving average crossing.
Parameters:
- usual Moving average parameters(Period, Method, Apply to)
- numbers of candles we analize backwards (PARAM1)
- numbers of maximum distances to average (PARAM2)
- color for 2 lines
The distance of the lines from the last closed calndle will be calculated as follows:
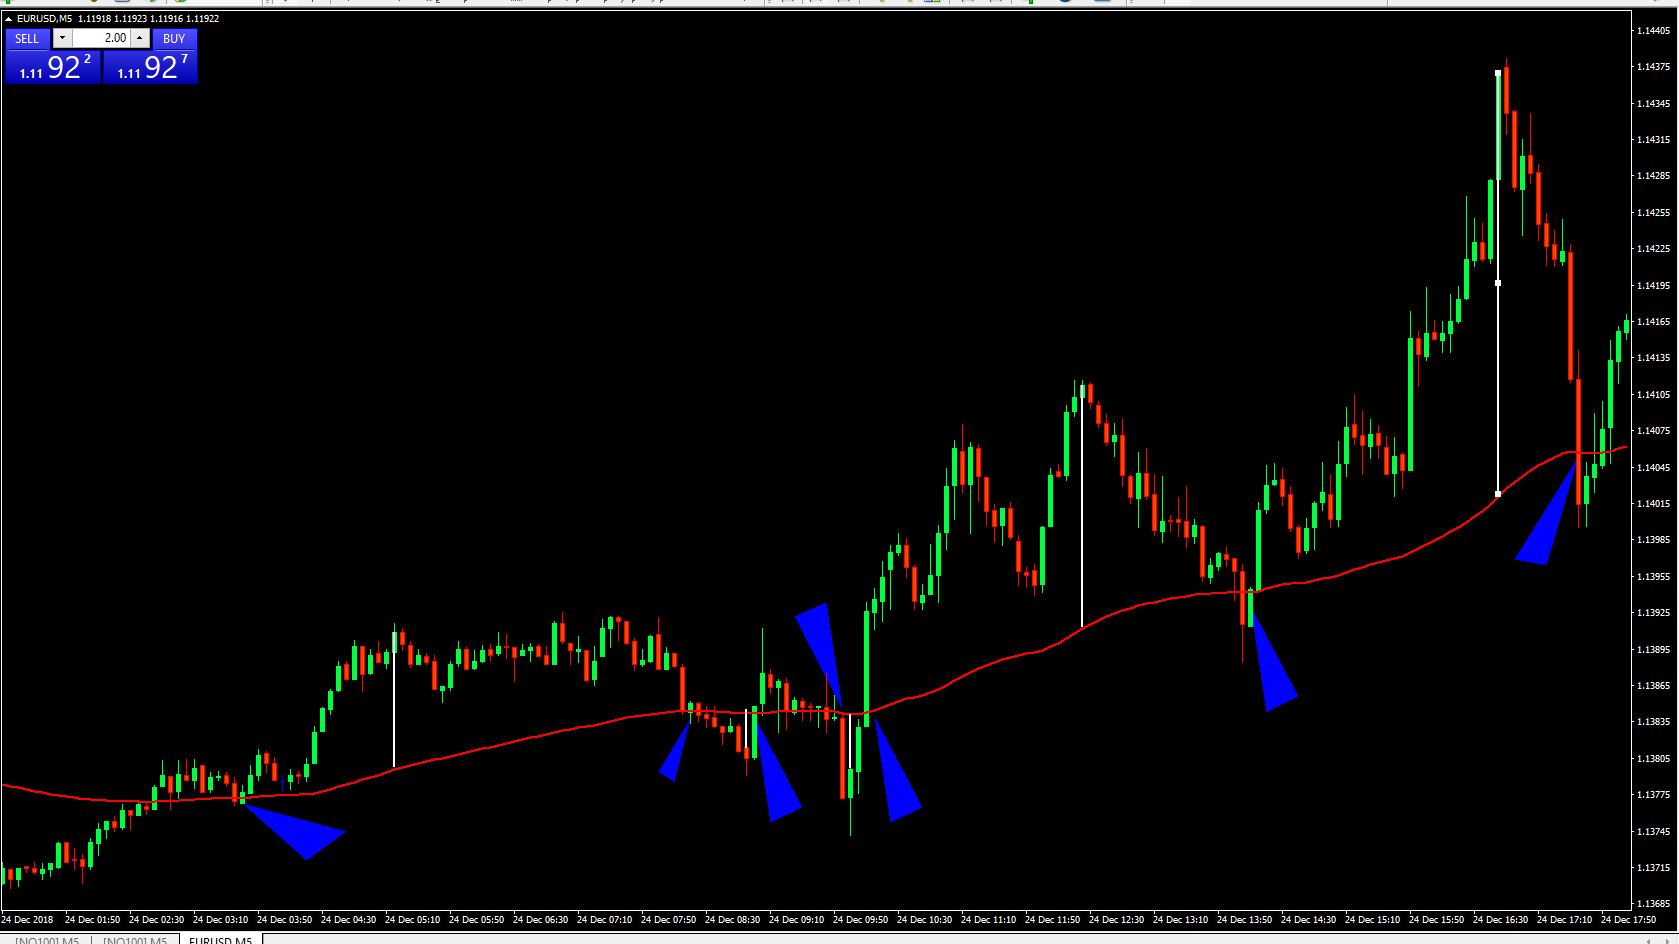
1.) go back PARAM1 candles and calculate all maximal price distances for long and short (closing price above and under the moving average)
from the moving average. A distance is defined as the maximal candle closing distance between the price and moving average between two price
and moving average crosses. Please take a look at the attached prictures. The blue triangles show the price and moving average crossings.
The white lines are the maximal distances between those crossings.
2.) Calcualte the average of the highest distances given by PARAM2
3.) draw a line above and one under the last price and moving average crossing for each following candle until the price and moving average
crosses
4.) calculate and draw again, if the price crosses the moving average
Example:
Step 1.) we go back 1000(PARAM1) candles and analize the maximul distances and we get this distances:
- 10 pips
- 20 pips
- 30 pips
- 40 pips
- 50 pips
2.) if PARAM2 = 3, we take the 3 highest distance and build the simple average : (30 + 40 + 50) / 3 = 40
3.) Draw the two lines ( can be also dots like Parabolic SAR)
Похожие заказы
I need alerts for 2 kinds of triangles (contracting & expanding) and 2 kinds of channels (up & dn) before that you should be able to put trendlines to any buffered (usually 0 & 1) zigzag indicators the method of drawing trendline is different i can show them with the pictures
I trade in NT8 and would like to code an Elliott wave measurment tool, which is very easy because I have the major Script for that.We need only to add some aspects into it. If you are interested,if you can do this do well to bid on it
Hi I am looking for converting an indicator from MT4 to Mt5 It is Tom De Mark sequential This code is based off of the Tom DeMark TD Sequential Indicator. Basic criteria is as follows: | | TD Setup | TD Countdown | |------------------ |---------------------------------------------------- |---------------------------------------------------|
Looking for a tradingview expert to do a quick job . It is an indicator so apply only if you are capable. Price is negotiable Check attached file and proofs that you can get it done perfectly
I would like a coded indicator that is able to combine Smart money concept, Pure price Action and Pine script so as to spot trade entries by giving Take profits and Stop loss should also be compatible with all timeframes in trading and also work with all forex markets and Derived synthetic indices. I will upload a picture below. Kindly
I need you to convert this tradingview indicator (PineScript) to MT5. The indicator need to work in any time frame and as the proposed script. It need to plot the ATR bands (as you can see in the attached image) and work as the proposed routine of ATR bands, when price close above or below the bands, the bars will change color (as you can see in the script and the image attached). Instead of sending alerts of buying
"Seeking an adept developer to help realize my custom NT8 strategy. Your expertise is integral to achieving success in this project. Are you interested in teaming up for a productive collaboration? Let's discuss the details together. Thank you!"
NinjaTrader 8 indicator that plots open prices of higher time frame bars. Time frames to choose from in the properties: 15sec, 30sec, 1min, 5min, 15min, 30min, 1hr, 4hr, 1day, 1week, 1month, 1 year (or any time based periods if that would make the development easier). Ability to customize lines is needed (style, color, thickness, etc.). Also, ability to extend certain lines all the way to the right by clicking on
"Looking for a proficient developer to bring my custom NT8 strategy to life. Your expertise is pivotal for the project's success. Interested in joining forces for a fruitful collaboration? Let's delve into the specifics together. Appreciate it!"
"Seeking a skilled developer to code my custom NT8 strategy. Your expertise is crucial for this project's success. If interested, let's discuss further details and ensure a mutually beneficial collaboration. Thank you!"