Abdalla Mohamed Mahmoud Taha
  • Informações
6+ anos
experiência
0
produtos
0
versão demo
0
trabalhos
0
sinais
0
assinantes
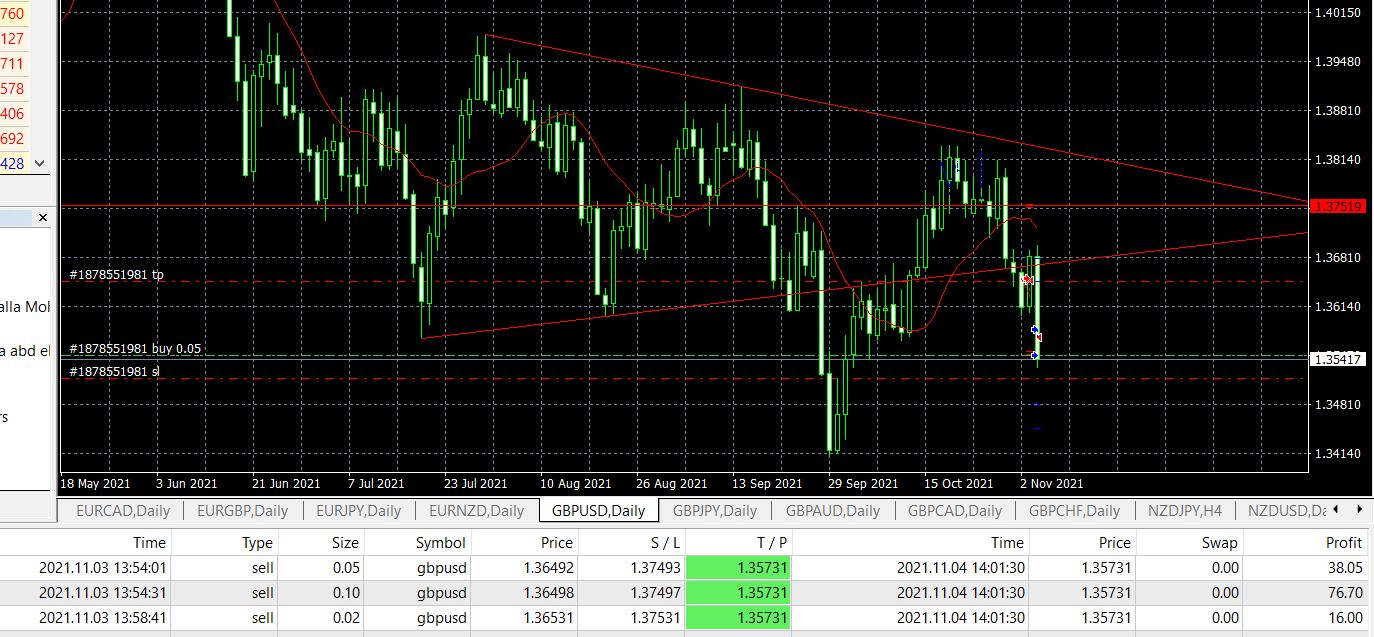
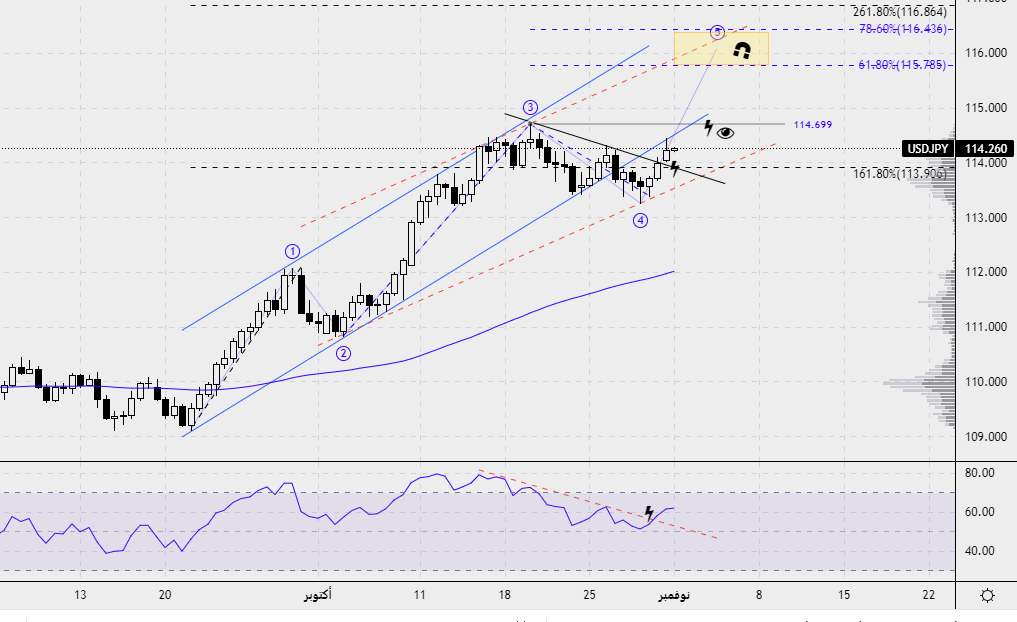
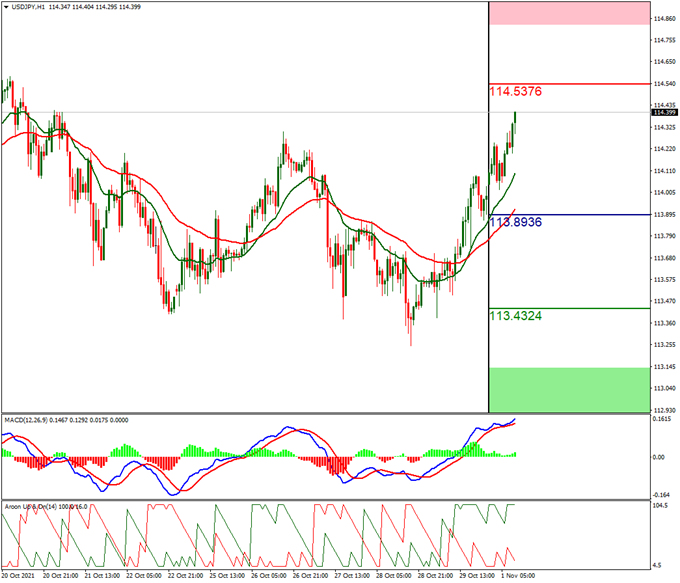
my name Abdalla Mohamed, I have more than 11 years experience in forex market .

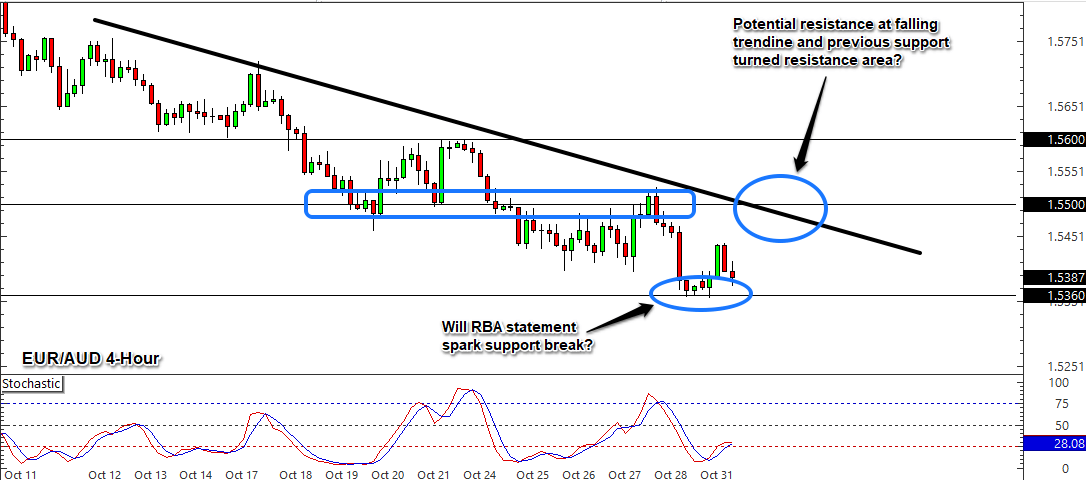
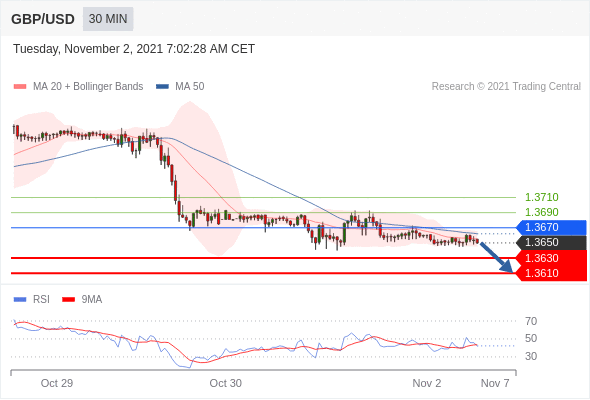
I am very professional scalping trader and I own research and studies on the pairs of the British pound

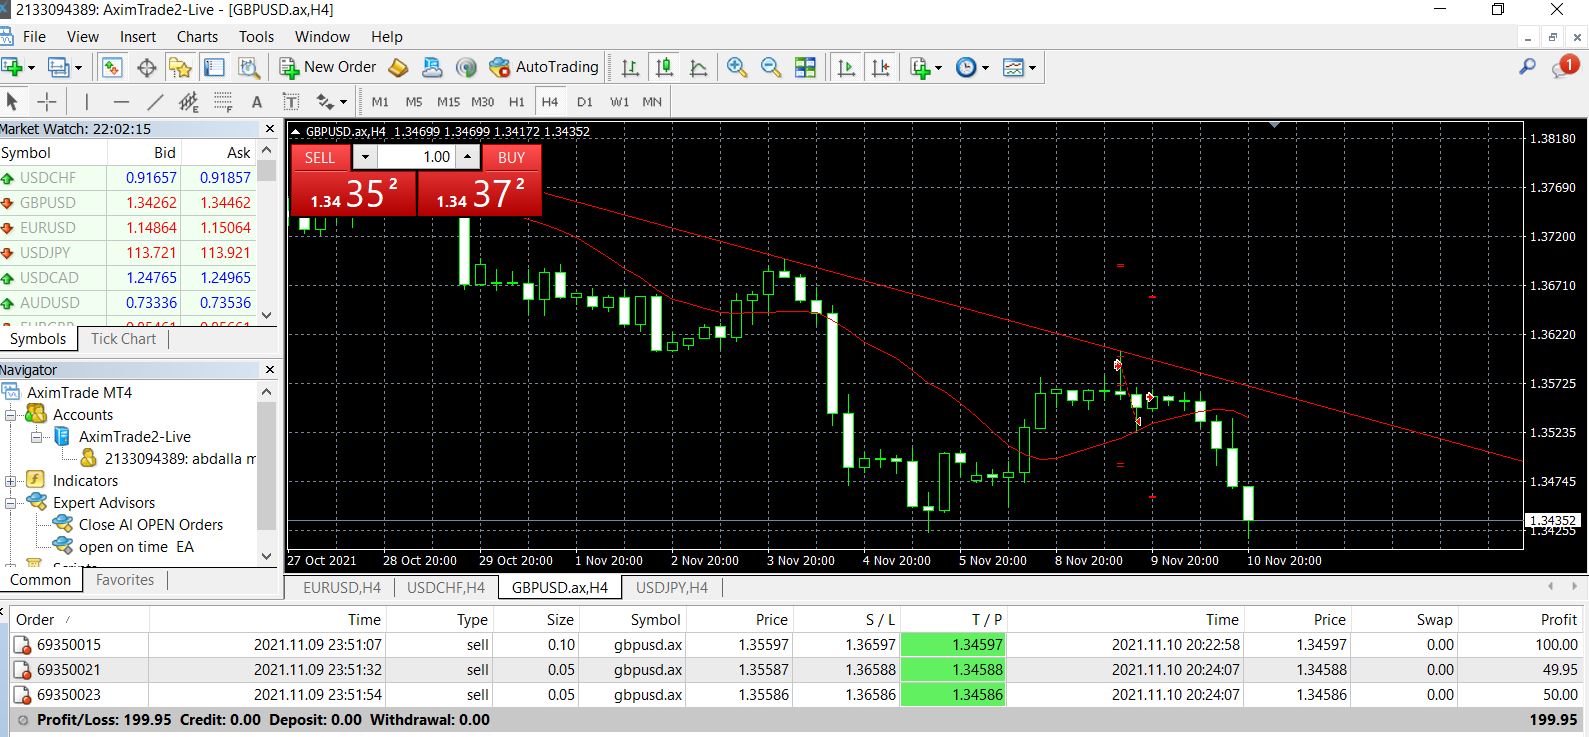
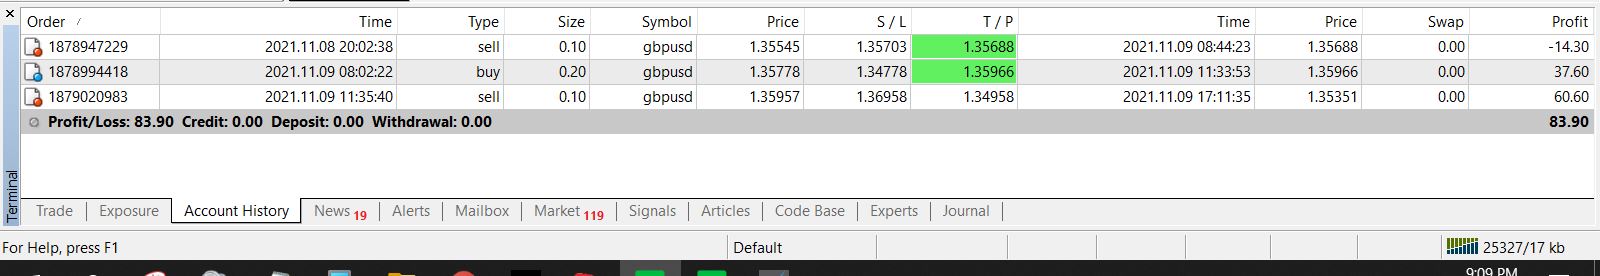
, i have signals providers at MT4 / MT5 , available through the MQL5.com Market.
Abdalla Mohamed Mahmoud Taha
3 Tips to Help You Trade Bigger Positions

Unfortunately, many traders have difficulty taking the next step and trading bigger positions. Some find it hard to risk wiping out the small profits they’ve worked hard for in the last couple of months, while some just can’t stomach risking bigger positions.

Taking on more risk definitely has its perks. But be warned… While it can give you bigger wins, increasing your risk can just as easily magnify your losses and wipe out your entire account. To avoid the pitfalls of trading big, I’ve come up with three simple tips to guide you with increasing your risk.

1. Make sure you’re in the green
Don’t even think about increasing your risk if you’re not even consistently profitable with trading small. If you can’t successfully trade small forex positions, what makes you think you’re gonna have any luck trading bigger ones?

If you think and feel that you’re ready but your account is still in the red, concentrate on pulling it back in the green first. That’s what demo and small accounts are for anyway.

Keep trading small positions until your performance justifies trading bigger. After all, you don’t want to compound your losses with bigger position sizes.

2. Take it slow and steady
Just as you wouldn’t rush to fighting elite world champions after just learning how to box, you shouldn’t rush yourself into increasing your trading size. You don’t want to bite off more than you can chew, do you?

Taking a gradual approach towards increasing your forex position sizes is the key to becoming comfortable with taking a larger risk. If you’re not completely comfortable with the amount of risk you’re taking, chances are, it’ll show on your account balance.

So rather than make one big leap, go for small, steady increases. It’s less likely to have an adverse effect on your trading mindset, and it’ll allow you to adjust to larger risks more smoothly.

3. Focus on percentages rather than dollar amounts
I’ll let you in on a little trading secret that’ll help you adjust to larger trading sizes: focus on percentages rather than dollar amounts.

Risking 1% on a $10,000 account is the same as risking $100. On the other hand, risking 1% on a $100,000 account is equivalent to risking $1,000. So you see, by risking the same percentage on a larger account, you’re basically trading larger.

It also helps to put profits and losses in the proper perspective when you focus on percentages. Losing 1% on a $100,000 account won’t feel too different from losing 1% on a $10,000 account. But when you put it in raw dollar terms ($1,000 versus $100), it’s a lot harder to stomach.

So there you have it, folks! You should be able to transition to trading bigger forex positions without a hitch if you take it slow and steady, and focus on percentages rather than dollar amounts. But above all, don’t make the mistake of increasing your risk if you’re not yet consistently profitable trading small.
Abdalla Mohamed Mahmoud Taha
Why Traders Can See the Same Chart Differently

Trader’s Perspective
Have you ever witnessed a situation in which two forex traders interpret the same chart in an entirely different way? If so, you’ve seen a prime example of how two people can look at the same exact thing and see different things. This is often referred to as the trader’s “perspective” or “perception.”

While we could debate endlessly about which trader’s perspective is correct (and believe me, traders do debate this endlessly), that’s not the goal of this post. On the contrary, we just want to discuss this interesting phenomenon to learn why it occurs in the first place. So, why can two traders look at the same chart and see different things?

Keep reading to figure it out!

They Use Different Trading Strategies
Factor number one has to do with the trading strategies that each trader uses. Some traders are what we call “traditionalists.” They tend to rely mostly on technical analysis, utilizing things like support and resistance levels, Fibonacci retracements, moving averages, and other similar indicators.

On the other hand, there are also traders who prefer to follow trends. These types of traders are often referred to as “trend followers.” As you can probably guess, they rely less on technical analysis and instead focus on identifying and following trends. The point is that the type of strategy a trader uses will likely impact how they see a given chart.

For example, a traditionalist might look at a chart and see a clear uptrend. However, a trend follower might see the same exact chart and interpret it as being in a consolidation phase before potentially resuming the downtrend. As you can probably imagine, this difference in perspective can lead to entirely different trading decisions.

Recency Bias is a Common Cause Of Trader’s Perspective
Another factor that can impact a trader’s perspective is something called recency bias. This refers to the human tendency to place more emphasis on recent events than on events that occurred in the past.

For example, suppose you’re considering investing in a new company. You might be more likely to invest if the company’s stock has been increasing steadily over the past few months. However, this doesn’t necessarily mean that the company is a good investment; the stock could just as easily fall in the future.

The same is true in the world of forex trading. Traders who are influenced by recency bias might be more likely to buy a currency if it has been rising in value recently, regardless of whether or not it is actually overpriced. In general, it’s important to be aware of recency bias and try to make decisions based on all available information, not just the most recent data points.

Traders May Have Contrasting Emotional States
Another factor that can impact a trader’s perspective is their emotional state. Some traders are very emotionally invested in their trades, while others take a more detached approach.

For example, a trader who is feeling anxious about a trade might be more likely to exit the trade prematurely, even if there is still potential for profit. On the other hand, a trader who is feeling confident about a trade might be more likely to hold onto the trade for too long, even if the market is starting to turn against them.

Of course, emotions are not always bad; they can actually be helpful in some cases. For example, a trader who is feeling confident about a trade might be more likely to take on additional risk and potentially achieve a higher return. However, it is important to be aware of how your emotions can influence your trading decisions.


Pros And Amateurs Have Different Perspectives
One final factor that can impact a trader’s perspective is their experience level. Novice traders are more likely to make mistakes, such as buying a currency when it is overpriced or selling a currency when it is underpriced.

On the other hand, experienced traders are more likely to have a better understanding of the market and make trades that are more likely to be profitable. Of course, even experienced traders can make mistakes; no one is perfect. However, the difference in experience can still lead to contrasting perspectives.


Trader’s Perspective Summary
In conclusion, there are many factors that can impact a trader’s perspective. Some of these factors, such as recency bias and emotional state, are outside of the trader’s control. But a few other factors, such as risk profile and experience level, are within the trader’s control.

It is important to be aware of all of these factors and how they might influence your trading decisions. By doing so, you can make sure that you are making the best possible decisions for your trading strategy.

Author Bio
Charlie Svensson is a fast and engaging freelance writer who works for the college paper help agency. He is a master of finance-related content writing and blogging. Besides that, Charlie likes writing about education, social media, marketing, SEO, motivation, and self-growth.
Abdalla Mohamed Mahmoud Taha
Five Powerful Reversal Patterns Every Trader Must Know

Reversal Patterns Forex
In this post, we will discuss five powerful and reliable reversal patterns in the forex market. Generally, reversal patterns provide a great Risk-Reward ratio potential. We will learn how to identify each one of them and how to trade by using these patterns.


What are Reversal Patterns?
A reversal pattern indicates a change in direction from a rising market to a falling market and vice versa. We can use this pattern to predict the upcoming movement and open or close our trades accordingly.


Head & Shoulders Pattern
The Head &Shoulders pattern is a very unique reversal pattern. It’s a chart formation created by three peaks of the price. The two peaks on the sides are usually of the same height or close, and the one in the middle is the highest.

The Head & Shoulders pattern is considered one of the most powerful reversal patterns in the forex market. This pattern got the name because it actually reminds us of a head with two shoulders on the sides. Usually, we will look for this pattern and use it after a significant uptrend or an opposite Head & Shoulders after a downtrend.

In a bullish trend, the price creates atop – it will be the left shoulder. Then, after technical correction, the price creates a higher top – that will be the head. Now the price will form a deep technical correction to the same level as the last low.

And lastly, the price creates a lower high, which is the right shoulder. The line that connects all the three bottoms of the three peaks is called the Neckline. The confirmation of the pattern comes after the price breaks the Neckline. The moment the price breaks, the Neckline is considered to be a reversal signal, and that’s the time to look for a sell position or to look for a buy position in the opposite Head & Shoulders after a downtrend.

Examples:

Bearish Reversal Pattern - Inverted Head & Shoulders

Bearish Reversal Pattern – Inverted Head & Shoulders


Bullish reversal Head & Shoulders

Bullish reversal Head & Shoulders


How to Predict the Head and Shoulders Pattern 1 Step Before the Price Completes It


Double Top and Bottom
The double top and double bottom are both reversal patterns.

The double-top pattern will usually occur and be useful after a significant uptrend. In an uptrend, the price always creates higher peaks and higher lows.

The double-top pattern is formed by two peaks at the same heights. The situation of two peaks at the same heights after an uptrend indicates the buyers are running out of power. The last bottom between the two tops is called the trigger line.

The pattern will be completed only when the price-breakout the trigger line. When the price breakout the trigger line, it’s a signal for us to look at a price action setup for the sell position.

The double bottom is the exact opposite of the double top pattern. It will usually be reliable and useful after a significant price downtrend.

In a downtrend, the price creates lower bottoms and lower heights.

The price creates two bottoms at the same level in the double bottom pattern, and the sellers failed to create a new lower bottom. That indicates the sellers are running out of power, and a reversal opportunity might appear very soon.

The pattern will be completed when the price breaks out of the trigger line, which is the last top between the two bottoms.

When that happens, we should look for a buy position.

Examples:

Double top pattern

Double top pattern

Double bottom pattern

Double bottom pattern


We Trade Forex – Come trade with us!
Choose the funding program that suits you – Click Here
5ers-logo


Quasimodo Pattern
Quasimodo is definitely one of the most reliable and powerful chart patterns to identify reversal opportunities.

Relatively, the Quasimodo pattern is a new one among technical analysis forex traders. Same as the previous patterns we mentioned, Quasimodo is more reliable and powerful if it occurs after a significant uptrend or downtrend.

The structure of the Quasimodo pattern is quite simple-

Uptrend – the price creates higher peaks and higher lows. Then, the price dropped down from the last peak to form a new lower low. A new lower low indicates the momentum has changed from bullish to bearish.

Usually, the entry level will be the last peak of the price.

Downtrend – The price creates lower lows and lower peaks. Then, from the last bottom, the price rallies and creates a new higher high. After a few lower highs, this new higher high indicates the momentum changed from bearish to bullish.

The entry level, in that case, will be the last bottom where the price rallies from.

The Quasimodo pattern is a great pattern to trade since it creates a great Risk-Reward potential.

Examples:


Reversal Patterns - Bullish Quasimodo

Bullish Quasimodo


Bearish Quasimodo

Bearish Quasimodo

Learn more about the Quasimodo pattern-


Engulfing Candlestick Reversal Pattern
The engulfing candlestick pattern is a reversal pattern that is formed by two candles.

Bullish reversal patterns show up after a downtrend – It starts with one bearish candle followed by a large bullish candle that is engulfing the bearish candle. The bullish engulfing candle must close above the previous candle’s high. That indicates the buyers are waking up, and we should look for a price action setup for the buy position.

A bearish engulfing candlestick pattern will show up after an uptrend – the first candle in this formation will be a bullish candle, and the second is the bearish candle that is engulfing the bullish one. The bearish engulfing candle must close below the previous candle’s low.

When this formation occurs, we should start to look for a price action setup for the sell position.

Finding a bearish or bullish engulfing candlestick pattern at support/resistance levels makes it much more powerful and reliable.

Examples:

Bullish engulfing candle - Reversal Patterns

Bullish engulfing candle

Bearish engulfing candleBearish engulfing candle


Pin Bar Candlestick
The Pin Bar candlestick pattern is one candle formation. This candlestick chart pattern is considered as a reversal pattern among forex traders. It is also considered one of the most powerful and reliable candlestick patterns for trading (it can also show up as an inverted hammer).

The structure of a bullish pin bar starts with a long tail at the bottom, which is called a “wick.” The tail should be at least 2/3 of the entire candle size, which means a long lower shadow.

Then, a small body which is the area between the open and closed price, and in some of them also a small tail at the top.

When we get this type of formation after a significant downtrend, it indicates of a reversal opportunity is coming up soon. In that case, we should start to look for a price action setup for the buy position.

The structure of a bearish Pin Bar is the exact opposite, and it starts with a long tail at the top, then a small body, and a small tail at the bottom for some of them.

When a bearish Pin Bar candlestick pattern occurs after a significant uptrend, we should start looking for a price action setup for the sell position.

Examples:

Bearish pin bar - Reversal PatternsBearish pin bar


Bullish Pin BarBullish Pin Bar


Follow The Money With The Forex Pin Bar Candlestick Pattern Support & Resistance Trading Strategy-


Reversal Patterns summary
Reversal opportunities are rarer than momentum trading or continuation trading. Still, on the other hand, reversal patterns are usually more reliable, and the Risk-Reward potential is higher because any reversal opportunity can sometimes be a beginning of a new trend, and what’s better than being in a trend from the very beginning?
In this post, I described the 5 most powerful reversal patterns that I believe can help any trader to get a better Risk reward ratio for the long term.
Abdalla Mohamed Mahmoud Taha
How To Set A Stop Loss Based On Support And Resistance From Charts

The previous lesson discussed how to set stop loss using a percentage-based amount of your account.

A more sensible way to determine stops would be to base it on what the charts are saying.

Since we’re trading the markets, we might as well base our stops on what the markets are showing us… Makes sense, right?

One of the things that we can observe in price action is that there are times when prices can’t seem to push or break beyond certain levels.
Oftentimes, when these areas of support or resistance are retested, they could potentially hold the market from pushing through once again.

Setting stops beyond these levels of support and resistance makes sense, because if the market does trade beyond these areas, then it is reasonable to think that a break of that area will bring in more traders to play the break and further push your position against you.

Or, if these levels DO break, then there may be forces that you are unaware of suddenly pushing the market one way or another.

Let’s take a quick look at a way to set your stops based on support and resistance:

On the chart above, we can see that the pair is now trading above the falling trend line.

You decide that this is a great breakout trade setup and you decide to go long.
Abdalla Mohamed Mahmoud Taha
GBP/AUD: 1-hour

Support alert!

GBP/AUD is about to hit the 1.7575 area that’s near the 200 SMA on the 1-hour chart. What’s more, it’s also around a major area of interest!

Bulls who believe that GBP will continue to gain pips against AUD can start scaling in at current levels and then add positions as soon as there’s bullish momentum.
If you’d rather pay attention to the (just) broken trend line support, though, or if you think that GBP/AUD will go back to its longer-term downtrend, then you can consider placing short positions once the pair has clearly broken below the 200 SMA support.

Watch how GBP/AUD reacts to the 200 SMA to see which direction the pair will head next!
Abdalla Mohamed Mahmoud Taha
GBP/USD: 4-hour

Cable has formed lower highs and found support around the 1.3000 mark, creating a descending triangle on its 4-hour time frame.

Price is inching closer to testing the triangle support, which might still hold as a floor. After all, Stochastic is already indicating oversold conditions or exhaustion among sellers.
Once the oscillator pulls higher, pound bulls could take this as their cue to bring GBP/USD back up to the resistance at 1.3100. If you’re counting on this to happen, watch out for reversal candlesticks around the support zone.

Just be careful since the 100 SMA is below the 200 SMA to signal that there’s a chance the floor might break. If that happens, the pair could tumble by the same height as the triangle pattern, which spans a little over 400 pips.
Abdalla Mohamed Mahmoud Taha
Tips for Forex Trading Beginners

As a beginner, you’ve taken your first steps towards learning the basics of forex trading.

But it only gets harder from here. Just like learning how to walk, you have to take baby steps, and in between, you will fall, but you get back up and press forward.

If you’re trying your hand at forex trading for the first time, know that most beginner traders are best served by keeping things simple.

Here are some trading tips every trader should keep in mind before trading currencies.

1. Educate Yourself
We can’t emphasize enough the importance of educating yourself and learning as much as you can about the forex market.

Find quality forex education sources like our The School of Pipsology.

Before risking real money, make sure to study the different currency pairs and understand what makes their prices go up and down.

2. Create a Plan and Stick to the Plan
You are the most rational before placing a trade and most irrational during your trade.

This is why you need to always have a plan prior to opening a position.

Creating a trading plan is a critical component of successful trading.
A trading plan is an organized approach to executing a trading system that you’ve developed based on your market analysis and outlook while factoring in risk management and personal psychology.

With a trading plan, you’re able to know if you’re headed in the right direction. You’ll have a framework to measure your trading performance, which you’ll be able to monitor continually.

This allows you to trade with less emotion and stress.

3. Practice
In real life, you may have a plan to drive from Point A to Point B if you don’t know how to drive the car that’ll get you there, then your plan is futile.

The same applies to your trading plan. You should “test drive” your trading plan first until you become proficient in executing the plan.

It’s important to learn how to use the features of a trading platform before you start trading on it.

Fortunately, traders can test out each platform using a demo account, which means no real money is at risk.

A demo account allows you to put your trading plan to the test in real-market conditions, without risking any real money.

4. Keep It Slow and Steady
One key to trading is consistency.

All traders have lost money, but if you maintain a positive edge, you have a better chance of staying profitable.
Educating yourself and creating a trading plan is good, but the real test is sticking to that plan through hardcore discipline.

A trading plan is only effective if it’s followed. You have to stick with it.

5. Know Your Limits
As a new trader, you have to know your limits.

First of all, do you have enough money to trade? Forex will not make you rich quickly! So make sure that the money you’ll be putting at risk (called “risk capital“) is money that you can actually lose.

If you need that money to pay the bills, then you should think twice about trading.

If you do have the money, then you need to know how much you’re willing to risk on each trade, sticking with leverage ratios within those risk limits, and never opening a position size that’s so big that it could blow your account.

A lot of traders fail because they don’t understand trading with margin and ignore the effects of leverage. This shouldn’t be you.

Homeless due to Overleverage

6. Keep Your Emotions in Check
To become consistently profitable, you have to stay rational and emotionally detached.

Many novice traders ride an emotional rollercoaster, feeling on top of the world after a win, but down in the dumps after a loss.
In contrast, most experienced traders stay calm and relaxed even after a series of losses. They don’t let the natural ups and downs of trading affect them emotionally.

Don’t fall prey to the most dangerous emotion in trading.

Emotional stability, matched with proper risk management, is the name of the game.

7. Stay Open-Minded
While having discipline is a very important trait for a trader, you also have to be wary that if you’re too stuck in your ways, you’ll end up imposing our ideas on what the market should do, instead of reacting to what is actually happening.

Constantly question the market and your trading plan.

Asking questions enables you to look at different perspectives of the market that you initially may not be aware of.
This practice will make you think of other potential scenarios that may emerge and enable you to become a better “listener” of the markets, rather an “imposer” of your own thoughts and views that in reality, may not mean zilch to the market.
Abdalla Mohamed Mahmoud Taha
When Is It Okay To Take The Contrarian Approach On Trends?


Some days most forex pairs are just going in one particular direction and it makes no sense to go against the herd.

However, if you’re a fan of picking tops or bottoms and if you think that these strong trends are already exhausted, you shouldn’t be afraid to take a contrarian approach to your forex trades.

When all charts point to a single direction and the current market sentiment is supported by the newswires, it’s easy to understand why many traders hesitate to go against the herd.

But as investment pundit Warren Buffett famously said, “We should also be fearful when others are greedy and greedy when others are fearful.”

You see, just because a majority of the traders out there have a certain trading bias, it doesn’t necessarily mean that they’re right.

Sometimes, strong momentum merely reflects the entrance of trading amateurs that just go with the flow without knowing what’s driving price action.

This is why following the flock blindly can lead to herding bias – one of the 5 common trading mistakes traders make.

Ask anyone who has successfully tried trading against the herd and they will tell you that it can feel intimidating when your analysis leads you to an unpopular bias. But sometimes, it pays to go against the herd and be the odd one out – to be the contrarian.
Contrarian trading is a forex strategy that favors going against the current market bias in anticipation of a shift in market sentiment. It involves buying a currency when it is weak and selling it when it’s strong.

Contrarian traders try to take advantage of moments when the markets get carried away by strong momentum.

When everyone and his grandma is ready and willing to push prices higher, it can sometimes lead to overpriced assets. Likewise, when everyone is hell-bent on selling an asset, opportunities to buy at a bargain arise.

One of the main benefits of contrarian trading is that it allows you to get good prices and catch reversals right as they begin. In turn, this often leads to very attractive reward-to-risk ratios, giving you more bang for your buck.

However, contrarians trade against the trend, and that doesn’t always work out in their favor. As the saying goes, “the trend is your friend,” but it can be a mean son of a gun when you fight it.

When a trend is particularly strong, it can bust right throw potential reversal points and wash away those who go against the flow.

By no means am I saying that you should go against the trend just for the heck of it.
What I’m merely saying is that if, after thoroughly conducting your own fundamental and technical analysis, you have enough reason to believe that the market is about to turn, don’t be afraid to go against the herd and take a contrarian position.

Remember, you don’t always have to go with the flow; plenty of lucrative trading opportunities arise from straying from the crowd.

But always keep in mind that although contrarian trading can be rewarding, it’s not without its dangers.
Abdalla Mohamed Mahmoud Taha
Week Ahead in FX (Apr. 18 – 22): Consumer Data From U.K. and Canada And A PMI Parade From Major Economies

ready to get your pips in?

This week, we’re looking at retail sales data from Canada and the U.K. as well as a bunch of PMI reports from the major economies.

ICYMI, I’ve written a quick recap of the market themes that pushed currency pairs around last week. Check it!

Which calendar events will be under the spotlight and what are markets expecting? Here’s a list:

Major Economic Events:
China’s data dump (Apr 18, 2:00 am GMT) – In a few minutes, China will print its quarterly GDP and annualized retail sales, fixed asset investment, and industrial production numbers.

Annualized GDP is expected to improve from 4.0% to 4.2% but the rest of the reports are expected to reflect the impacts of higher energy prices and fresh COVID lockdowns in China’s key cities.


Canada’s inflation (Apr 20, 12:30 pm GMT) – Consumer prices rose by 1.0% from January but registered a 5.7% increase from a year ago in February. That’s the highest since August 1991!
Analysts see inflation accelerating to 6.0% in March. A high figure would not only justify the Bank of Canada’s (BOC) decision to raise its interest rates by 50 basis points to 1.00% but also set the stage for another 50-bp rate hike in June.

UK’s retail sales (Apr 22, 6:00 am GMT) – Increased confidence to go out and higher demand for services dragged retail activity 0.3% lower in February. This surprised GBP bulls who were celebrating a 1.9% gain in January.

Increased services spending and higher petrol prices are expected to slow retail trading further in March. Markets see a 0.1% decline with the annual rates slowing down from 7.0% to 2.9%. Yipes!

Global PMI reports – A parade of manufacturing and services PMIs from major economies is expected to paint a picture of the global economic growth.

Australia will start the program with its numbers scheduled on Thursday at 11:00 pm GMT and the U.K., Germany, France, Eurozone, U.K., and the U.S. will follow with their releases on Friday during the London and U.S. sessions.

ALL April PMIs are expected to print slightly lower figures but keep an eye out for significant upside or downside surprises!
Abdalla Mohamed Mahmoud Taha
How To Scale Out Of Positions

As mentioned earlier, scaling out has the obvious benefit of reducing your risk as you are taking away exposure to the market…whether you are in a winning or losing position.

When used with trailing stops, there is also the benefit of locking in profits and creating a “nearly” risk-free trade.

We’ll go through a trade example to show you how this can be done.
Example: Scaling out of EUR/USD
Let’s say you have a $10,000 account and you shorted 10k units of EUR/USD at 1.3000.

You placed your stop at 1.3100 and your profit target is 300 pips below your entry at 1.2700.
With 10k units of EUR/USD (pip value of this position is $1) and a stop of 100 pips, your total risk is $100, or 1% of your account.

A few days later, the EUR/USD has moved lower to 1.2900, or 100 pips in your favor. This means you have a total profit of $100, or a 1% gain.

All of a sudden, the Fed releases dovish comments that may weaken the USD in the short term.

You think to yourself, “This may bring dollar sellers back into the market, and I don’t know if EUR/USD will keep going down… I should lock in some profits.”

You decide to close half of your position by buying 5k units of EUR/USD at the current exchange rate of 1.2900.

This locks in $50 of profit into your account [at 5k units of EUR/USD, 1 pip is valued at $0.50…. you have closed a profit of 100 pips (100 pips x $0.50 = $50)]

This leaves you with an open position of 5k units short EUR/USD at 1.3000. From here, you can adjust your stop to breakeven (1.3000) to create a “risk-free” trade.

If the pair moves back higher and triggers your adjusted stop at 1.3000, then you close out the remaining position with no loss, and if it moves lower then you can just ride the trade to more profits.

Obviously, the trade-off for “taking some off the table” is that your original max profit is reduced.

Now, if EUR/USD ended up falling to 1.2700 and you had caught the 300-pip move with a 10k unit position of EUR/USD, then your profit would be $300.

Instead, you closed 5k units at a 100-pip gain for $50, and then you closed your remaining 5k at a 300-pip gain for a $150 gain ($0.50 per pip * 300 pips = $150).

Together, this makes a $200 gain versus your original $300 max profit.

Here’s a chart to help you visualize the different times when to scale out. (Ignore the dragon trying to bring his scales out.)
The decision to take some profit off the table is always up to you… you just have to weigh the pros and cons.

In this example, the trade-off is a better profit versus the peace of mind of a smaller locked-in profit and creating a risk-free trade.

Which is better for you?

50% more profit or being able to better sleep at night?

Remember, there is the possibility of the market moving beyond your profit target and adding more bling-bling to your account.

There’s always much to consider when adjusting trades, and with practice over many trades, you’ll find a process of taking off trades most comfortable to you.

Next up, we’ll teach you how to scale into positions.

You may be asking, “Why? Why would I wanna scale into a trade?”

Scaling into positions, if done correctly, will give you the benefit of increasing your max profit.

But as they say, “Higher reward means higher risk.”
If done incorrectly, the value of your account could drop faster than you can even think about clicking the close button on your trade.

Before you know it, you’ll be staring at your computer screen, eyes wide open watching your account get margin called.

Now we don’t want that to happen right?

So pay attention in class!

What separates “the correct way” from “the incorrect way” is the profitability of your open position when you add, how much more you add, and how you adjust your stops.

In the next two sections, we’ll teach you two potential scenarios for scaling into a position.

Since traders are “risk managers” first, we’ll also touch upon the “No, No’s” of adding to an open position.
Abdalla Mohamed Mahmoud Taha
profit todya with great profit EA on gbp-usd

11/10/2021
Abdalla Mohamed Mahmoud Taha
profit todya with great profit EA on gbp-usd
Abdalla Mohamed Mahmoud Taha
profit today with gbp news 4/11/ 2021
natiijo90
natiijo90 2021.12.03
What is the name of this EA please?
Abdalla Mohamed Mahmoud Taha
Market Maker

A market maker is a financial intermediary that stands ready to buy or sell assets by continuously quoting bid and ask prices that are accessible to other traders or registered participants of a trading platform.

A market maker is an individual or institution that buys and sells large amounts of a particular asset in order to facilitate liquidity.

In practice, a market maker, also known as a liquidity provider, is a company or individual that quotes the bid and ask price of any commodity or financial product in order to make a profit from the bid/ask spread.

A market maker is a market participant that buys and sells large amounts of a particular asset in order to facilitate liquidity and ensure the smooth running of financial markets.

An individual can be a market maker, but due to the quantity of each asset needed to enable the required volume of trading, a market maker is more commonly a large institution.

Market makers will have a certain amount of the asset (or assets) that they deal in.

By displaying a buy and sell quote and executing trades at those prices rapidly, market makers can create a straightforward way to place trades.

They are most common in stock trading but can also act in other markets.

If we take the stock market, a market maker can only sell the number of shares that they can acquire themselves.

However, they are obliged to meet the Normal Market Size (NMS), the minimum number of securities, which varies from share to share.

The meaning of market maker comes from the practice of setting market prices at levels needed for supply and demand to find balance.

When markets become volatile, market makers have to remain stable and continue to be responsible for market performance, which opens them up to a large amount of risk.

This is why market makers make their money by maintaining a spread on the assets that they enable you to trade, to compensate for the risk of buying an asset that may devalue.

How do market makers make money?
To compensate for the risk of buying an asset that may devalue, market makers maintain a spread on the assets that they enable you to trade.

For example, a market maker may offer to purchase 100 equities from you at $10 each (the ask price), and then offer to sell them to a buyer at $10.02 (the bid price).

Though this is only a $0.02 difference, in high-volume trading, the profits will soon add up.

Buy me a coffee
Find this content helpful? Support our efforts by buying us a
Abdalla Mohamed Mahmoud Taha
RBA to Keep the Downtrend in EUR/AUD Going?

We’ve got a big catalyst for the AUD right around the corner, making the longer-term downtrend in EUR/AUD one to watch for potential trade opportunities. Will the RBA keep the sell momentum going?

Downtrending charts don’t get much cleaner or more textbook than the four hour chart of EUR/AUD above. The pair has been in a serious downtrend since mid-September, likely on speculation that the Reserve Bank of Australia will have to tightening monetary policy sooner than previously expected due to high inflation.

This is a very different situation than the euro as Europe has see economic growth slow over the past month, as well as experience energy and supply chain issues, lowering the odds significantly that the ECB will take tightening action on monetary policy to combat their inflation issues.

Well, we’re going to hear from the RBA very soon as they will give their latest monetary policy statement in the upcoming Asia session at 3:30 am GMT. Expectations are for the RBA to hold on policy, but may get more hawkish on the time of its possible rate hike, currently expected in 2024.

Now, after a massive run to the downside like we’ve seen in EUR/AUD (from 1.6237 to 1.5360, a roughly 5.35% move), it’s perfectly normal to expect a “buy-the-rumor, sell-the-news” scenario may play out, as some traders would likely take some profits no matter what the RBA says. If we get the expected scenario of no policy moves and hawkish rhetoric from the RBA, then a pop higher after the event is one to watch for a potential opportunity to jump in the downtrend at better prices, possibly around the falling trendline or previous strong area of interest around the 1.5500 major psychological level.

We also have to be open to the possibility of a downside break of current support if the RBA does sound hawkish, and if the market does break lower, we’ll be on the lookout for sustained trade below that 1.5350 area before considering setting up a short position.

In the low probability scenario where the RBA maintains no rate hikes until 2024 or beyond (possibly on covid fears or export weakness due to falling demand or supply chain issues), then that raises the probability of a swing move to the upside developing pretty quickly. In that scenario, we’ll be on the lookout for a sustain break above the falling trendline and 1.5500 level before considering a short or swing term position long.

What do you all think? Will the RBA keep the Aussie bull train going? Let me know in the comments section below!
Abdalla Mohamed Mahmoud Taha
GBP/USD Intraday: under pressure.

Anchor point:
1.3670

Favorite scenario:
Short positions below the 1.3670 level, with targets at 1.3630 and 1.3610.

Alternative scenario:
Above 1.3670, targeting 1.3690 & 1.3710 as targets.

Technical Comment:
RSI is mixed with a bearish bias
Abdalla Mohamed Mahmoud Taha
Weekly Forex Market Recap: Oct. 25 – 29

Central bank events and inflation data appeared to be the main drivers for FX this week, and likely why currency price action was relatively limited to choppy, short-term moves as traders waited on the sidelines.

Overall, the Aussie dollar took the top spot thanks to high inflation updates and rate hike speculation, while traders looked bearish on the euro all week, possibly on low expectations of rate hike rhetoric and weak economic updates from the Euro area.

Notable News & Economic Updates:
Moderna says covid shot for younger kids showed strong results

Turkish lira bounces back from record low on Tuesday after Erdogan soothes diplomatic fears

Bank of Canada accelerates potential timing of rate hikes top possibly Q1 or Q2 of 2022

European Central Bank holds stimulus operations at €1.85T; will keep through March 22 or later if needed

U.S. shows weakest quarter of growth on supply woes; Advanced read of third quarter GDP at 2.0% vs. 6.7% in Q2

Bank of Japan holds monetary policy as-is as it lowered outlook for growth & inflation

China Evergrande is said to make another bond payment, avoiding default for a second time.

GDP up by 2.2% in the euro area and by 2.1% in the EU; Eurozone inflation rises to 4.1% in Oct. (13-year high)

FDA authorizes Pfizer’s Covid vaccine for kids ages 5 to 11

Intermarket Weekly Recap
Dollar, Gold, S&P 500, Oil, T-Bond Futures, Bitcoin Overlay 1-HourDollar, Gold, S&P 500, Oil, T-Bond Futures, Bitcoin Overlay 1-Hour
Price action was a mixed bag this week across the financial markets as each asset class seemed to be moving to the beat of their own drums.

Equities stayed green this week with another net positive round of earnings releases, while bond prices rose/bond yields fell on Wednesday, possibly on lowered expectations of Fed tightening as we saw weak U.S. export data and retailer supply data hint at a lower growth outlook. Also risk sentiment was arguably negative to start the week, likely on the continued Chinese property developer issues and fears of debt defaults.

Oil fell earlier this week but eventually found a bid, likely on comments from OPEC who forecasted that a tighter global oil market may be ahead in the fourth quarter. U.S. inventory data was also a likely contributor to the bounce in oil prices (market nearly retested $80/barrel on WTI) as it showed supply shrink rapidly (supply fell by 1.81M barrels last week.

In the crypto space, bitcoin pulled back from all-time highs as ETF euphoria likely faded. This seemed to have pulled most of the crypto space with it, with exception to meme coins. Shiba Inu (SHIB) coin once again rocketed higher to new all-time highs after last week’s consolidation, gaining over 100% intraweek before pulling back. It’s likely the push for Robinhood to list the meme coin is the main catalyst, and seems to be dragging other meme coins higher with it like the previous meme coin king, Dogecoin.

Looking at the FX charts below, we can see that the forex markets traded mostly sideways, with few pops of volatility here and there. It appears this week’s round of inflation updates and central bank events were the main focus for currency traders, and likely kept many on the sidelines to avoid possible event risk.

There were no major surprises as all central banks held off from interest rate changes for now and most re-iterated uncertainty with inflation expectations, but the Bank of Canada did shake things up a bit by ending their bond buying program on Wednesday. They also hinted that interest rate hikes may come sooner than expected, possibly in the first or second quarter of 2022.
Abdalla Mohamed Mahmoud Taha
USDJPY
Expected proactive wave trajectory of price movements in the medium to long term on the 12-hour time frame

The current expected wave arrangement for the five-impulsive bullish wave, awaiting the breach of 114.70, with the positive momentum remaining in the direction of the 116 barrier.
Abdalla Mohamed Mahmoud Taha
USDJPY - H1
Buy the pair around 114.25 with a target price of 114.88

alternative scenario
Selling the pair around 113.88 with a target price of 113.20

comment
Trading above support and averages favors a rise.