Market Structure Patterns
- Indicadores
- Samuel Manoel De Souza
- Versão: 3.14
- Atualizado: 19 abril 2024
- Ativações: 20
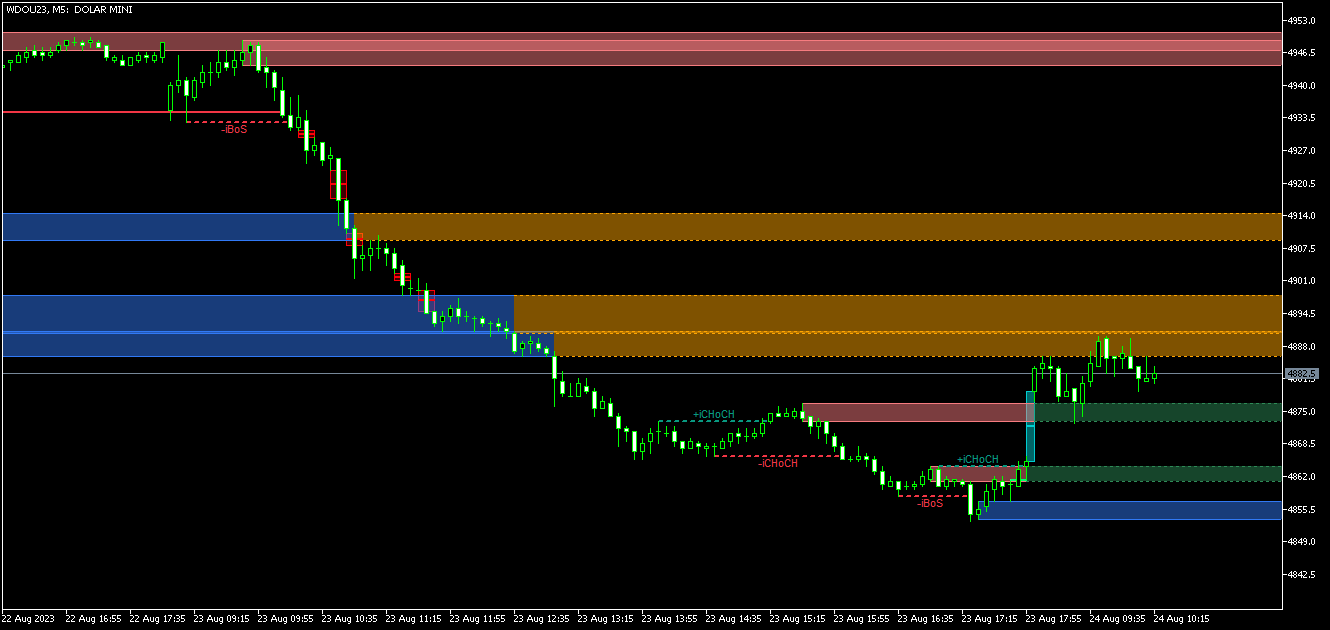
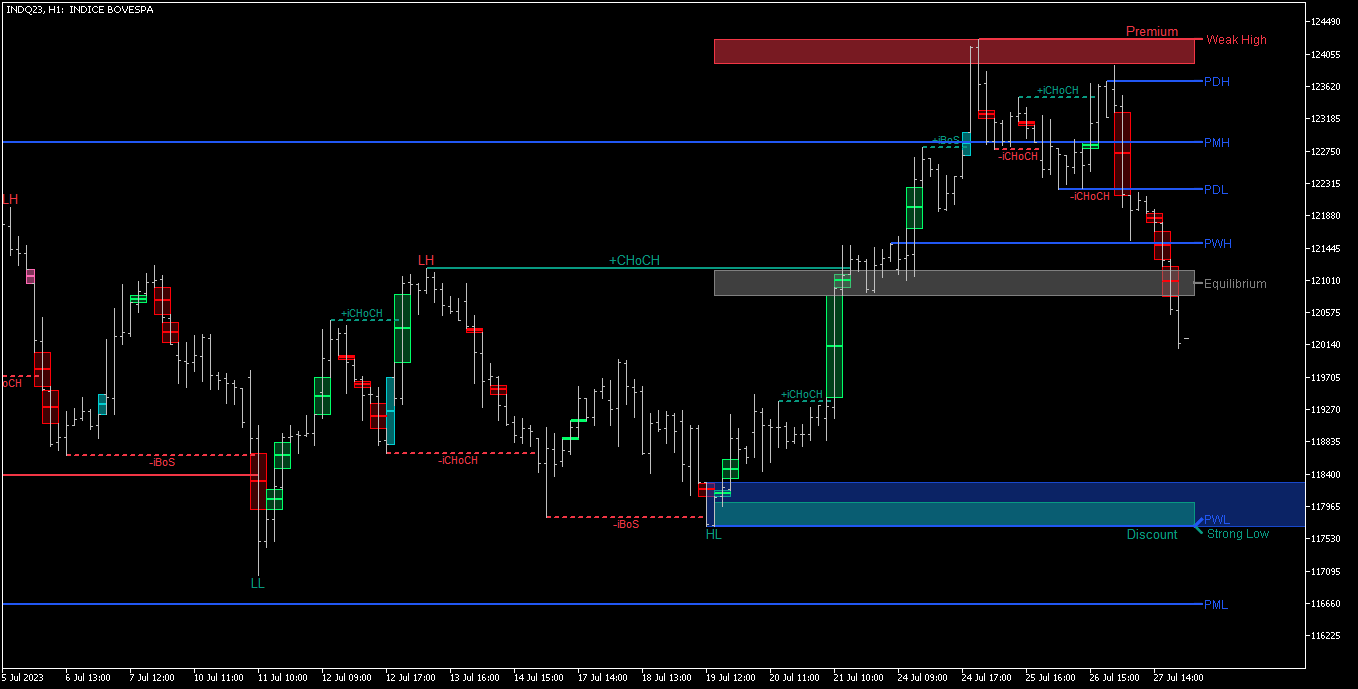
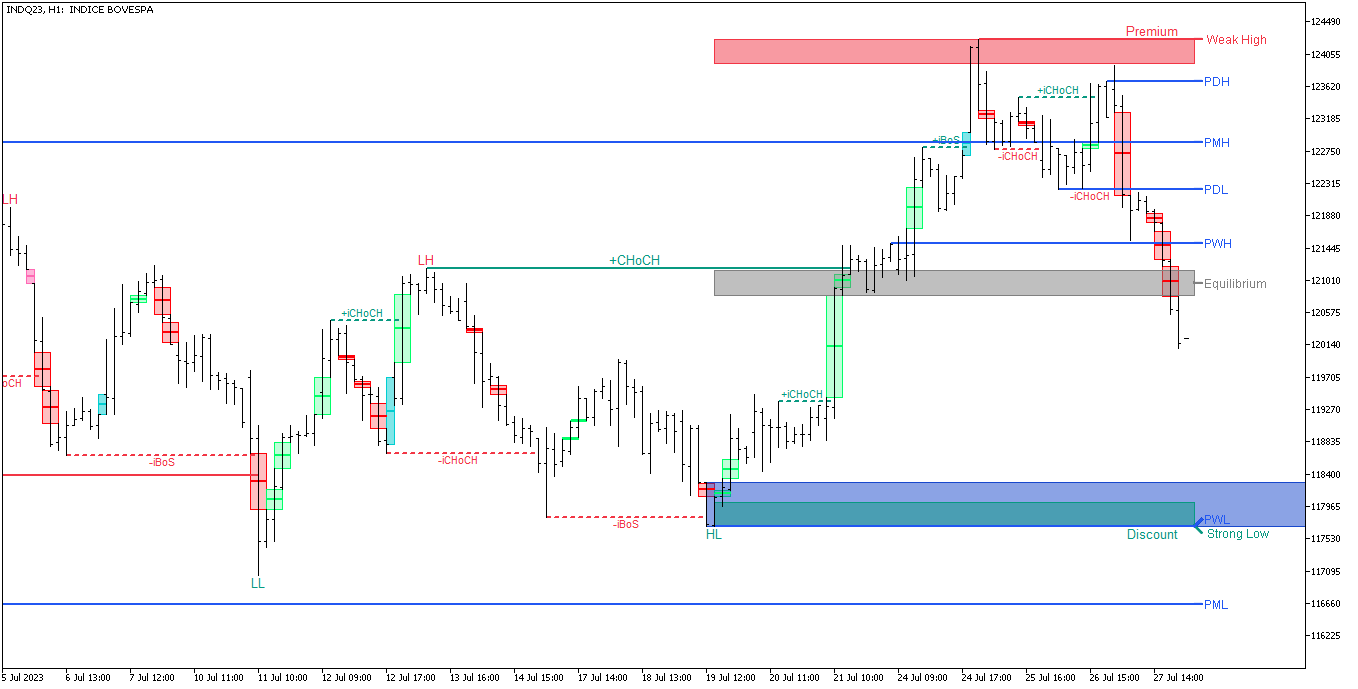
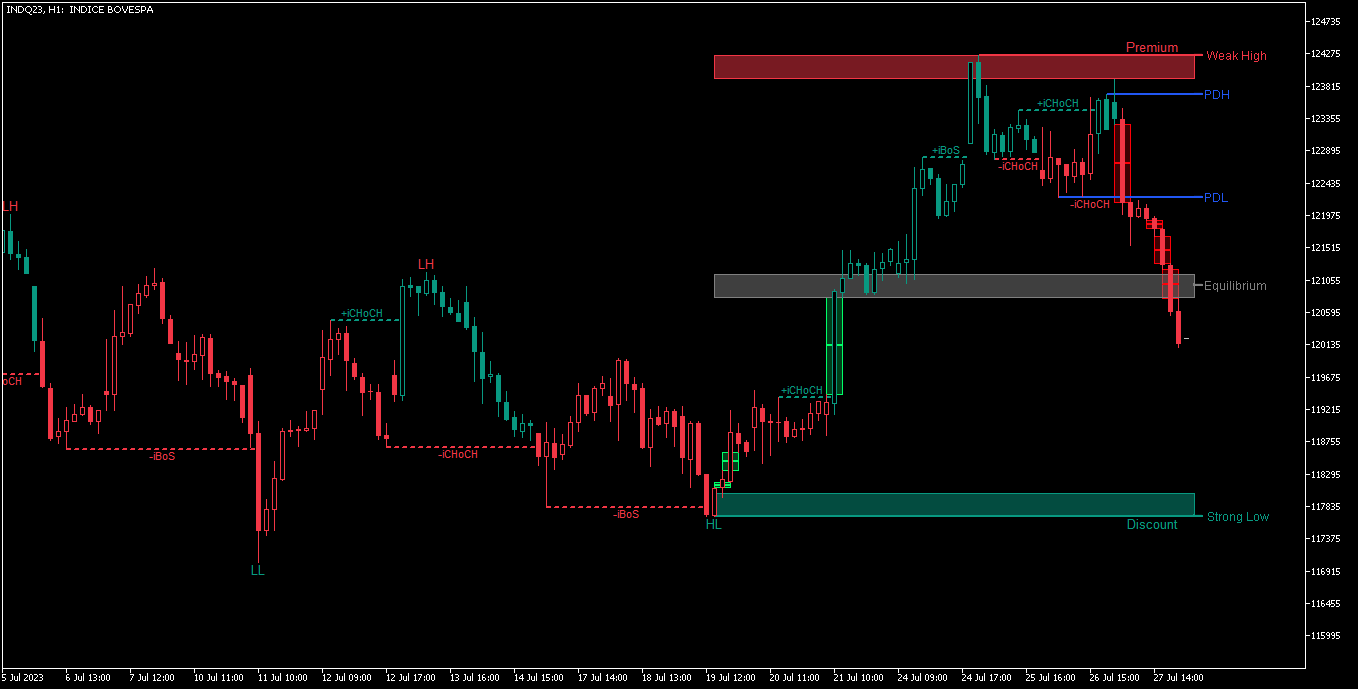
Market Structure Patterns is an indicator based on smart money concepts that displays almost all of the SMC/ICT elements needed to take your trading decisions to the next level. Take advantage of the alerts, push notifications and email messages to keep informed from when an element is formed on the chart, the price crosses a level and/or enters in a box/zone. Developers can access the values of the elements of the indicator using the global variables what allows the automation of trading decisions based on SMC/ICT strategies.
Some additional features included are:
- Allows to customaze not only the colors of the elements but also the opacity of them
- Optionally can display the labels using bubble style
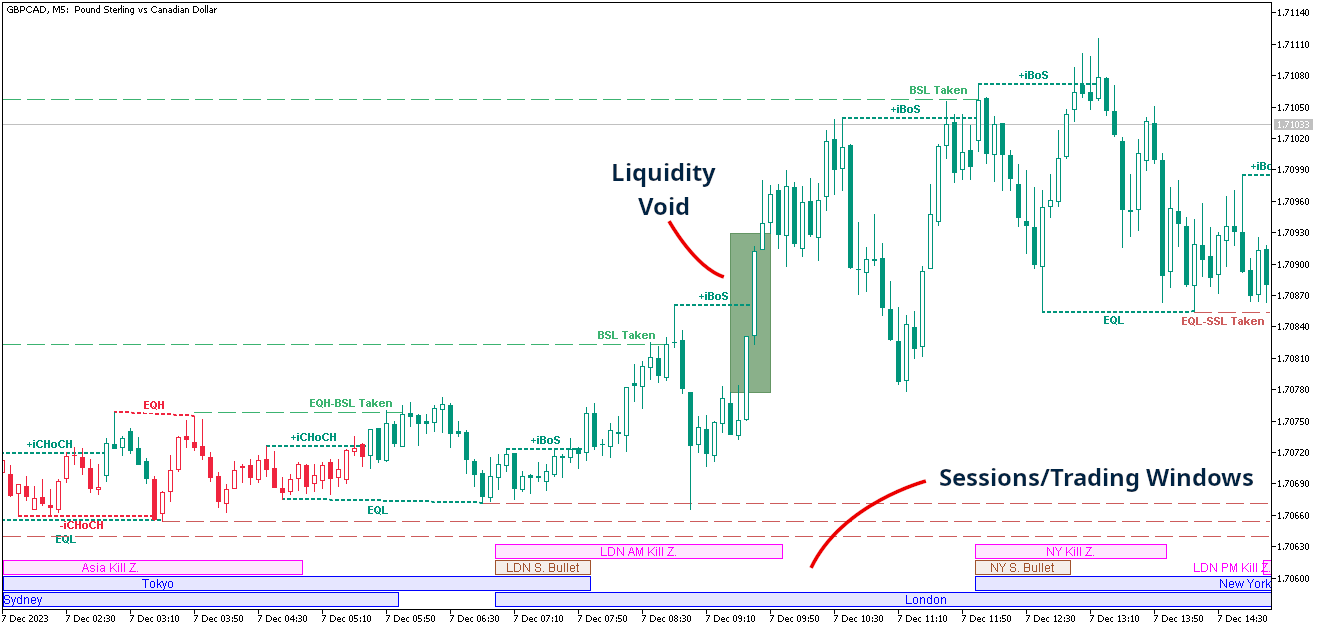
- Sessions/Trading windows can be displayed either over the price chart or on bottom using a timeline style
- Exclusive algorithm to avoid labels/text overlapping
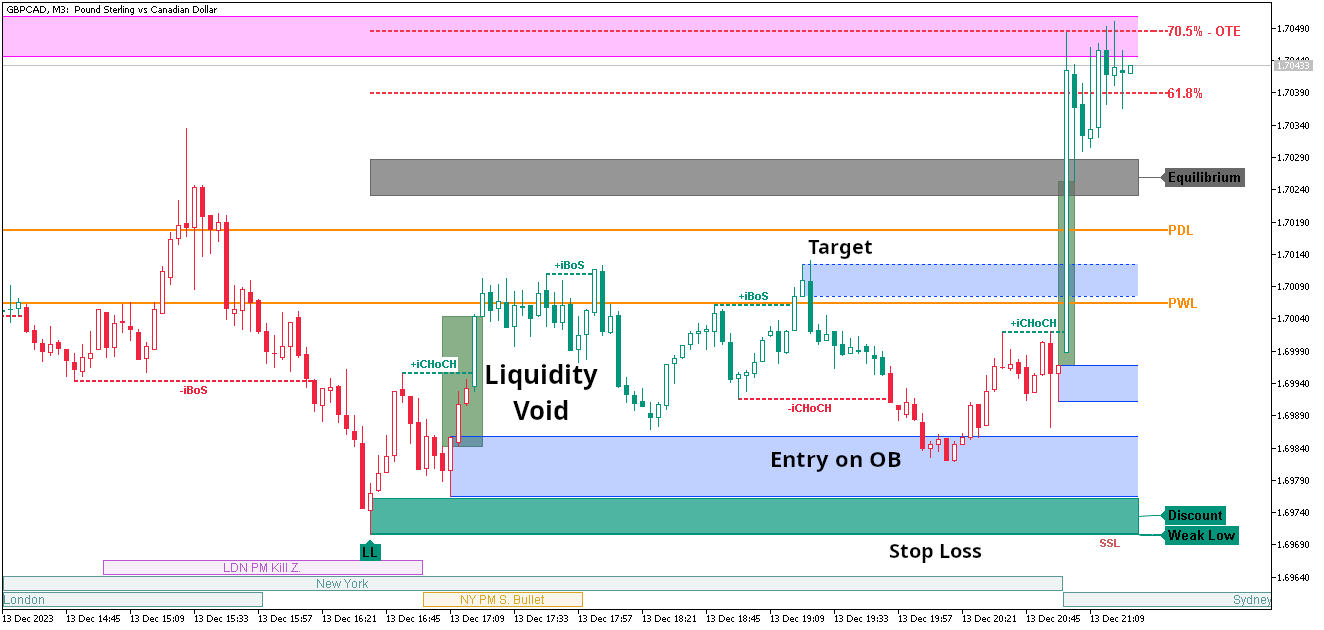
- Liquidity voids algorithm created exclusive for this indicator
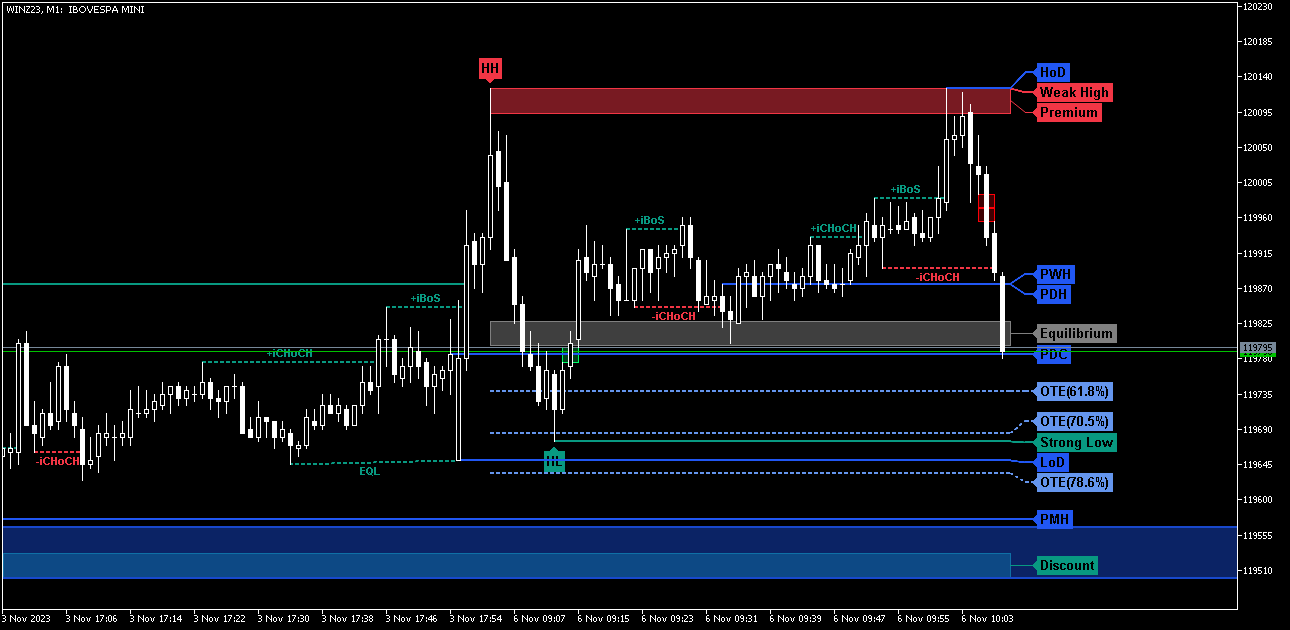
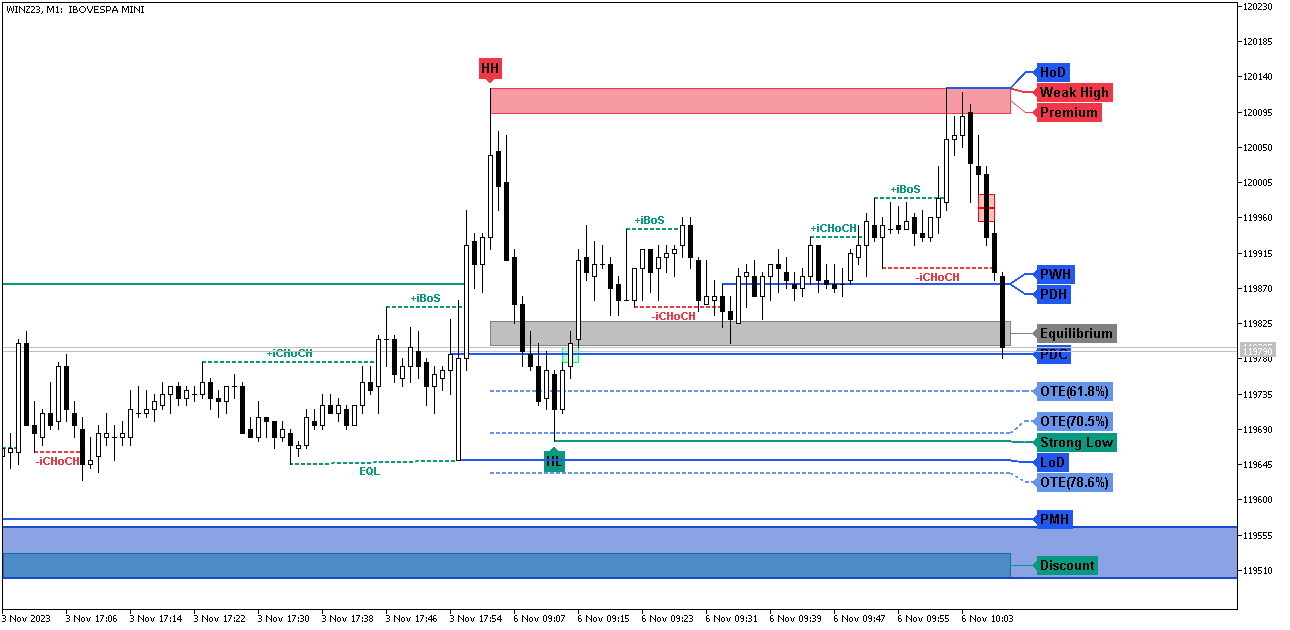
The indicator also paints the candlesticks depending on the trend and/or internal and swing trend alignment. This feature can be enabled in the parameter "Color Candles". By default the trend is show as green for bullish trend and red for bearish trend. Among with the trend the candlesticks can be filled or not giving the hability to recognize bullish and bearish candlesticks.
--> Learn more about market structure
--> Join the study group, share you knowledge and trading ideas with other traders.
Elements and/or Abreviations:
The elements present in the indicator are listed down with their abreviations when applied:
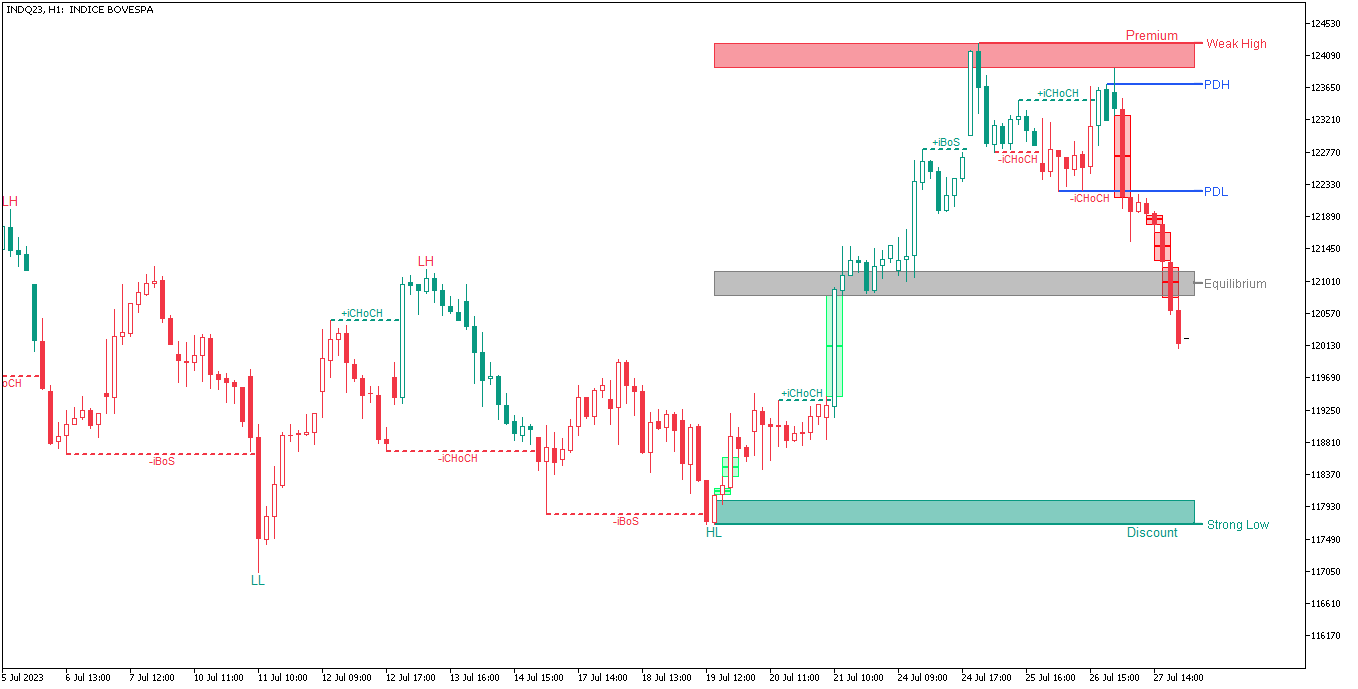
- Premium, Equilibrium and Discount zones
- Strong/Weak High/Low
- Automatic Fibonacci
- OTE - Optimal Trade Entry
- HH, HL, LH, LL- Higher highs, higher lows, lower highs and lower lows
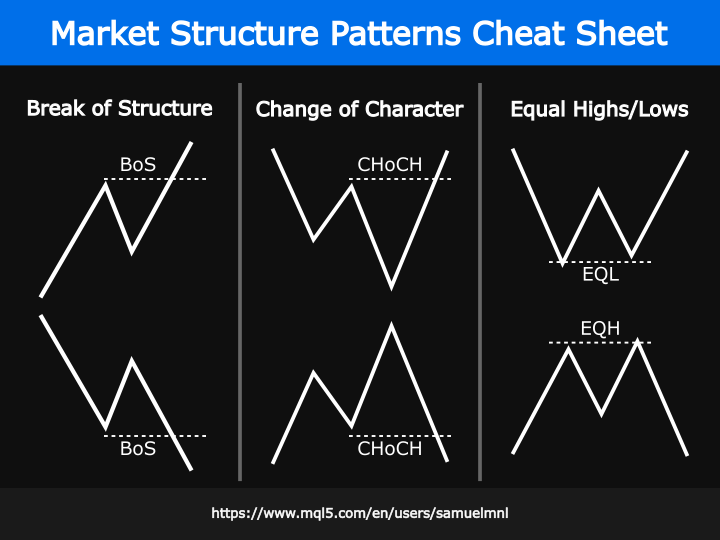
- EQH, EQL - Equal highs and Equal lows
- BSL, SSL - Buy Stops Liquidity and Sell Stops Liquidity
- EQH-BSL, EQL-SSL - Buy Stops Liquidity on Equal Highs and Sell Stops Liquidity on Equal Lows
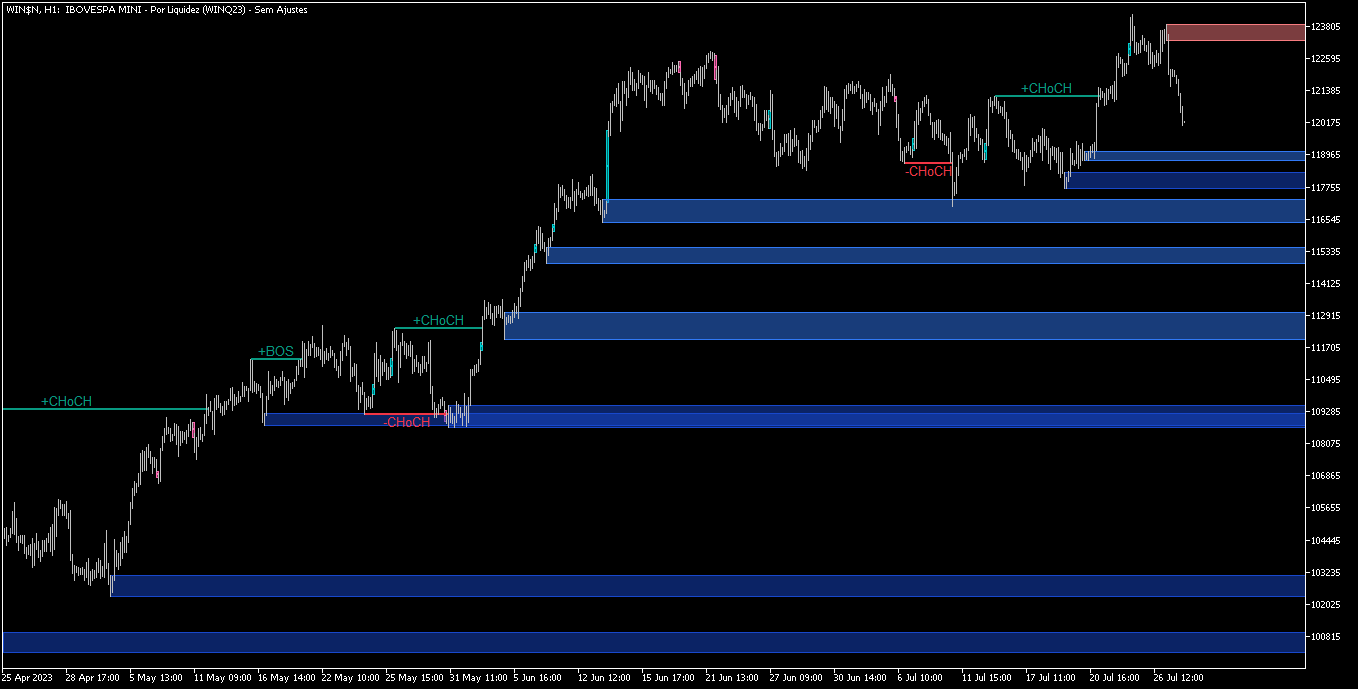
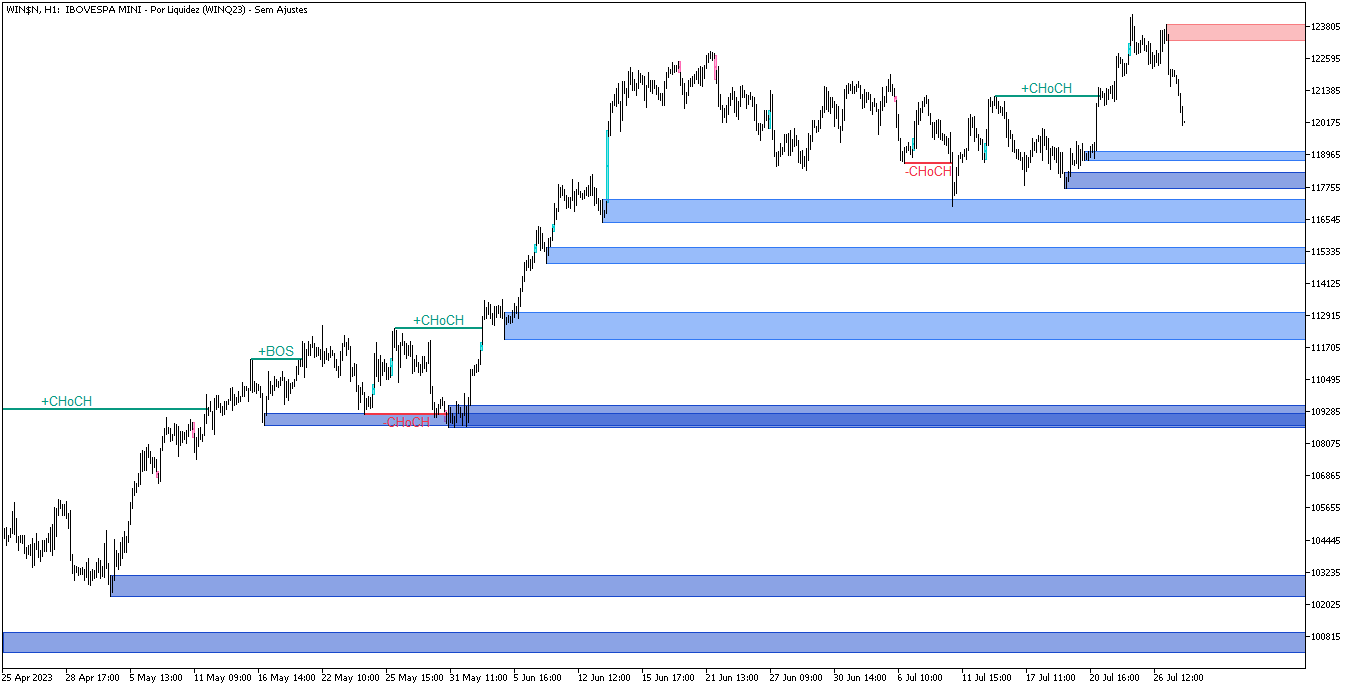
- BoS, iBoS - Break of structures and Internal Break of Structure
- CHoCH, iCHoCH - Change of character and Internal Change of Character
- OB, iOB - Order Blocks and Internal Order Blocks
- BB, iBB - Breaker Blocks and Internal Breaker Blocks
- Liquidity voids
- FVG - Fair Value Gap
- InvFVG - Inverse Fair Value Gap
- ImpFVG - Implied Fair Value Gap
- OG - New Day Opening Gap
- HoD, LoD, OoD - High of the day, Low of the day and Open of the day
- PDH, PDL, PDO, PDC - Prior day high, low, open and close
- PWH, PWL , PWO, PWC - Prior week high , low, open and close
- PMH, PML , PMO, PMC - Prior month high , low, open and close
- Sessions
- Kill Zones Trading Window
- Silver Bullet Trading Window
The access to order blocks and structure breaks values through global variables can be made using the names conventions as follow:
All global variables is prefixed with "SMP-"+_Symbol+"("+TIMEFRAME+")", for example "SMP-EURUSD(H4)".
For order blocks:
- Add "-IOB" for internal order blocks or "-OB" for swing order blocks;
- Add "-Total to get the amount of order blocks on the charts;"
- Add "[index]-Top" and/or "[index]-Bot" to get the order blocks values.
For structure breaks:
- Add the pattern name as displayed on the chart. For example, +iCHoCH can be accessed by "SMP-EURUSD(H4)-+iCHoCH"


This 3.0 update just made this indicator 10x more powerful and undervalued at the same time! Sam is simply the best! Keep it up!