• Visão global
  • Comentários
  • Discussão
  • O que há de novo

RSIScalperPro

Introducing RSIScalperPro - the revolutionary RSI-based indicator for Metatrader 5, specifically designed for scalping in the one-minute chart. With RSIScalperPro, you'll have a powerful toolkit for precise entry and exit signals to take your trading to the next level.

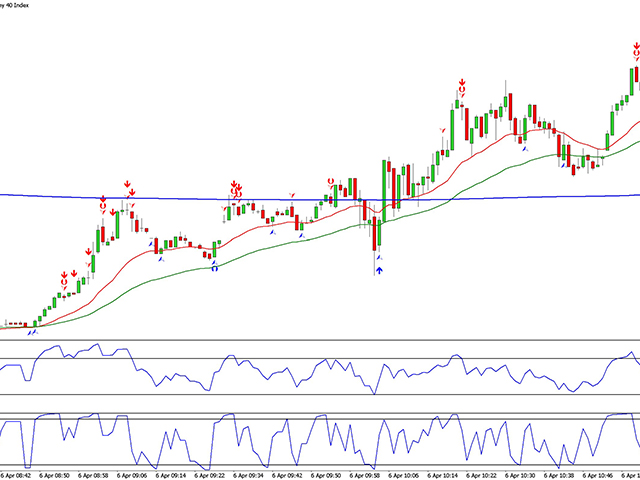
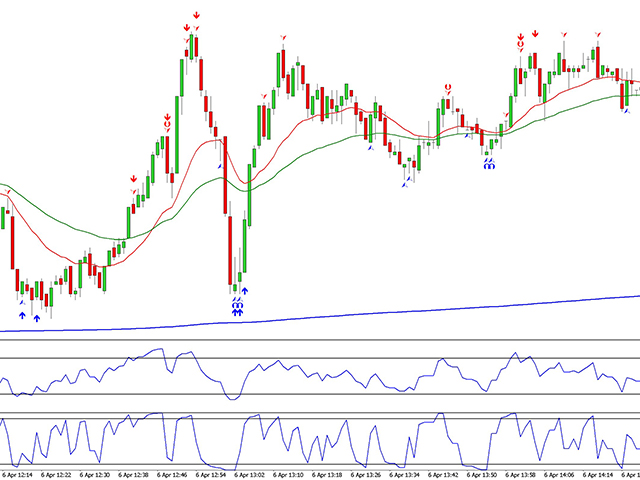
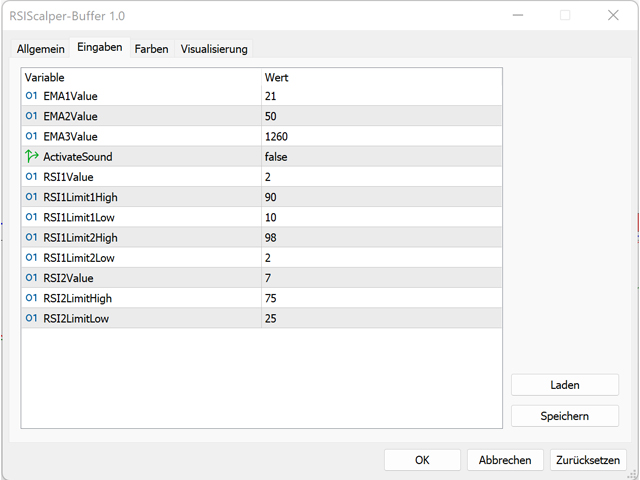
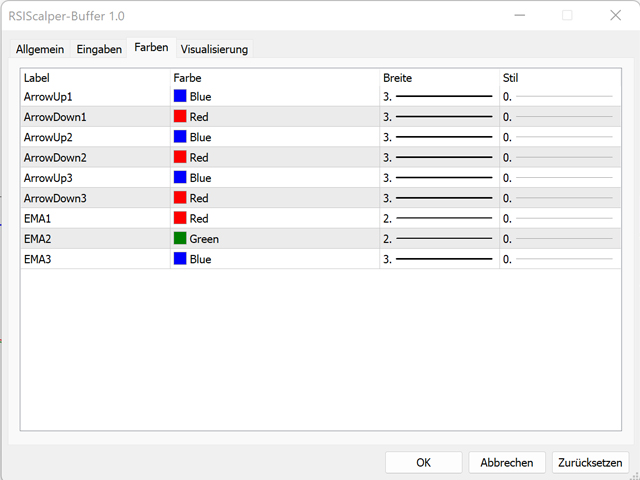
RSIScalperPro utilizes two different RSI indicators that provide clear signals for overbought and oversold areas. You can customize the time periods and limit values of the two RSIs according to your preferences to achieve the best results for your trading strategy. The distinct arrows on the chart make it easy to identify when to enter or exit a trade.

Another highlight of RSIScalperPro are the three customizable moving averages that help you identify trend direction and confirm strong trading signals. This allows you to spot trends early and participate in profitable trades.

Furthermore, you can set up RSIScalperPro to emit an audible alert with each new trading signal. This ensures that you won't miss any important trading opportunities, even if you're not constantly in front of your computer screen.

RSIScalperPro offers a user-friendly interface and is easy to insert and configure in Metatrader 5. You can customize the indicator to match your individual trading preferences and take advantage of its diverse features to improve your trading results.

Take advantage of the benefits of RSIScalperPro and enhance your scalping success rate in the one-minute chart. Get RSIScalperPro today and experience the power of precise signals, customizable settings, and audible alerts for an effective and profitable trading experience.


Produtos recomendados
This Indicator adding power to traditional zigzag indicator. With High-Low numbers in vision it will be easier to estimate change of trend by knowing the depth of each wave. Information including points, pips, percentage%, and #bars can be displayed based on configuration. All information is real-time update. This indicator is especially useful in sideway market to buy low sell high.
The Beta index, also known as the Beta indicator, is one of the key reference indicators for hedging institutions. It allows you to measure the relative risk of individual assets, such as currencies and commodities, in comparison to market portfolios, cross-currency pairs, the U.S. dollar index, and stock indices. By understanding how your assets perform in relation to market benchmarks, you will have a clearer understanding of your investment risk. Key Features: Accurate Risk Assessment: The Be
Este indicador do painel de controle de zona de oferta e demanda com vários períodos e vários símbolos envia alertas quando o preço atinge uma zona de oferta / demanda. Também é possível usá-lo para ser alertado sobre topos / fundos duplos regulares em vez de zonas. Ele pode ser usado com todos os intervalos de tempo de M1 a MN.       No máximo 9 períodos de tempo podem ser mostrados no painel ao mesmo tempo.   É possível usar RSI, divergência (MACD, OsMA, RSI ou Awesome) e filtros de padrões de
Intraday Vwap Orion
Joao Paulo Botelho Silva
Fundamentação teórica A VWAP é uma média móvel ponderada pelo volume, trazendo maior relevância para os preços. O cálculo base da VWAP segue a fórmula clássica descrita no Investopedia ( https://www.investopedia.com/terms/v/vwap.asp ). VWAP = sum(typical price[i]*volume[i]) / sum(volume[i]) Funcionalidades A VWAP Orion inova ao permitir que o usuário escolha dentre os convencionais períodos Diário, Semanal e Mensal, tendo também a opção de cálculo do indicador Intraday, como utilizado em outro
Vwap RSJ
JETINVEST
4.88 (8)
VWAP RSJ é um indicador que representa as linhas horárias, diárias, semanais e mensais do VWAP. Grandes compradores institucionais e fundos mútuos usam o índice VWAP para ajudar a entrar ou sair de ações com o menor impacto possível no mercado. Portanto, quando possível, as instituições tentarão comprar abaixo do VWAP ou vender acima dele. Dessa forma, suas ações empurram o preço de volta para a média, em vez de afastá-lo dela. Com base nessas informações, desenvolvi este indicador que comb
FREE
UGenesys Volume MT5
Odaine Ramon Mcmillan
50% Off Today Only! Price Goes Back Up at 11 PM (EST) uGenesys Volume Indicator: Your Key to Mastering Market Volume Analysis What Traders Are Saying: "A must-have indicator...really a game-changer." – wuzzy66 "Amazing indicator...strongly recommend to beginners." – joinbehar Understanding Market Volume:   Volume in the market is a critical indicator of movement and opportunity. The uGenesys Volume Indicator is specially crafted to pinpoint when the market has the most volume, allowing you to
Vwap Bands Auto
Ricardo Almeida Branco
O indicador Vwap Bands Auto busca mapear automaticamente a frequência máxima do mercado ( atualização automática da banda mais externa ) e possui duas bandas intermedíarias que também se ajustam à volatilidade diária. Mais uma ferramenta da White Trader que combina preço e volume, além de mapear a amplitude diária. A banda externa é atualizada automaticamente quando a máxima ou mínima diária rompe a frequência atual, e pode ser um sinal de entrada, buscando o retorno à vwap diária. Desta ma
Ultimate Hero MT5
Smart Forex Lab.
Criado para um desempenho máximo. Optimizado para retiradas de lucros. Introduzindo uma nova opção - teste com emulação de retiradas de lucros. Ultimate Hero é uma ferramenta de negociação avançada concebida para maximizar os seus lucros forex. Este software de negociação avançado é criado usando a mais recente tecnologia GPT-4 e tem uma ampla gama de recursos avançados. O Ultimate Hero é um robot de negociação que utiliza uma estratégia de negociação em grelha baseada no sistema Martingale. F
The indicator colors the candles relative to their volume delta. The calculation of the candles delta is based on the tick history or on the deals tape history (see below for a description of the input variable "Volumes"). Coloring is performed by two parameters : by delta sign, as candle color, by delta value, as candle color contrast against chart window background color. In addition to coloring the candles, the indicator also displays the delta profile on the interval specified by the user
Vision AGI
Franck Martin
4.78 (9)
Vision AGI is the result of over a year of development to create this expert. Equipped with an advanced algorithm and a combination of personalized indicators, this new version is even more powerful, making it one of the most complete robots of its generation. With its intelligent real-time technology and trading strategy inspired by the best traders, it offers reliable long-term trading and knows how to adapt to the situations it encounters over time. *** Compatible with Prop Firm ***   (see b
To get access to MT4 version please click here . - This is the exact conversion from TradingView: "Twin Range Filter" by "colinmck". - The screenshot shows similar results from tradingview and Metatrader when tested on ICMarkets on both platforms. - This is a light-load processing and non-repaint indicator. - All input options are available.  - Buffers are available for processing in EAs. - You can message in private chat for further changes you need. Here is the code a sample EA that operated b
The Market Structures Pro indicator finds and displays 5 (five) patterns of the Smart Money Concepts (SMC) system on the chart, namely: Break Of Structures (BoS)       Change of character (CHoCH) Equal Highs & Lows Premium, Equilibrium and Discount zones with Fibo grid High-high, Low-low, High-low and Low-high extremes Patterns are displayed for two modes - Swing and Internal and are easily distinguished by color on the chart. Internal mode features higher contrast colors, finer lines, and smal
The Effort and Result indicator is based on the work of Karthik Marar; a volume spread analysis trader. It compares a price change (Result) to the volume size (Effort) for a certain period.  By comparing the effort and result, we can get more information about the future price movement. Both values are normalized and converted to a scale of 0 - 100 % based on a selectable look-back period. This indicator is also known as the Effort Index. The law of effort and result The law of effort vs. res
Este indicador antecipa reversões de preços analisando as pressões de alta e de baixa no mercado. A pressão de compra é a soma de todas as barras de acumulação ao longo de um determinado número de dias, multiplicada pelo volume. A pressão de venda é a soma de toda a distribuição no mesmo número de barras, multiplicada pelo volume. [ Guia de instalação | Guia de atualização | Solução de problemas | FAQ | Todos os produtos ] A proporção do indicador fornece uma medida da pressão de compra como uma
Here I present you this awesome indicator I made. This is a nique combination witch puts you in the same level as MM's. So you can surf a lot of waves and identify the rally time, breakouts, and the perfect time to get in the market. ---- The SSL Channel is a great all-rounder based on 2 Simple Moving Averages, one of recent Highs, one of recent Lows. The calculation prints a   channel   on the chart consisting of 2 lines. This strategy gives a Long signal when price closes above the top of thes
EverGrowth Pro MT5
Canberk Dogan Denizli
Se você está procurando uma perspectiva pragmática para seus futuros empreendimentos comerciais, permita-me apresentar EverGrowth. Você está cativado pela noção de se envolver em atividades de negociação com um EA profissional completo, compreendendo uma extensa base de código de aproximadamente 6800 linhas? O EverGrowth possui uma infinidade de recursos e indicadores, priorizando a autenticidade ao replicar fielmente os resultados dos testes em condições reais de mercado. Ele aproveita funcion
Big Players Last Fight
Flavio Javier Jarabeck
5 (2)
A very useful Price Action point is the previous day Closing VWAP. We call it Big Players Last Fight . This indicator will draw a line showing on your chart what was the last VWAP price of the previous trading session. Simple and effective. As an additional bonus, this indicator saves the VWAP value on the Public Terminal Variables, so you EA could read easily its value! Just for the "Prefix + Symbol name" on the variables list and you will see! SETTINGS How many past days back do you want to s
FREE
Horizontal Volumes Indicator - using a histogram, displays the volume of transactions at a certain price without reference to time. At the same time, the histogram appears directly in the terminal window, and each column of the volume is easily correlated with the quote value of the currency pair. The indicator practically does not require changing the settings, and if desired, any trader can figure them out. The volume of transactions is of great importance in exchange trading, usually an inc
Note: If you want to apply this indicators on indicators which are shown in a sub-window, then consider using this indicator instead:  https://www.mql5.com/en/market/product/109066.&nbsp ; AIntel Predict - Your Gateway to Future Trading Success! Unlock the power of predictive analytics with AIntel Predict. Say goodbye to the guesswork and hello to improved forecasting, as AIntel Predict leverages historical data to unveil the future of your trades like never before. Whether you're a seasoned tra
BitcoinPrinter
Robin Amede Aleksic
->NO MARTINGALE, NO GRID, NO HEDGING   ->TREND FADING STRATEGY WITH MULTIPLE MOVING AVERAGE MECHANISM  -> 1H Timeframe ->BTCUSD ->No Set Files needed , standart settings will propably work well, but you can still optimize the EA in MT5 Key Features: Tailored for Bitcoin:   This EA has been specifically designed to trade Bitcoin, leveraging its unique market dynamics to maximize profits while minimizing losses. Outperforming the BTC Price:   In the past, this trading robot has consistently outp
FREE
Seasonal Pattern Trader
Dominik Patrick Doser
Disclaimer : Keep in mind that seasonal patterns are not always reliable. Therefore, thoughtful risk management is crucial to minimize losses.  Seasonal patterns in the financial world are like a well-guarded secret that successful investors use to their advantage. These patterns are recurring price movements that occur during specific periods or around special events. Additionally, there are also intraday patterns that repeat. For example, Uncle Ted from Forex Family suggests examining previou
Pullback Probability It is an indicator that shows us the probability that the price will t urn around and we can operate that market turn. The indicator marks a line that oscillates between a percentage of 0% to 100%. The one indicated in the upper left corner shows us a help in which it informs us of the area in which the price is in real time, as well as the percentage that the candle is open. You can download the demo and test it yourself. The indicator marks 6 work zones. 1) Above 80% t
Value Chart Candlesticks
Flavio Javier Jarabeck
4.73 (11)
The idea of a Value Chart indicator was presented in the very good book I read back in 2020 , " Dynamic Trading Indicators: Winning with Value Charts and Price Action Profile ", from the authors Mark Helweg and David Stendahl. The idea is simple and the result is pure genius: Present candlestick Price analysis in a detrended way! HOW TO READ THIS INDICATOR Look for Overbought and Oversold levels. Of course, you will need to test the settings a lot to find the "correct" one for your approach. It
FREE
Relative Strength Levy Classic
Bruno Goncalves Mascarenhas
Relative Strength Levy   RSL Indicador Classico MT5   RSL Classico Este é o indicador clássico  "Relative Strength Levy" (RSL)   , de acordo com o estudo do Dr. Robert Levy, chamado  "O conceito de força relativa da previsão de preços de ações comuns",   que foi lançado como livro de capa dura no final dos anos 60 do século passado. Conceito chave Use este indicador em vários instrumentos para comparar sua força relativa: Os valores resultantes da análise irão oscilar em torno de 1 Os instrumen
Equidistant bands indicator with calculated moving average, allows you to configure the band size and can be used freely as an entry / exit indicator. Buffer 0 = price, buffer 1 = upper band, buffer 2 = lower band. you can also configure the periods of moving averages used in the calculations and also the shift to previous bars in addition to the price that can CLOSE (default) or OPEN. Excellent for fast daily moving pairs and frequent returns.
FREE
Este indicador é um indicador para análise automática de ondas que é perfeito para negociações práticas! Caso... Nota:   Não estou acostumado a usar nomes ocidentais para classificação de ondas. Devido à influência da convenção de nomenclatura de Tang Lun (Tang Zhong Shuo Zen), nomeei a onda básica como   uma caneta   e a banda de onda secundária como   um segmento   . ao mesmo tempo, o segmento tem a direção da tendência.   O segmento de tendência principal   é nomeado (esse método de nomencl
Graphic Alignment Context
Ricardo Alexandre Laurentino
O Indicador Técnico Graphic Alignment Context (GAC) mede a diferença vertical da média simples do preço de um instrumento financeiro no contexto de três diferentes tempos gráficos determinados por um número definido de barras ou velas (períodos) para determinar a força da tendência de compra ou venda. Preços médios ascendentes indicam força compradora (1), preços médios descendentes indicam força Vendedora (-1) e qualquer cenário diferente das duas condições anteriores indicam Neutralidade (0).
FREE
This z-score indicator shows the correct z-score of an asset, as it uses the normalized price data for calculation, which is the only correct way. Z-score is only applicable for normal distributed data, therefore not the actual price is considered, but the normalised returns, which were assumed to follow a normal distribution. Returns are mean reverting and assumed to follow a normal distribution, therefore z-score calculation of returns is more reliable than z-score on price, as price is NOT m
Start Midas Fibo Bands
Ricardo Almeida Branco
Aqui temos o Start Midas Fibo Bands , confesso que é um indicador que t em me animado bastante para operar por eu ter conseguido encontrar regras mais definidas. Bem, o indicador conta com as funcionalidades dos demais indicadores da linha start que é a possibilidade de plotar diversas Midas na tela, pode movimentar o ponto de ancoragem utilizando atalhos de teclado e usar a legenda para diferenciar uma ancoragem de outra. As regras que tenho analisado para meu possível setup se referem à critér
TLDR: Named after the star Antares as being our ace EA, giving optimal entry to ensure winning trade. It comes with Fund Protection Stop Loss (FPSL) system to ensure profits are protected. Try it, love it, own it. Scalp Antares uses an in-house developed signal guided by trend anchorage to find the best entry point. There is a martingale investment system to ensure you reap the most profit from the on-going trend, just in case entry point was less optimal. A martingale system was built but we
Os compradores deste produto também adquirem
Trend Screener Pro MT5
STE S.S.COMPANY
4.89 (70)
Desbloqueie o poder da negociação de tendências com o indicador Trend Screener: sua solução definitiva de negociação de tendências, alimentada por lógica difusa e sistema de múltiplas moedas! Eleve sua negociação de tendências com o Trend Screener, o revolucionário indicador de tendências alimentado por lógica difusa. É um poderoso indicador de acompanhamento de tendências que combina mais de 13 ferramentas e recursos premium e 3 estratégias de negociação, tornando-o uma escolha versátil para to
FX Volume MT5
Daniel Stein
4.82 (17)
FX Volume: Vivencie o Verdadeiro Sentimento de Mercado sob a Perspectiva de um Corretor Visão Geral Rápida Quer aprimorar sua abordagem de trading? FX Volume fornece insights em tempo real sobre como traders de varejo e corretores estão posicionados—bem antes de relatórios atrasados como o COT. Seja para buscar ganhos consistentes ou simplesmente ter uma vantagem mais clara no mercado, FX Volume ajuda você a detectar grandes desequilíbrios, confirmar rompimentos e aperfeiçoar sua gestão de ris
FX Power MT5 NG
Daniel Stein
5 (10)
FX Power: Analise a Força das Moedas para Decisões de Negociação Mais Inteligentes Visão Geral FX Power é a sua ferramenta essencial para compreender a força real das principais moedas e do ouro em quaisquer condições de mercado. Identificando moedas fortes para comprar e fracas para vender, FX Power simplifica as decisões de negociação e revela oportunidades de alta probabilidade. Quer você prefira seguir tendências ou antecipar reversões usando valores extremos de Delta, esta ferramenta adap
FX Levels MT5
Daniel Stein
5 (2)
FX Levels: Suporte e Resistência com Precisão Excepcional para Todos os Mercados Visão Geral Rápida Procurando um meio confiável de identificar níveis de suporte e resistência em qualquer mercado—incluindo pares de moedas, índices, ações ou commodities? FX Levels combina o método “Lighthouse” tradicional com uma abordagem dinâmica de vanguarda, fornecendo uma precisão quase universal. Baseado em nossa experiência real com corretores e em atualizações automáticas diárias mais as de tempo real,
Golden Trend Indicator MT5
Noha Mohamed Fathy Younes Badr
4.86 (14)
Golden Trend indicator  is The best indicator for predicting trend movement this indicator never lags and never repaints and never back paints    and give  arrow buy and sell    before the candle appear  and it will help you and  will make your trading decisions clearer its work on all currencies and  gold and crypto and all time frame This unique  indicator uses very secret algorithms to catch the  trends, so you can trade using this indicator and see the trend clear on charts  manual guide and
Este é um indicador para MT5 que fornece sinais precisos para entrar em uma negociação sem redesenhar. Ele pode ser aplicado a qualquer ativo financeiro: forex, criptomoedas, metais, ações, índices. Ele fornecerá estimativas bastante precisas e informará quando é melhor abrir e fechar um negócio. Assista o vídeo (6:22) com um exemplo de processamento de apenas um sinal que compensou o indicador! A maioria dos traders melhora seus resultados de negociação durante a primeira semana de negociação c
TPSproTREND PrO MT5
Roman Podpora
4.6 (15)
TPSpro TREND PRO  - is a trend indicator that automatically analyzes the market and provides information about the trend and each of its changes, as well as giving signals for entering trades without redrawing! The indicator uses each candle, analyzing them separately. referring to different impulses - up or down impulse. Exact entry points into transactions for currencies, crypto, metals, stocks, indices!  ИНСТРУКЦИЯ RUS         INSTRUCTIONS  ENG       R ecommended to use with an indicator   -
TPSpro RFI Levels MT5
Roman Podpora
4.71 (17)
INSTRUÇÕES         Russo   -        ENG       R   ecomendado para uso com um indicador       -       TPSpro   TREND PRO -   Versão MT4         Um elemento-chave na negociação são as zonas ou níveis a partir dos quais as decisões de comprar ou vender um instrumento de negociação são tomadas. Apesar das tentativas dos principais participantes de esconder sua presença no mercado, eles inevitavelmente deixam rastros. Nossa tarefa era aprender como identificar esses rastros e interpretá-los corretame
FX Dynamic: Acompanhe a Volatilidade e as Tendências com Análise ATR Personalizável Visão Geral FX Dynamic é uma ferramenta poderosa que utiliza cálculos de Average True Range (ATR) para fornecer aos traders insights incomparáveis sobre a volatilidade diária e intradiária. Ao configurar limites de volatilidade claros —por exemplo, 80%, 100% e 130%—, você pode identificar rapidamente oportunidades de lucro ou receber alertas quando o mercado ultrapassar faixas normais. FX Dynamic se adapta ao f
IX Power MT5
Daniel Stein
4.83 (6)
IX Power: Descubra informações de mercado para índices, commodities, criptomoedas e forex Visão Geral IX Power é uma ferramenta versátil projetada para analisar a força de índices, commodities, criptomoedas e símbolos de forex. Enquanto o FX Power oferece a máxima precisão para pares de moedas ao utilizar dados de todos os pares disponíveis, o IX Power foca exclusivamente nos dados do mercado do símbolo subjacente. Isso torna o IX Power uma excelente escolha para mercados fora do forex e uma o
O Support And Resistance Screener está em um indicador de nível para MetaTrader que fornece várias ferramentas dentro de um indicador. As ferramentas disponíveis são: 1. Screener de estrutura de mercado. 2. Zona de retração de alta. 3. Zona de retração de baixa. 4. Pontos de Pivô Diários 5. Pontos Pivot semanais 6. Pontos Pivot mensais 7. Forte suporte e resistência com base no padrão harmônico e volume. 8. Zonas de nível de banco. OFERTA POR TEMPO LIMITADO: O indicador de suporte e resistência
Apresentando       Quantum Breakout PRO   , o inovador Indicador MQL5 que está transformando a maneira como você negocia Breakout Zones! Desenvolvido por uma equipe de traders experientes com experiência comercial de mais de 13 anos,       Quantum Breakout PRO       foi projetado para impulsionar sua jornada comercial a novos patamares com sua estratégia de zona de fuga inovadora e dinâmica. O Quantum Breakout Indicator lhe dará setas de sinal em zonas de breakout com 5 zonas-alvo de lucro e su
Quantum TrendPulse
Bogdan Ion Puscasu
5 (11)
Apresentando   Quantum TrendPulse   , a ferramenta de negociação definitiva que combina o poder do   SuperTrend   ,   RSI   e   Stochastic   em um indicador abrangente para maximizar seu potencial de negociação. Projetado para traders que buscam precisão e eficiência, este indicador ajuda você a identificar tendências de mercado, mudanças de momentum e pontos de entrada e saída ideais com confiança. Principais características: Integração SuperTrend:   siga facilmente a tendência predominante do
Easy Breakout MT5
Mohamed Hassan
5 (2)
Enjoy a   50% OFF   Christmas holiday sale!   After your purchase, feel free to contact me for more details on how to receive a bonus indicator called VFI, which pairs perfectly with Easy Breakout for enhanced confluence!     Easy Breakout MT5   is a powerful price action trading system built on one of the most popular and widely trusted strategies among traders: the   Breakout strategy ! This indicator delivers crystal-clear Buy and Sell signals based on breakouts from key support and resis
Gold Stuff mt5
Vasiliy Strukov
4.92 (173)
Gold Stuff mt5-um indicador de tendência projetado especificamente para o ouro, também pode ser usado em qualquer instrumento financeiro. O indicador não é redesenhado ou atrasado. O timeframe recomendado é H1. Importante! Entre em contato comigo imediatamente após a compra para obter instruções e bônus!  Você pode obter uma cópia gratuita do nosso indicador Strong Support e Trend Scanner, envie uma mensagem privada. a mim! PARÂMETRO Draw Arrow-incl.desligado. desenhar setas no gráfico. Aler
Atomic Analyst MT5
Issam Kassas
4.32 (19)
Primeiramente, vale ressaltar que este Indicador de Negociação não repinta, não redesenha e não apresenta atrasos, tornando-o ideal tanto para negociação manual quanto automatizada. Manual do utilizador: configurações, entradas e estratégia. O Analista Atômico é um Indicador de Ação de Preço PA que utiliza a força e o momentum do preço para encontrar uma vantagem melhor no mercado. Equipado com filtros avançados que ajudam a remover ruídos e sinais falsos, e aumentam o potencial de negociação.
Matrix Arrow Indicator MT5
Juvenille Emperor Limited
5 (13)
O   Matrix Arrow Indicator MT5   é uma tendência única 10 em 1 seguindo um indicador multi-timeframe   100% sem repintura   que pode ser usado em todos os símbolos/instrumentos:   forex ,   commodities ,   criptomoedas ,   índices ,   ações .  O  Matrix Arrow Indicator MT5  determinará a tendência atual em seus estágios iniciais, reunindo informações e dados de até 10 indicadores padrão, que são: Índice de movimento direcional médio (ADX) Índice de canal de commodities (CCI) Velas clássicas de
Este painel mostra os últimos   padrões harmónicos   disponíveis para os símbolos seleccionados, pelo que poupará tempo e será mais eficiente /   versão MT4 . Indicador gratuito:   Basic Harmonic Pattern Colunas do indicador Symbol :   aparecem os símbolos seleccionados Trend :   de alta ou de baixa Pattern :   tipo de padrão (gartley, borboleta, morcego, caranguejo, tubarão, cifra ou ABCD) Entry :   preço de entrada SL:   preço de paragem de perda TP1:   preço do 1º take profit TP2:   preço
Antes de tudo, vale ressaltar que esta Ferramenta de Negociação é um Indicador Não Repintante, Não Redesenhante e Não Atrasado, o que a torna ideal para negociação profissional. Curso online, manual do utilizador e demonstração. O Indicador de Conceitos de Ação de Preço Inteligente é uma ferramenta muito poderosa tanto para traders novos quanto experientes. Ele combina mais de 20 indicadores úteis em um único, combinando ideias avançadas de negociação como Análise do Trader do Círculo Interno
RelicusRoad Pro MT5
Relicus LLC
4.83 (18)
Agora US $ 147 (aumentando para US $ 499 após algumas atualizações) - Contas ilimitadas (PCs ou Macs) Manual do usuário do RelicusRoad + vídeos de treinamento + acesso ao grupo de discórdia privado + status VIP UMA NOVA FORMA DE OLHAR PARA O MERCADO O RelicusRoad é o indicador de negociação mais poderoso do mundo para forex, futuros, criptomoedas, ações e índices, oferecendo aos traders todas as informações e ferramentas necessárias para se manterem rentáveis. Fornecemos análises técnicas e
AT Forex Indicator MT5
Marzena Maria Szmit
5 (5)
The AT Forex Indicator MT5 is a sophisticated trading tool designed to provide traders with a comprehensive analysis of multiple currency pairs. This powerful indicator simplifies the complex nature of the forex market, making it accessible for both novice and experienced traders. AT Forex Indicator uses advanced algorithms to detect trends, patterns and is an essential tool for traders aiming to enhance their forex trading performance. With its robust features, ease of use, and reliable signal
ICT, SMC, SMART MONEY CONCEPTS, SMART MONEY, Smart Money Concept, Support and Resistance, Trend Analysis, Price Action, Market Structure, Order Blocks, BOS/CHoCH,   Breaker Blocks ,  Momentum Shift,   Supply&Demand Zone/Order Blocks , Strong Imbalance,   HH/LL/HL/LH,    Fair Value Gap, FVG,  Premium  &   Discount   Zones, Fibonacci Retracement, OTE, Buy Side Liquidity, Sell Side Liquidity, BSL/SSL Taken, Equal Highs & Lows, MTF Dashboard, Multiple Time Frame, BigBar, HTF OB, HTF Market Structure
Auto Order Block with break of structure based on ICT and Smart Money Concepts (SMC) Futures Break of Structure ( BoS )             Order block ( OB )            Higher time frame Order block / Point of Interest ( POI )    shown on current chart           Fair value Gap ( FVG ) / Imbalance   -  MTF      ( Multi Time Frame )    HH/LL/HL/LH  -  MTF      ( Multi Time Frame )  Choch  MTF      ( Multi Time Frame )  Volume Imbalance     ,  MTF          vIMB Gap’s Power of 3 Equal High / Low’s  
Bill Williams Advanced
Siarhei Vashchylka
5 (9)
Bill Williams Advanced is designed for automatic chart analysis using Bill Williams' "Profitunity" system. The indicator analyzes four timeframes at once. Manual (Be sure to read before purchasing) Advantages 1. Automatically analyzes the chart using the "Profitunity" system of Bill Williams. The found signals are placed in a table in the corner of the screen. 2. Equipped with a trend filter based on the Alligator indicator. Most of the system signals are recommended to be used only according t
Berma Bands
Muhammad Elbermawi
5 (3)
O indicador Berma Bands (BBs) é uma ferramenta valiosa para traders que buscam identificar e capitalizar tendências de mercado. Ao analisar a relação entre o preço e os BBs, os traders podem discernir se um mercado está em uma fase de tendência ou de variação. As Bandas de Berma são compostas por três linhas distintas: a Banda de Berma Superior, a Banda de Berma Média e a Banda de Berma Inferior. Essas linhas são plotadas em torno do preço, criando uma representação visual do movimento do preço
Special offer : ALL TOOLS , just $35 each! New tools will be $30 for the first week or the first 3 purchases !  Add me as a friend to get notified when new tools are published! O Indicador de Padrão de Reversão de Três Barras oferece uma ferramenta poderosa para traders, identificando e destacando automaticamente padrões de reversão de três barras diretamente no gráfico de preços. Este indicador é um recurso valioso para detectar reversões potenciais de tendência e permite que os usuários melho
Gold Pointer é o melhor indicador de tendência. O algoritmo único do indicador analisa o movimento do preço do ativo, tendo em conta os factores de análise técnica e matemática, determina os pontos de entrada mais rentáveis e dá um sinal para abrir uma ordem de COMPRA ou VENDA. Os melhores sinais do indicador: - Para VENDER = linha de tendência vermelha + indicador TF vermelho + seta de sinal amarelo na mesma direção. - Para COMPRAR = linha de tendência azul + indicador TF azul + seta de sina
- Lifetime update free -   Real price is 80$   - 25% Discount ( It is 59$ now ) Contact me for instruction, any questions! Related Product:  Gold Trade Expert MT5 - Non-repaint - I just sell my products in Elif Kaya Profile, any other websites are stolen old versions, So no any new updates or support. Introduction The breakout and retest strategy is traded support and resistance levels. it involves price breaking through a previous level.  The break and retest strategy is designed to help trade
Trend Line Map Pro MT5
STE S.S.COMPANY
4.09 (11)
O indicador Trend Line Map é um complemento do Trend Screener Indicator. Ele funciona como um scanner para todos os sinais gerados pelo Trend screener (Trend Line Signals). É um Trend Line Scanner baseado no Trend Screener Indicator. Se você não tiver o Trend Screener Pro Indicator, o Trend Line Map Pro não funcionará. It's a Trend Line Scanner based on Trend Screener Indicator. If you don't have Trend Screener Pro Indicator,     the Trend Line Map Pro will not work . Acessando nosso Blog MQ
Este painel descobre e apresenta as zonas de   oferta   e   procura   no gráfico, tanto no modo de escalpelamento como de longo prazo, dependendo da sua estratégia de negociação para os símbolos seleccionados. Além disso, o modo de scanner do painel de controlo ajuda-o a verificar todos os símbolos desejados num relance e a não perder nenhuma posição adequada /   Versão MT4 Indicador gratuito:   Basic Supply Demand Características Permite-lhe ver oportunidades de negociação em   vários pares de
Mais do autor
The ATR-StopLoss-Line indicator for MT5 calculates a stoploss line by the Average-True-Range (ATR) - Value of the particular candle.  As point of reference you can choose the High/Low or Close of the particular candle. The indicator is suitable for scalping and intraday trading. The indicator does not redraw (recalculate). Signals are generated strictly on the "Close of the bar". It can be used as a standalone tool or together with other indicators. Alerts on Colorchanges are activatable.
The HighsAndLowsPro indicator for MetaTrader 5 marks local highs and lows in the chart. It distinguishes between weak and strong highs and lows. The line thicknesses and colours can be individually adjusted. In the default setting, the weak highs and lows are displayed thinner, the strong ones thicker. Weak highs and lows have 3 candles in front of and behind them whose highs are lower and lows are higher. The strong highs and lows have 5 candles each.
FREE
ShowSessions MT5
PATRICK WENNING
4.5 (4)
The ShowSessions indicator for MT5 shows up to two, self-selected, time intervals, for a free choosen number of days past and a few future days. Weekends are marked with an additional red vertical line. The indicator makes manuel backtesting of strategies more easily, but you can use ist for daily trading as well. Please note that the server time does not always correspond to the actual time.
FREE
TrianglesPro
PATRICK WENNING
The TrianglesPro indicator for MetaTrader5 draws triangles on the chart based on the local highs and lows. The length of the trendlines can be limited. Optionally, you can display the highs and lows that are used to determine the triangles. It is also possible to determine how far back the identification of triangles should start. Also check out my other indicators.
The Multitimeframe-Candles (MCandles) - Indicator for MT5 shows the contour of an higher, free selectable, timeframe as an overlay on the current timeframe. You can freely choose the timeframe, number of candles and color of the overlays. The indicator only calculates the current candle frequently, so it saves computing capacities. If you like the indicator, please left a comment. 
BreakOutBox MT5
PATRICK WENNING
1 (1)
The Breakout Box for MT5 is a (opening) range breakout Indicator with freely adjustable: - time ranges - end of drawing time - take profit levels by percent of the range size - colors - font sizes It can  not only display the range of the current day, but also for any number of days past. It can be used for any instrument. It displays the range size and by request the range levels and the levels of the take profit niveaus too. By request it shows a countdown with time to finish range.  The indic
The Candlestick Patterns indicator for MT5 includes 12 types of candlestick signales in only one indicator. - DoubleTopsAndBottoms - SmallerGettingBars - BiggerGettingBars - ThreeBarsPlay - TwoBarsStrike - Hammers - InsideBars - OutsideBars - LongCandles - TwoGreenTwoRed Candles - ThreeGreenThreeRed Candles The indicator creats a arrow above or under the signal candle and a little character inside the candle to display the type of the signal. For long candles the indicator can display the exact
The SessionLines indicator for MT5 shows up the most important time intervalls and price levels in the DAX-Index. The following times get marked: Opening Time DAX Future, Opening Time DAX Kassa, Closing Time DAX Kassa, Closing Time DAX Future, Opening Time US Index Futures, Opening Time US Kassa Markets, Spezial Times, The following price levels get marked: Daily High/Low, Previous Daily High/Low, Weekly High/Low, Opening and Cloth Levels of Future and Kassa Daily (inkl. Previous Day).
The SessionLines indicator for MT5 shows up the most important time intervalls and price levels in the US- Indices . The following times get marked: Opening Time US Futures, Opening Time US Kassas, Closing Time US Kassas, Spezial Times, The following price levels get marked: Daily High/Low, Previous Daily High/Low, Weekly High/Low, Opening and Cloth Levels of Futures Daily (inkl. Previous Day).
TrendLinePro
PATRICK WENNING
The TrendLinePro indicator for MetaTrader 5 creates a trend line based on the last candle highs and lows. The number of candles to be used to determine the direction can be selected yourself. The trend line can also be used to set an SL. Changes in trend directions can optionally be displayed with an arrow. Input Parameters: Number of Candles for Distance: 3 Display Direction Changes Arrows: false
product video: https://vimeo.com/824742776?share=copy Trade Assistant, Trade Manager, Trade Panel for MetaTrader 5 with the following functions: - Display the remaining candle time and the current time of day - Open long and short positions without SL and TP at the current market price - Display of the current ask, bid and spread - Open long and short positions with predefined lot size, SL and TP at the current market price - Quick selection of the lot size (freely selectable lot sizes) -
Filtro:
Sem comentários
Responder ao comentário
Versão 1.1 2023.04.12
1.1. Fixed Sound Problem