FloorPivot with SMHA
- Indicadores
- Ayush Bhati -
- Versão: 5.66
- Atualizado: 17 maio 2022
- Ativações: 7
Try My Signal = https://www.mql5.com/en/signals/2093706?source=Site+Signals+My
If you don't have time to analysis the chart then check out my above trading SIGNAL.
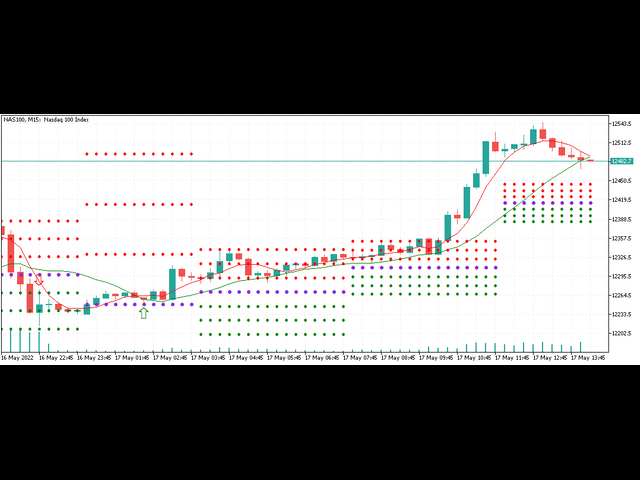
This indicator is used to identify key levels where the trend in price has a greater probability of halting and possibly changing direction. Interpretation of the degree of significance of a level depends on a trader's time frame.
It is great to see how the prices respect each level of this support and resistance. This Indicator works for me very well. If you have good knowledge of Price Action then you can make profitable trades with this indicator. If candle take support or resistance on any of these levels or make Hammer or Doji type candles it will get reversal from that price.
This indicator also helps you to identify TakeProfit and StopLoss.
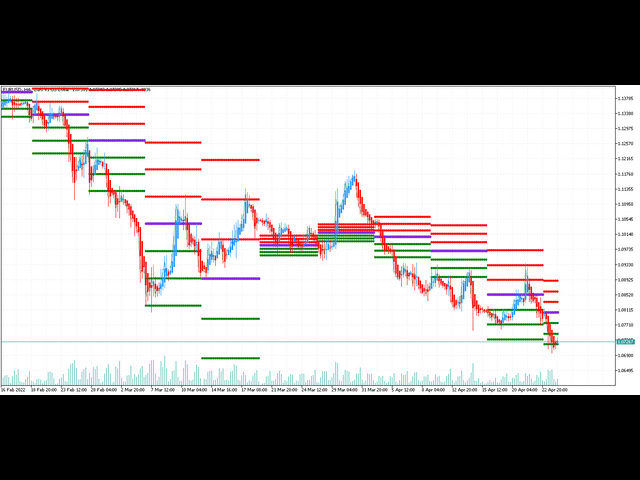
To minimize the risk and get rid of false signal it has smoothed heiken ashi indicator.
If you are a manual trader, prefer a clean chart and use Support & Resistance to trade then this indicator suits you well.
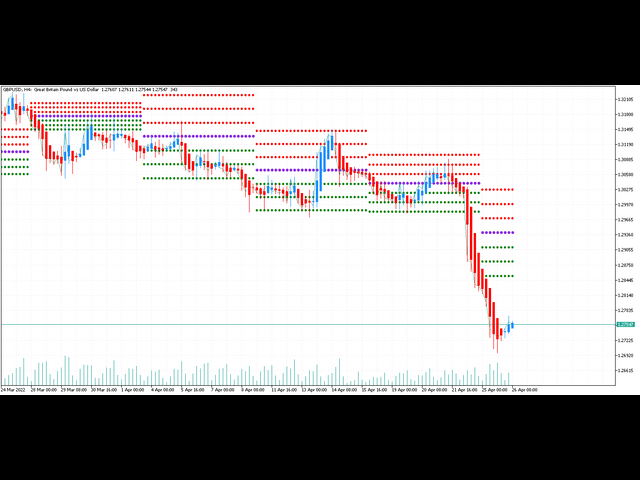
Note : If you use Smoothed Heiken Ashi Candle {HA = true} then use Line Chart otherwise candle will overlap.
Note : It will work on different TimeFrames. For different intervals change its timeframe{ Daily, Weekly, Monthly, H1, H4 }.
Key Features :-
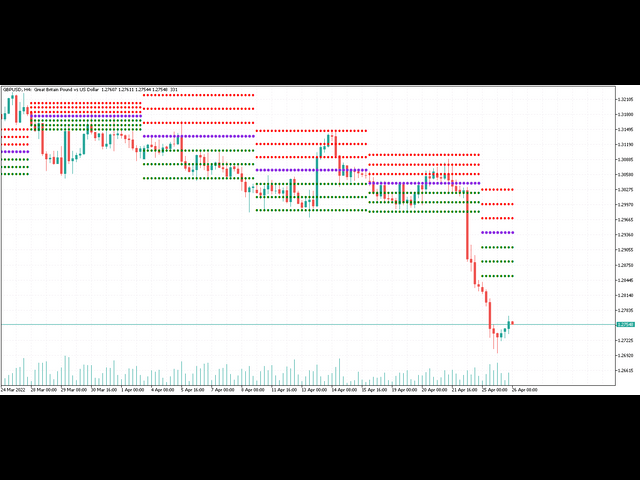
A key concept of technical analysis is that when a resistance or support level is broken, its role is reversed. If the price rises above a resistance level, it will often become support.
Horizontal support and resistance levels are the most basic type of these levels. They're simply identified by a horizontal line .
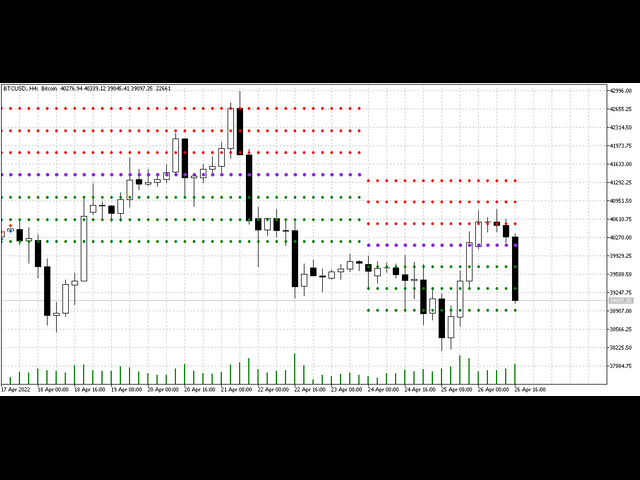
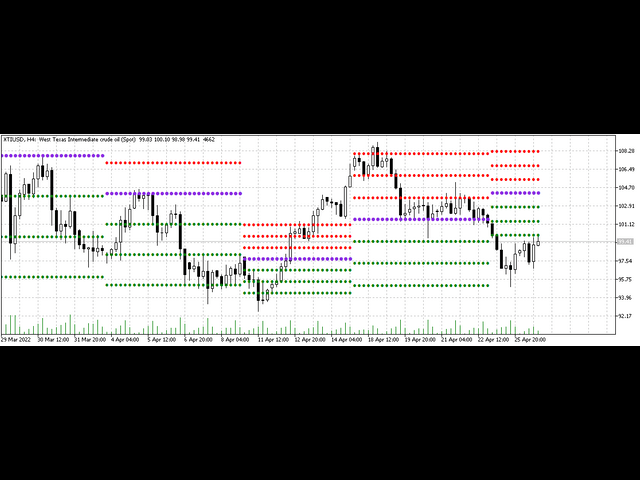
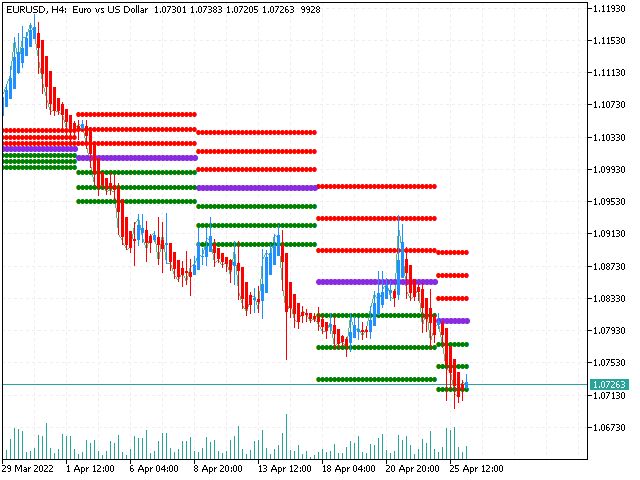
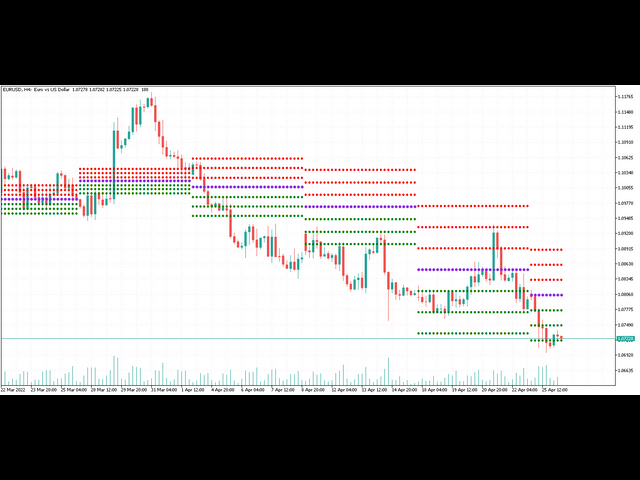
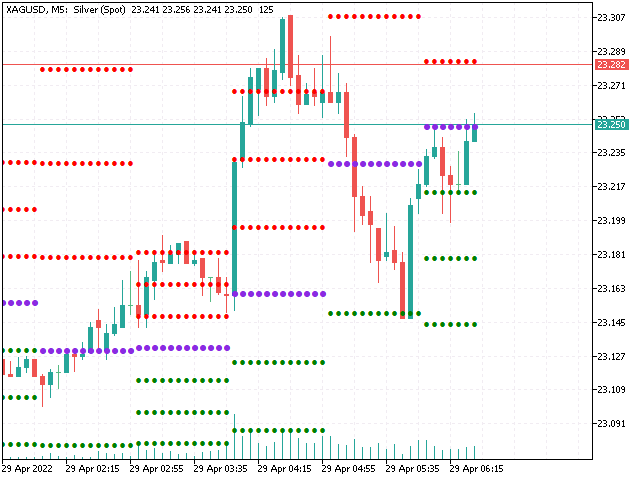
This indicator creates up to 7 levels of support and resistance through weekly price:
Green Level in the chart, is a Support Level.
Red Level in the chart, is a Resistance Level.
And the Purple Level in the chart, is a Central Pivot Level.
For confirm signal enable HeikenAshi.
You will also use other custom indicator for better conformation like MA, if HA crossover MA then you make trade.
Advantage of FloorPivot with SMHA {smoothed heiken ashi}:
Working with all pairs ( Forex, Crypto, Indices, and Commodities )
Working with all timeframes.
Recommended Interval : H3, H4, H6, H8, H12 on Weekly TimeFrame.
For Daily : M1 to H1
For Monthly : H4 to W1
For H1 and H4 : Minute candle useful.
Indicator input parameters :
- HA = true { To enable or disable Heiken Ashi candles }
- TimeFrame = To select for different timeframe Level (Daily, Weekly, Monthly).
- Variant = To select HeikenAshi or Price candles.
- Type = To select Japanese Candle or Coloured Bar
These Levels are now only on weekly basis. In next update comes with Daily and Monthly Levels.