
TrailingStop MA
- Indicadores
- Andrej Nikitin
- Versão: 1.10
- Atualizado: 4 outubro 2018
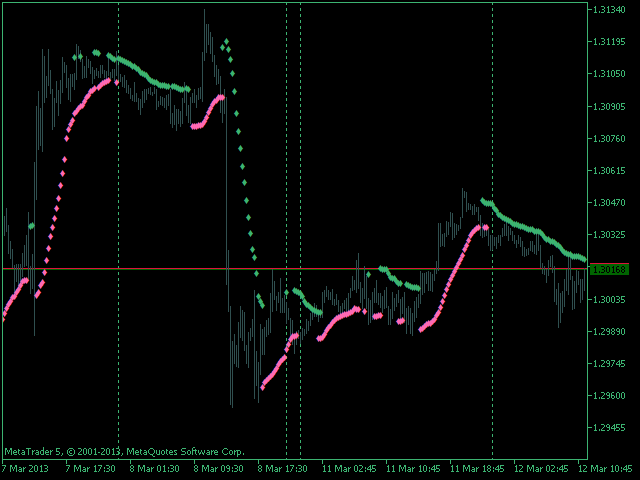
O indicador desenha duas médias móveis simples utilizando preços máximos e mínimos
A linha de MA_High é exibido quando a média móvel é direcionada para baixo. Ele pode ser usado para definir uma ordem de stop para uma posição de venda.
A linha de MA_Low é exibido quando a média móvel é dirigida para cima. Ela pode ser usado para definir uma ordem de stop para uma posição comprada.
O indicador é usado no Expert Advisor TrailingStop.
Parâmetros
- Period - Período de cálculo da média móvel.
- Deviation - Taxa de convergência / divergência das linhas.
Índices do Buffer: 0 - MA_High, 1 - MA_Low.


O usuário não deixou nenhum comentário para sua avaliação