• Visão global
  • Comentários
  • Discussão
  • O que há de novo

Fractal 358 Plus

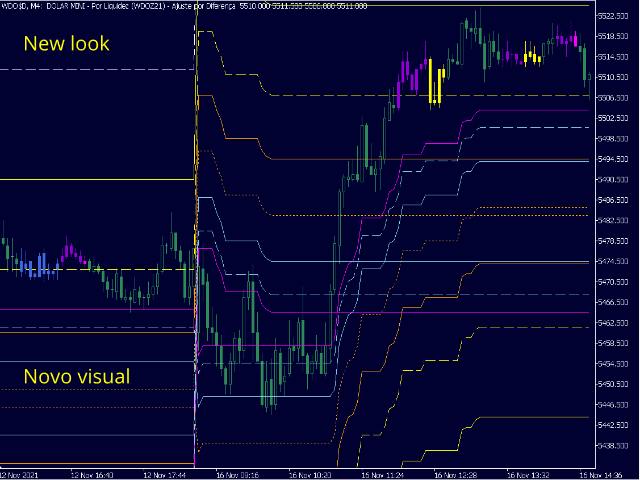
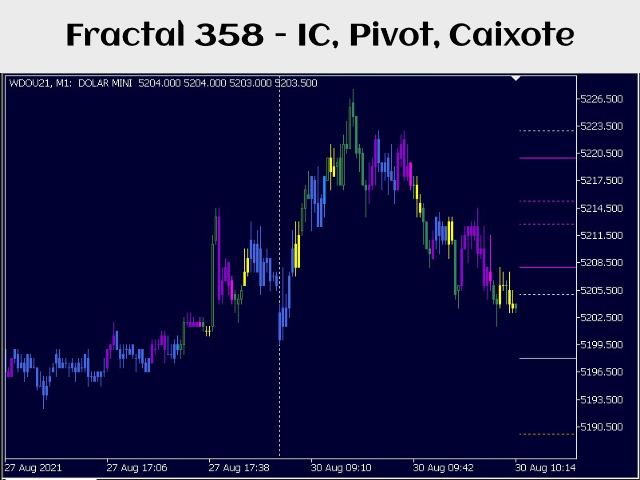
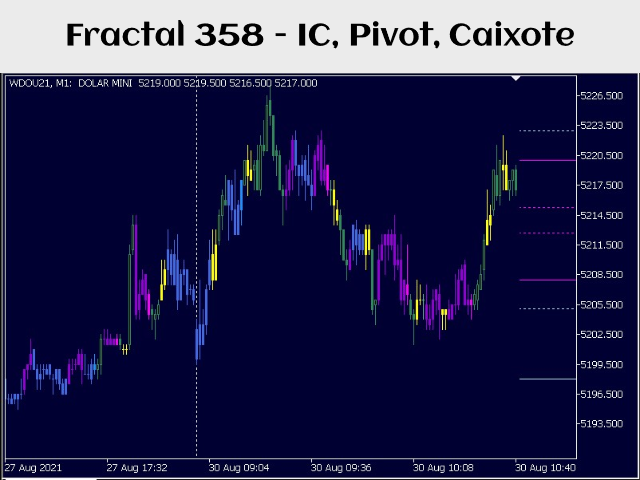
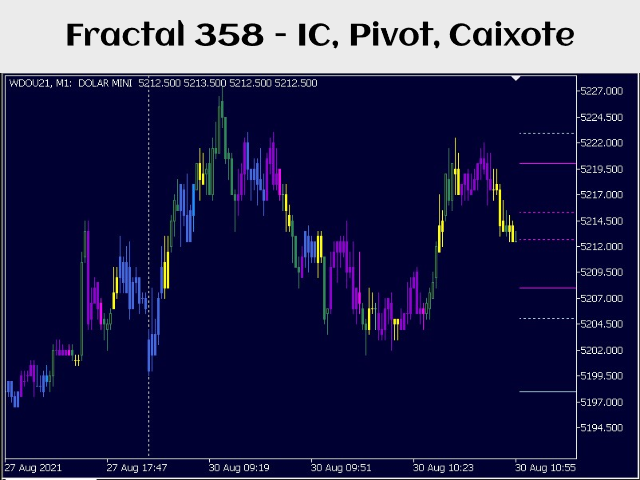
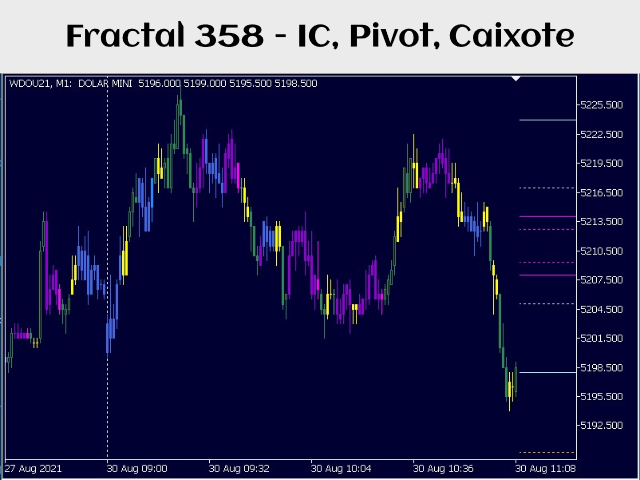
Fractal 358 Plus é um indicador preditivo que oferece uma visão clara das movimentações do preços. Agregando padrões gráficos como Caixote, Pivot e Inside Candle, mostra pontos interessantes para entradas e saídas, além de mostrar ameaças às operações no mercado financeiro.

Já vem configurado para o mini índice (série WIN) e basta só ajustar os parâmetros para usar com qualquer ativo e tempo gráfico. 

O Fractal 358 desvenda o movimento do preço

Baseada na sequência de Fibonacci, Fractal 358 é uma forma nova e diferente de ler e entender o movimento dos preços nos mercados de capital.

O Fractal 358 mostra alvos potenciais para suas operações e os locais onde aumentam os riscos de uma operação não ir adiante.

Rogério Araujo, CEO da ROAR Educacional e Gestor Profissional de Investimentos, com mais de 28 anos de carreira no mercado financeiro criou o conceito que adaptamos neste indicador.

Scalp com Fractal 358

Este indicador é audiovisual e quando um padrão é formado, emite uma mensagem de áudio e colore os candles, convidando o investidor a avaliar a operação.

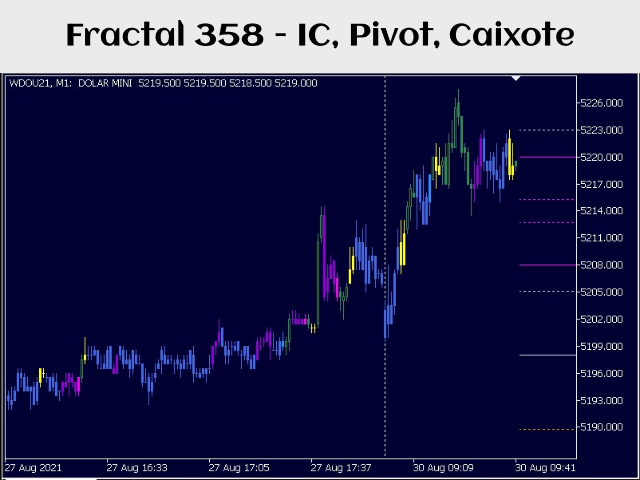
Os padrões podem ser usados como sinais de entrada:

  • Inside Candle (IC) é um padrão gráfico formado por 2 candles, sendo que o primeiro deve conter o segundo (mais recente) entre sua máxima e mínima.
  • Caixote é um padrão similar ao IC. É formado por 4 candles, sendo que o primeiro deve conter os três seguintes entre sua máxima e mínima. 
  • Pivot é um padrão que demonstra suporte ou resistência (S/R).

As operações scalp levam desde alguns segundos a poucos minutos e buscam alvos curtos como 50 pontos no WIN ou 4 centavos de real na PETR4.

Cada ativo tem seu comportamento próprio e o investidor deve analisar e testar como estes sinais vão performar em cada caso, antes de se comprometer financeiramente.

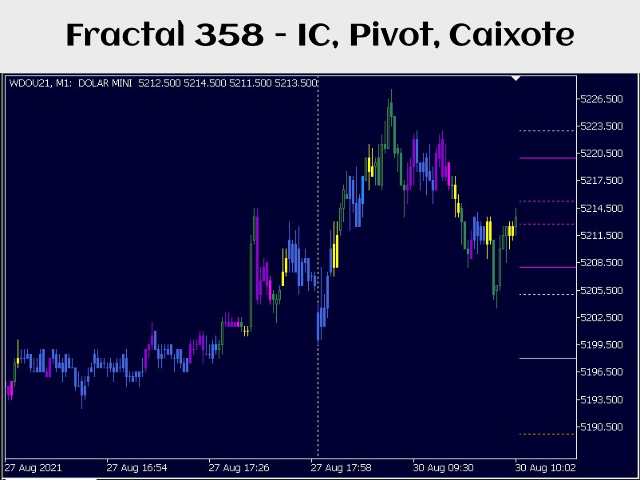
Combinando as ferramentas

Os sinais de entrada são apenas parte da equação.

Ao comparar sua posição em relação ao Fractal 358, o investidor pode, de um lado, ajustar a operação para extrair mais valor do que uma operação scalper e de outro, evitar operações com menores chances de sucesso.

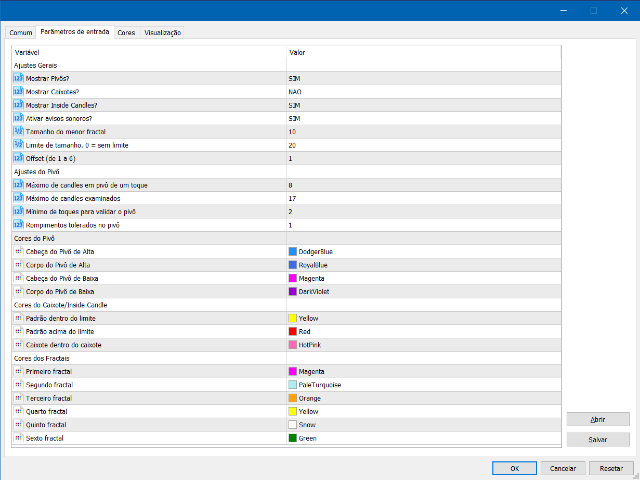
Totalmente configurável

Os parâmetros de entrada tornam este indicador altamente flexível, permitindo seu uso com praticamente qualquer ativo de qualquer mercado.

Baixe a versão de demonstração e faça todos os testes que quiser para comprovar que o indicador Fractal 358 Plus pode ser seu grande aliado para ser um vencedor no mercado financeiro. Entre em contato para aprender mais após sua aquisição.


Autor: Renato Fridschtein, desenvolvedor de software há mais de 35 anos e trader a mais de 10. Vem criando indicadores e robôs de investimento desde 2020.


Produtos recomendados
Uma das sequências numéricas é chamada de "Forest Fire Sequence". Foi reconhecida como uma das mais belas novas sequências. Sua principal característica é que essa sequência evita tendências lineares, mesmo as mais curtas. É esta propriedade que formou a base deste indicador. Ao analisar uma série temporal financeira, este indicador tenta rejeitar todas as opções de tendência possíveis. E somente se ele falhar, ele reconhece a presença de uma tendência e dá o sinal apropriado. Esta abordagem pe
30 USD
An indicator of pattern #31 ("Long Island") from Encyclopedia of Chart Patterns by Thomas N. Bulkowski. The second gap is in the opposite direction. Parameters: Alerts - show alert when an arrow appears   Push - send a push notification when an arrow appears (requires configuration in the terminal) GapSize - minimum gap size in points ArrowType - a symbol from 1 to 17 ArrowVShift - vertical shift of arrows in points   ShowLevels - show levels ColUp - color of an upward line ColDn - color of a
30 USD
Rainbow EA MT5
Jamal El Alama
Description : Rainbow EA MT5 is a simple Expert advisor based on   Rainbow MT5 indicator witch is based on Moving average with period 34. The indicator is incorporated in the EA, therefore, it is not required for the EA to operate, but if you wish, you can download it from   my product page . The Expert Advisor settings are as follows : Suitable for Timeframes up to H1 The parameters below can be set according to your trading rules. StopLoss ( Stop Loss in pips) TakeProfit ( Take Profit in pi
59 USD
Trend Monitor MT5
Pavel Zamoshnikov
3.67 (3)
The indicator generates early signals basing on ADX reading data combined with elements of price patterns. Works on all symbols and timeframes. The indicator does not redraw its signals. You see the same things on history and in real time. For better visual perception signals are displayed as arrows (in order not to overload the chart). Features The best results are obtained when the indicator works on two timeframes. For example: M30 – the indicator shows the main trend; M5 – the indicator ge
30 USD
PipFinite Trend PRO MT5
Karlo Wilson Vendiola
4.86 (657)
Breakthrough Solution For Trend Trading And Filtering With All Important Features Built Inside One Tool! Trend PRO's smart algorithm detects the trend, filters out market noise and gives entry signals with exit levels. The new features with enhanced rules for statistical calculation improved the overall performance of this indicator. Important Information Revealed Maximize the potential of Trend Pro, please visit www.mql5.com/en/blogs/post/713938 The Powerful Expert Advisor Version Automa
98 USD
Renko Gold
Ignacio Agustin Mene Franco
Renko Gold! clearly indicates the floors and ceilings where it goes from 4 lines, the line below that marks the floor in green confirming with the thinnest line clarifies the purchase entry, the same is for sale, the top line marks the ceiling and the thinnest red line marks the sale, This indicator works for all temporalities! For Forex and Synthetic Indices markets! It also works for crypto markets! Good profit! World Investor.
40 USD
Noize Absorption Index - is the manual trading system that measures the difference of pressure between bears forces and bulls forces. Green line - is a noize free index that showing curent situation. Zero value of index shows totally choppy/flat market.Values above zero level shows how powerfull bullish wave is and values below zero measures bearish forces.Up arrow appears on bearish market when it's ready to reverse, dn arrow appears on weak bullish market, as a result of reverse expectation.
199 USD
Your Trend Friend
Luigi Nunes Labigalini
A tendência é sua amiga! Veja a cor do indicador e faça suas operações nessa direção. Ele não repinta. Ou seja, depois que cada candle se fecha, a cor dele é definitiva e não irá se alterar. Você pode focar em movimentos mais curtos e rápidos ou tendências mais longas, basta testar o que melhor se encaixa no seu operacional de acordo com o ativo e tempo gráfico usado. Altere o parâmetro de entrada "Length" e o indicador irá se adaptar automaticamente (quanto maior ele for, maior a tendência a
99 USD
O nível Premium é um indicador único com mais de 80% de precisão nas previsões corretas! Este indicador foi testado pelos melhores Especialistas em Negociação por mais de dois meses! O indicador do autor você não encontrará em nenhum outro lugar! A partir das imagens você pode ver por si mesmo a precisão desta ferramenta! 1 é ótimo para negociar opções binárias com um tempo de expiração de 1 vela. 2 funciona em todos os pares de moedas, ações, commodities, criptomoedas Instruções:
1 100 USD
Trend Side - um indicador técnico para determinar a tendência. É um conjunto de várias estratégias de negociação completas. O indicador utiliza um sistema avançado de filtragem de tendências, possui um painel estatístico, calcula os níveis de entrada e saída e calcula o nível dinâmico do Trailing Stop. Adequado para qualquer tipo de símbolos, nunca redesenha seus sinais e resultados. Uma ferramenta abrangente para negociação de tendências profissional. O conjunto do indicador Trend Side també
50 USD
Point Black
Ignacio Agustin Mene Franco
Black Card Pack indicator 5/1 point black It has the strategy of professional bollingers where each arrow gives you a different entry signal. It is used to operate in m1 and in d1 It is used for scalping and intraday, modified for forex markets ! suitable for all pairs modified for synthetic index markets suitable for all pairs! Ideal for volatility and jumps!
50 USD
Price reach indicator. It also serves as the perfect term for supports and resistance. I use it in two experts. The basic tool for professional trading. The indicator analyzes the last 500 bar and uses this to determine the levels ( but it doesn't predict the future ) . Personally, I use it on TF H1.  It is very simple. Four lines on chart and that's all. Only two input parameters.  Thousands of indicators. Why this? Is good ? No! Is very good. Please test the indicator prior to purchasing. You
49 USD
Este indicador inovador de medir a força das moedas da INFINITY é um assistente indispensável para cambistas e comerciantes que negociam em longo prazo. O sistema de análise de força / fraqueza das moedas é conhecido há muito tempo e é usado no mercado pelos principais traders do mundo. Qualquer negociação de arbitragem não está completa sem essa análise. Nosso indicador determina facilmente a força das moedas subjacentes em relação umas às outras. Ele exibe gráficos de linhas em todas ou no pa
30 USD
Você, assim como eu, gosta de operar a favor da tendência? Então este indicador vai te ajudar! Rainbow Trend é um indicador de tendência, no qual utiliza várias Médias Móveis junto do gráfico. Ela mede diferentes zonas de força da tendência para diferentes prazos: muito curto, curto, médio, longo e muito longo. Cada zona tem sua cor, e é possível ter alertas sonoros quando o preço sai de uma zona e entra em outra. Sua configuração é muito simples. Se encontrou alguma falha ou tem alguma suges
30 USD
Gartley Hunter MT5
Siarhei Vashchylka
5 (11)
Gartley Hunter - Indicator for finding harmonic patterns (Gartley patterns) and their projections. The indicator is equipped with an alert system. List of patterns At the moment, the indicator contains patterns:     Alternative bat     Bat     Butterfly     Crab     Cypher     Deep crab     Gartley Indicator control panel The pattern control panel is located in the lower left corner of the screen. See the picture below for a description of the panel. There are Russian and English version
149 USD
Cumulative delta indicator As most traders believe, the price moves under the pressure of market buying or selling. When someone redeems an offer standing in the cup, the deal is a "buy". If someone pours into the bid standing in the cup - the deal goes with the direction of "sale". The delta is the difference between purchases and sales. A cumulative delta - the difference between the cumulative sum of purchases and sales for a certain period of time. It allows you to see who is currently contr
50 USD
Laguerre SuperTrend Clouds   adds an Adaptive Laguerre averaging algorithm and alerts to the widely popular SuperTrend indicator. As the name suggests,   Laguerre SuperTrend Clouds (LSC)   is a trending indicator which works best in trendy (not choppy) markets. The SuperTrend is an extremely popular indicator for intraday and daily trading, and can be used on any timeframe. Incorporating Laguerre's equation to this can facilitate more robust trend detection and smoother filters. The LSC uses the
30 USD
LevelPAttern MT5 is a technical indicator based on the daily levels and Price Action patterns. The indicator is based on the standard ZigZag indicator + reversal candlestick pattens, such as Star, Hammer (also knows as Pin bar), Engulfing and others. The indicator generates audio and text notifications when a pattern is formed and a level is touched. It also supports sending email and push notifications. Indicator operation features It is suitable for working with any CFD and FOREX trading ins
150 USD
PipFinite Exit EDGE MT5
Karlo Wilson Vendiola
4.88 (34)
Did You Have A Profitable Trade But Suddenly Reversed? In a solid strategy, exiting a trade is equally important as entering. Exit EDGE helps maximize your current trade profit and avoid turning winning trades to losers. Never Miss An Exit Signal Again Monitor all pairs and timeframes in just 1 chart www.mql5.com/en/blogs/post/726558 How To Trade You can close your open trades as soon as you receive a signal Close your Buy orders if you receive an Exit Buy Signal. Close your Sell orde
88 USD
A professional tool for trading - the divergence indicator between the WPR and the price, which allows you to receive a signal about a trend reversal in a timely manner or catch price pullback movements (depending on the settings). The indicator settings allow you to adjust the strength of the divergence due to the angle of the WPR peaks and the percentage change in price, which makes it possible to fine-tune the signal strength. The indicator code is optimized and is tested very quickly as par
37 USD
Double HMA MTF for MT5
Pavel Zamoshnikov
5 (2)
This is an advanced multi-timeframe version of the popular Hull Moving Average (HMA) Features Two lines of the Hull indicator of different timeframes on the same chart. The HMA line of the higher timeframe defines the trend, and the HMA line of the current timeframe defines the short-term price movements. A graphical panel with HMA indicator data from all timeframes at the same time . If the HMA switched its direction on any timeframe, the panel displays a question or exclamation mark with a tex
30 USD
O indicador calcula e traça automaticamente os níveis de suporte e resistência de Fibonacci - uma das ferramentas mais eficazes para análise de mercado. O cálculo usa os dados de preço médio para o período e intervalo de tempo selecionados. O mínimo e o máximo para este período são considerados o início e o fim do movimento. Os níveis de Fibonacci permitem que você veja os pontos de referência potenciais, em torno dos quais o movimento do preço pode desacelerar ou reverter, ou seja, eles são usa
30 USD
Was: $249    Now: $149   Market Profile defines a number of day types that can help the trader to determine market behaviour. A key feature is the Value Area, representing the range of price action where 70% of trading took place. Understanding the Value Area can give traders valuable insight into market direction and establish the higher odds trade. It is an excellent addition to any system you may be using. Blahtech Limited presents their Market Profile indicator for the MetaTrader community.
149 USD
US30NinjaMT5
Satyaseelan Shankarananda Moodley
US30 Ninja is a 5 minute scalping indicator that will let know you when there is a trade set up (buy or sell). Once the indicator gives the trade direction, you can open a trade and use a 30 pip stop loss and a 30 pip to 50 pip take profit. Please trade at own own risk. This indicator has been created solely for the US30 market and may not yield positive results on any other pair. 
30 USD
Awesome Oscillator by Bill Williams with the ability to fine-tune and replace the averaging algorithms of the indicator, which significantly expands the possibilities of using this oscillator in algorithmic trading and brings it closer in its properties to such an indicator as the MACD. To reduce price noise, the final indicator is processed with an additional Smooth averaging. The indicator has the ability to give alerts, send mail messages and push signals when the direction of movement of th
40 USD
Introducing the Power Trade Plus indicator designed by a small group of traders with a few years of experience trading the market profitably.  The Power Trade Plus is derived from the Power Trade indicator,  the indicator strive in powerful sniper entries and take profit levels, now with a unique and upgraded algorithm to withstand even the most volatile of markets.  
200 USD
Accelerator Oscillator by Bill Williams   with the ability to fine-tune and replace the averaging algorithms of the indicator, which significantly expands the possibilities of using this oscillator in algorithmic trading and brings it closer in its properties to such an indicator as MACD. To reduce price noise, the final indicator is processed with an additional Smooth averaging.  The indicator has the ability to give alerts, send mail messages and push signals when the direction of movement
40 USD
Candle hunter
Ruslan Khasanov
5 (1)
Indicador para análise gráfica. Marca os principais padrões de velas japonesas no gráfico. No momento, o seguinte conjunto de padrões está disponível para o trader:  - Bearish/Bullish Abandoned Baby;  - Bearish Advance Block;  - Bearish Deliberation;  - Bearish/Bullish Belt Hold;  - Bearish/Bullish Engulfing;  - Bearish Shooting Star;  - Bearish Evening Star;  - Bearish Evening Doji Star;  - Bearish/Bullish Doji Star;    - Bearish/Bullish Tri-Star;  - Bearish Hanging Man;  - Bearish/Bullish Har
50 USD
Volality Index scalper indicator  Meant for Volality pairs such as Volality 10, 25, 50, 75 and 100 The indicator works on all timeframes from the 1 minute to the monthly timeframe the indicator is non repaint the indicator has 3 entry settings 1 color change on zero cross 2 color change on slope change 3 color change on signal line cross Orange line is your sell signal Blue line is your buy signal.
35 USD
Os compradores deste produto também adquirem
Owl Smart Levels MT5
Sergey Ermolov
4.39 (31)
Versão MT4  |  Como instalar?   |   FAQ O Indicador Owl Smart Levels é um sistema de negociação completo dentro de um indicador que inclui ferramentas populares de análise de mercado, como fractais avançados de Bill Williams , Valable ZigZag que constrói a estrutura de onda correta do mercado e níveis de Fibonacci que marcam os níveis exatos de entrada no mercado e lugares para obter lucros. Descrição detalhada da estratégia Instruções para trabalhar com o indicador Consultor de negociação Owl
97 USD
Este é um indicador para MT5 que fornece sinais precisos para entrar em uma negociação sem redesenhar. Ele pode ser aplicado a qualquer ativo financeiro: forex, criptomoedas, metais, ações, índices. Ele fornecerá estimativas bastante precisas e informará quando é melhor abrir e fechar um negócio. Assista o vídeo (6:22) com um exemplo de processamento de apenas um sinal que compensou o indicador! A maioria dos traders melhora seus resultados de negociação durante a primeira semana de negociação c
125 USD
Price action trading, Trend trading strategies, Trend following indicators, Trend detection, Range identification, Smart Trend Trading System Indicator, Comprehensive trading system, Multi-indicator approach, Trend following strategy, Range reversal strategy, Smart Trend Cloud, Smart Reversal Zones, Trend Breakout Catcher, Smart Trailing Stop, Multi-timeframe trend finder, Complete trading toolkit, Market trend analysis, Range-bound market signals, Confident trading decisions, Price movement in
100 USD
Apresentando o   Quantum Heiken Ashi PRO Projetadas para fornecer informações claras sobre as tendências do mercado, as velas Heiken Ashi são conhecidas por sua capacidade de filtrar o ruído e eliminar sinais falsos. Diga adeus às confusas flutuações de preços e olá para uma representação gráfica mais suave e confiável. O que torna o Quantum Heiken Ashi PRO verdadeiramente único é sua fórmula inovadora, que transforma os dados tradicionais de velas em barras coloridas fáceis de ler. As barras ve
99.99 USD
FX Volume MT5
Daniel Stein
4.8 (15)
Receba a sua atualização diária do mercado com detalhes e screenshots através do nosso Morning Briefing aqui no mql5 e no Telegram ! O Volume FX é o PRIMEIRO e ÚNICO indicador de volume que fornece uma visão REAL do sentimento do mercado do ponto de vista de um corretor. Ele fornece uma visão incrível de como os participantes do mercado institucional, como corretores, estão posicionados no mercado Forex, muito mais rápido do que os relatórios COT. Ver essas informações diretamente no seu gráfi
99 USD
FX Power MT5 NG
Daniel Stein
5 (1)
Receba a sua atualização diária do mercado com detalhes e screenshots através do nosso Morning Briefing aqui no mql5 e no Telegram ! O FX Power MT5 NG é a próxima geração do nosso medidor de força de moeda muito popular de longa data, o FX Power. E o que é que este medidor de força da próxima geração oferece? Tudo o que adorou no FX Power original MAIS Análise de força GOLD/XAU Resultados de cálculo ainda mais precisos Períodos de análise configuráveis individualmente Limite de cálculo personal
99 USD
IVISTscalp5
Vadym Zhukovskyi
5 (1)
Apresentamos a você o indicador iVISTscalp5, que não é apenas único, mas também eficaz em operações de negociação. Este indicador é baseado em dados de tempo e é o resultado de muitos anos de experiência e análise aprofundada dos mercados financeiros. O indicador iVISTscalp5 é uma excelente ferramenta para negociação manual. Conveniência, simplicidade e visualização - toda a complexidade está escondida dentro dele. Simplificamos as configurações e o uso do indicador iVISTscalp5 ao máximo. O indi
500 USD
Quantum Trend Sniper
Bogdan Ion Puscasu
5 (7)
Apresentando       Quantum Trend Sniper Indicator   , o inovador Indicador MQL5 que está transformando a maneira como você identifica e negocia as reversões de tendência! Desenvolvido por uma equipe de traders experientes com experiência comercial de mais de 13 anos,       Indicador de Atirador de Tendência Quântica       foi projetado para impulsionar sua jornada de negociação a novos patamares com sua forma inovadora de identificar reversões de tendência com precisão extremamente alta. ***C
99.99 USD
Blahtech Supply Demand MT5
Blahtech Limited
4.54 (13)
Was: $299    Now: $149   Supply Demand uses previous price action to identify potential imbalances between buyers and sellers. The key is to identify the better odds zones, not just the untouched ones. Blahtech Supply Demand indicator delivers functionality previously unavailable on any trading platform. This 4-in-1 indicator not only highlights the higher probability zones using a multi-criteria strength engine, but also combines it with multi-timeframe trend analysis, previously confirmed swi
149 USD
Apresentando       Quantum Breakout PRO   , o inovador Indicador MQL5 que está transformando a maneira como você negocia Breakout Zones! Desenvolvido por uma equipe de traders experientes com experiência comercial de mais de 13 anos,       Quantum Breakout PRO       foi projetado para impulsionar sua jornada comercial a novos patamares com sua estratégia de zona de fuga inovadora e dinâmica. O Quantum Breakout Indicator lhe dará setas de sinal em zonas de breakout com 5 zonas-alvo de lucro e
99.99 USD
Support and Resistance, Trading System, Indicator, Candlestick Patterns, VWAP, Trend Catcher, Multi-Timeframe Trend, Support Levels, Resistance Levels, Trading Strategies, Complete Trading System, Technical Analysis, Forex Trading, Price Action, Market Trends, Trading Signals, Trend Identification, Swing Trading, Day Trading, Swing Trading Strategies, Technical Indicators, Trading Tools, Trend Confirmation, Entry and Exit Points, Trading Panel, Forex Signals, Trend Reversals, Trading Algorithms
100 USD
Advanced Supply Demand MT5
Bernhard Schweigert
4.36 (11)
Atualmente com 33% de desconto! A melhor solução para qualquer Trader Novato ou especialista! Este indicador é uma ferramenta de negociação exclusiva, de alta qualidade e acessível porque incorporamos uma série de recursos proprietários e uma nova fórmula. Com esta atualização, você poderá mostrar fusos horários duplos. Você não só será capaz de mostrar um TF mais alto, mas também mostrar ambos, o TF do gráfico, MAIS o TF mais alto: MOSTRANDO ZONAS ANINHADAS. Todos os traders de Oferta e Demanda
199 USD
Este é sem dúvida o indicador de reconhecimento automático de formação de preço harmônico mais completo que você pode encontrar para a MetaTrader Platform. Ele detecta 19 padrões diferentes, leva as projeções de Fibonacci tão a sério quanto você, exibe a Zona de Reversão Potencial (PRZ) e encontra níveis adequados de stop loss e take-profit. [ Guia de instalação | Guia de atualização | Solução de problemas | FAQ | Todos os produtos ] Detecta 19 formações harmônicas de preços diferentes Tr
299 USD
Cansado de traçar linhas de suporte e resistência? A Resistência de suporte é um indicador de período múltiplo que detecta e plota automaticamente linhas de suporte e resistência no gráfico com um toque muito interessante: conforme os níveis de preços são testados ao longo do tempo e sua importância aumenta, as linhas se tornam mais espessas e mais escuras. [ Guia de instalação | Guia de atualização | Solução de problemas | FAQ | Todos os produtos ] Melhore sua análise técnica da noite para o d
149 USD
XQ Indicator MT5
Marzena Maria Szmit
3.25 (4)
The signal conditions are a combination of three indicators, and XQ Forex Indicators only display  medium and long-term trends . The indicator's efficacy has been improved with the addition of a filter that blocks out false signals. The XQ Forex Indicator can be used on  FX pairs, CFDs, and Cryptocurrencies . There are two type of signals:  Buy or Sell and Big Long or Big Short It is possible to enable sending emails when a major trend-change signal is detected, as well as to display the alerts
179 USD
The Price Action Finder Multi indicator is a multi-currency and multi-timeframe indicator. It searches for patterns of the Price Action system on all standard time frames at once and on a large (up to 60) number of instruments (currencies, stocks, metals, etc.). The resulting patterns are placed by the indicator in a table at the bottom of the screen. Patterns: At the moment, the indicator contains the following patterns: Outside bar , Inside bar , Pin bar , Force bar , PPR , as well as the In
149 USD
- 50% OFF - Telegram group : https://t.me/+5RIceImV_OJmNDA0 MT4 version : https://www.mql5.com/en/market/product/84526?source=Unknown%3Ahttps%3A%2F%2Fwww.mql5.com%2Fen%2Fmarket%2Fmy Master Pullback is a complete system that gives unique trading opportunities and a clear indication of the market: trend, signals as well as stop loss and take profit levels. This system has been designed to be as simple as possible and detects extreme overbought and oversold zones, support and resistance levels,
99.99 USD
Introduction to Fibonacci Volatility Indicator Volatility indicator can help you to detect any statistical advantage for your trading. Especially, if you are trading with Price Action and Price Patterns, then we recommend to use the Volatility indicator together with your strategy. Especically, Fibonacci Volatility indicator combines the market volatiltiy with Fibonacci Analysis to provide you more advanced volatiltiy indicator. Main Features Fibonacci Volatility in Z score Configuration Mode Fi
100 USD
TPA True Price Action indicator reveals the true price action of the market makers through 100% non-repainting signals strictly at the close of a candle! TPA shows entries and re-entries, every time the bulls are definitely stronger than the bears and vice versa. Not to confuse with red/green candles. The shift of power gets confirmed at the earliest stage and is ONE exit strategy of several. There are available now two free parts of the TPA User Guide for our customers. The first "The Basics"
168 USD
EFW Pattern Trader is a powerful pattern scanner for Forex and Stock trading. The pattern detection in EFW Pattern Trader uses the Fractal Wave Theory, which captures the endless up and down movement of the market. Therefore, EFW Pattern Trader can be considered as the robust price action indicator. Any patterns in EFW Pattern Trader can be backtested visually in your strategy tester. Visual backtesting with pattern will show you how pattern will likely behave in the live trading. Therefore, you
100 USD
User Support Paid subscribers may request to join the WTGS Workshop @DB_WTI after emailing your Twitter handle and the proof of subscription to wtg.system.international@gmail.com . The System WTGS Navigator Saturn consists of six components: TrendFinder Saturn: Internal Trending   Confirmation   Titan: Internal Trending   Indicator Outer Ring: External Trending Indicator Inner Ring: External Trending Confirmation Data: The time-lapse of a trend on any given timeframe Disclaimers Although every
90 USD
User Support Paid subscribers may request to join the WTGS Workshop   @DB_WTI after emailing your Twitter handle and the proof of subscription to   wtg.system.international@gmail.com . The System WTGS Navigator Overlay consists of two components: Dynamic Butterfly Footprints Overlay Disclaimers Although every effort has been made when designing WTGS Navigator Overlay, WTG makes no warranties, expressed or implied, or representations as to the accuracy or profitability of the system. WTG assume
90 USD
The Volume by Price Indicator for MetaTrader 5 features Volume Profile and Market Profile TPO (Time Price Opportunity). Get valuable insights out of currencies, equities and commodities data. Gain an edge trading financial markets. Volume and TPO histogram bar, line and metric charts. TPO letter and block marker charts including split structures. Positioning and styling options to suit the user's needs and context. Volume Profile and Market Profile TPO Point of Control (VPOC and TPOC), Imbalanc
259 USD
Heatmap Volume Profile
Olexandr Savchuk
4.25 (4)
A Heatmap with a Volume Profile is like a thermal imager or x-ray machine. It will help you to estimate the relative distribution of volume during the price movement and to understand  the relationship between volume and price. Indicator Volume Profile "Volumos Maxima" is a powerful tool for analyzing this relationship. After simple experimentation with heatmap, you can find that each trading instrument has its own “ characteristic ” way of distributing volume. And this will help you to make a b
80 USD
PipFinite Volume Critical MT5
Karlo Wilson Vendiola
5 (2)
Volume Gives Depth To Price Action! Volume Critical can accurately locate the cheapest areas to place trades. Enter reversals as early as possible to get the best Risk Reward setups! Features Aggressive algorithm that anticipates reversals Volume Classifications Gray Histograms - Normal Volume, average market activity Orange Histogram - Trending Volume, increased market activity Pink Histograms - Overbought Volume, we can wait for further confirmation to sell Blue Histograms - Oversold Condit
88 USD
The idea of this trading system from the EMA with a Mediante price from the EMA indicators is based exactly 100% from Ripster47 trading system, me is just the person to create it on the MT5 platform, but with alerts for your own buy/sell settings.  Hereby I make a copy from Ripster47 explanation for using that system: " EMA  Cloud By Ripster EMA  Cloud System is a Trading System Invented by Ripster where areas are shaded between two desired EMAs. The concept implies the  EMA  cloud area
89 USD
Introduction to X3 Chart Pattern Scanner X3 Cherart Pattern Scanner is the non-repainting and non-lagging indicator detecting X3 chart patterns including Harmonic pattern, Elliott Wave pattern, X3 patterns, and Japanese Candlestick patterns. Historical patterns match with signal patterns. Hence, you can readily develop the solid trading strategy in your chart. More importantly, this superb pattern scanner can detect the optimal pattern of its kind. In addition, you can switch on and off individu
250 USD
Ultimate Supply Demand MT5
Ramon Sobrevals Arce
5 (3)
After working during many months, with the help of Neural Networks, we have perfected the ultimate tool you are going to need for identifying key price levels (Supports and Resistances) and Supply and Demand zones. Perfectly suitable to trigger your trades, set up your future actions, decide your Take Profit and Stop Loss levels, and confirm the market direction. Price will always move between those levels, bouncing or breaking; from one zone to another, all the remaining movements are just mark
79 USD
Apresentando o Indicador Zeus: Sua Ferramenta Definitiva para Romper com os Lucros no Trading. Este indicador simplifica a negociação, eliminando a necessidade de uma análise detalhada com estratégias de rompimento. Ele desenha automaticamente zonas com base nos seus intervalos de tempo predefinidos, sugere níveis de Stop Loss (SL), Take Profit (TP) e Trailing Stop. O Indicador Zeus irá notificá-lo prontamente e exibir setas de sinal quando o preço se aproximar dos pontos de entrada de compra ou
93.99 USD
MACD Intraday Trend PRO é um indicador desenvolvido por meio de uma adaptação feita do MACD original criado por Gerald Appel na década de 1960. Ao longo dos anos de negociação, observou-se que alterando os parâmetros do MACD com as proporções de Fibonacci alcançamos uma melhor apresentação da continuidade dos movimentos de tendência, sendo possível detectar de forma mais eficiente o início e o fim de uma tendência de preço. Devido à sua eficiência na detecção de tendências de preços, também é po
77 USD
Mais do autor
Fractal 358 + Caixote Indicador 'dois em um' que combina a identificação do Caixote , um padrão gráfico usado para definir entradas, com o Fractal 358 , um método que permite a leitura e previsão de movimento de preços, mostrando tanto as saídas como ameaças às operações no mini-índice (WIN) e ações da B3. Estratégia Operacional Este indicador pode ser usado praticamente com qualquer ativo e tempo gráfico, mas é mais assertivo com alguns do que outros. Por padrão, está configurado para o mini-í
48 USD
Golden Limit
Renato Fridschtein
Não há limites! O indicador Golden Limit é a ferramenta definitiva para ter uma leitura clara e fácil dos movimentos do preço no gráfico. Ele projeta faixas de suporte e resistência, calculadas por modelos estatísticos envolvendo Price Action e a sequência de Fibonacci, revelando de antemão o comportamento dos preços e os melhores locais para operar (e para não operar). Ainda conta com duas médias móveis para auxiliar na escolha das melhores entradas. O Método Golden Limit foi criado a p
99 USD
Filtro:
Sem comentários
Responder ao comentário
Versão 4.5 2021.11.16
Atualizações novembro.21

1. Atualização visual do indicador: Ao invés da coluna à direita, os fractais são mostrados junto aos candles. As cores podem ser customizadas de acordo com as preferências do trader.

2. O novo parâmetro: Imprimir informações na guia Experts?, foi adicionado para controlar se o indicador irá imprimir uma mensagem informando os padrões gráficos que encontrar, na aba Experts da janela de ferramentas.

3. Otimizações de código