BB MA Cross for MT5
- Indicadores
- Koji Kobayashi
- Versão: 5.0
- Atualizado: 21 janeiro 2024
- Ativações: 5
移動平均線クロス、ボリンジャーと移動平均線のクロス、移動平均線の角度でサイン表示
このインジケータは3つのパターンでサインを表示(切り替え可能)します。
① 移動平均線のクロス
② ボリンジャーバンドと短期移動平均線とのクロス
③ ボリンジャーバンドと短期移動平均線とのクロスと、中期移動平均線と長期移動平均線の角度
⓸ ボリンジャーバンドと短期移動平均線とのクロス(サインを交互に表示)
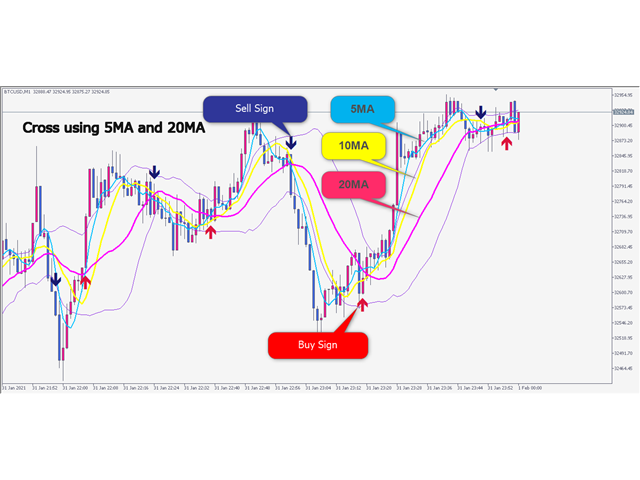
移動平均線のクロス
指定した短期移動平均線と長期移動平均線のゴールデンクロスでは買いサイン、デットクロスでは売りサインを表示します。
ディフォルトでは短期は5,長期は20となっています。もちろん変更可能になります。
移動平均線の種類をEMA(指数平滑移動平均線)やSMMA(平滑化移動平均)などに変更可能で適する価格も変更可能になります。
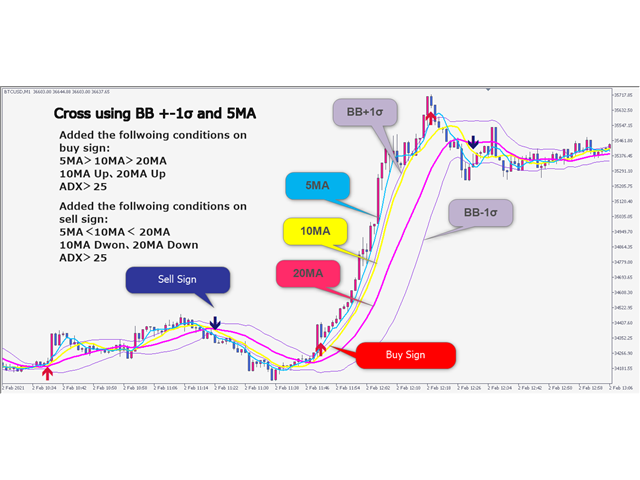
ボリンジャーバンドと短期移動平均線のクロス
ボリンジャーバンド(以降BB)と短期移動平均線のクロスでサインを表示します。
ディフォルトではBB+1σと5MAのゴールデンクロスで買いサイン、BB-1σと5MAのデットクロスで売りサインでサインを表示します。
BBの期間や、BBの標準偏差は変更可能になります。また短期、中期、長期の移動平均線の期間は変更可能になります。
追加の条件として買いであれば移動平均線のオーダー5MA>10MA>20MA、10MAと20MAが上昇中である、レンジ時の回避のためにADX>25が含まれています。
売りの場合は、移動平均線の条件5MA<10MA<20MA、10MAと20MAが下降中である、レンジ時の回避のためにADX>25が含まれています。
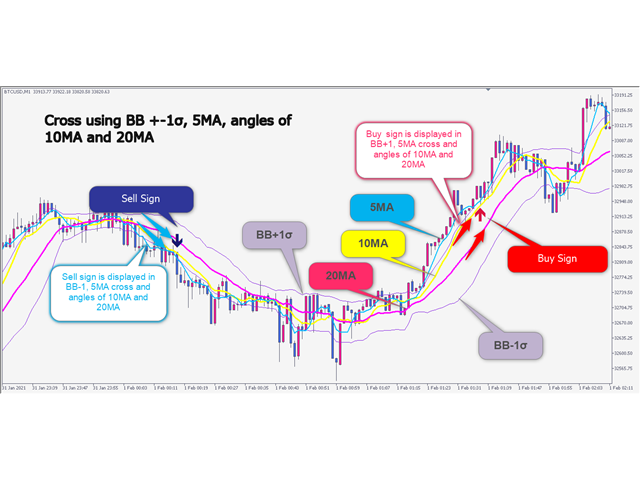
ボリンジャーバンドと短期移動平均線とのクロスと、中期移動平均線と長期移動平均線の角度
上記BBと短期移動平均線のクロスの条件に加えて、中期と長期移動平均線の角度でサインを表示します。
ディフォルトではBB±1σと5MAのクロスと設定した角度以上または以下でサインが表示されます。
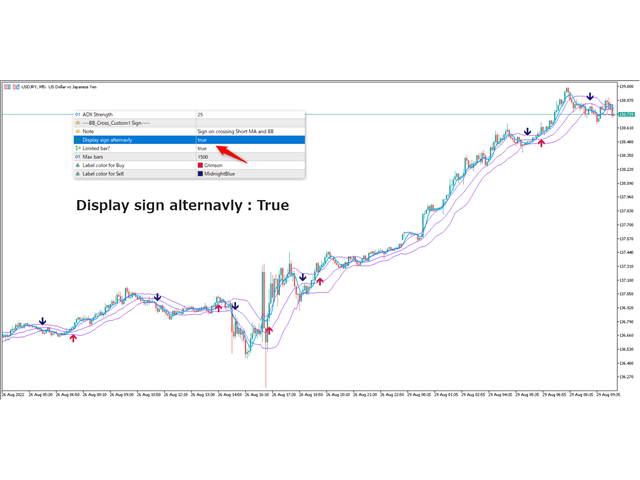
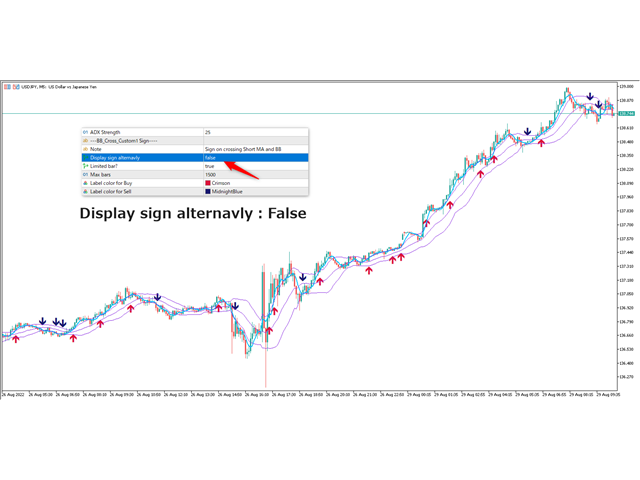
ボリンジャーバンドと短期移動平均線のクロス(サインを交互に表示)
BBと短期移動平均線のクロスでサインを交互に表示します。
ディフォルトではBB+1σと5MAのゴールデンクロスで買いサイン、BB-1σと5MAのデットクロスで売りサインでサインを交互に表示します。こちらには追加条件はありません。
インジケータを複数適用可能
Indicator Noを変えることによるこのインジケータを複数適用することができます。
これにより違う MAの期間による ゴールデンクロスと デットクロスのサインを表示できます。
例えばIndicator No1は5MAと20MAのクロス、Indicator No2は20MAと50MAのクロス、Indicator No3はBBと5MAのクロスなど
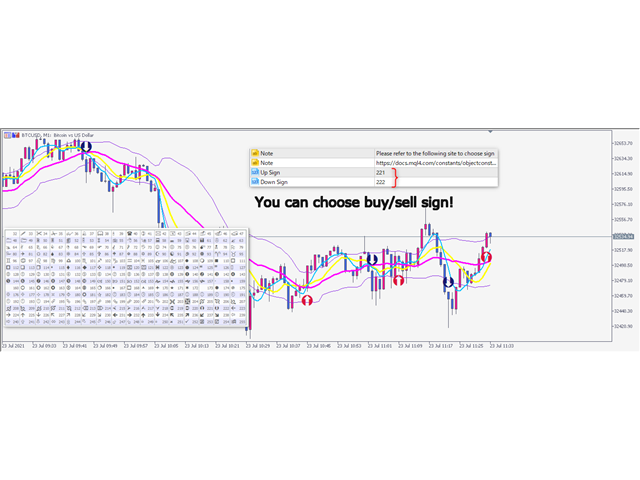
表示するサインを変更可能
表示するサインを、以下を参考にして入力することにより表示するサインを変更可能になります。もちろんインジケータのプロパティーのカラータブでサインの色や大きさを変更することも可能になります。
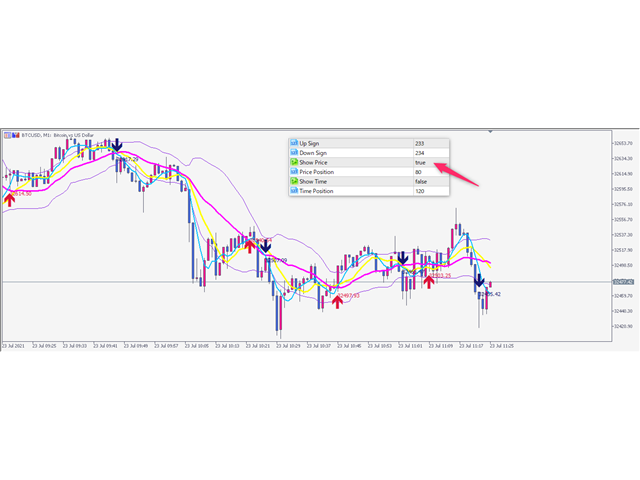
サインが表示された価格
設定することによりサインが表示された価格を表示することが可能になります。
ディフォルトでは表示されないようになっています。
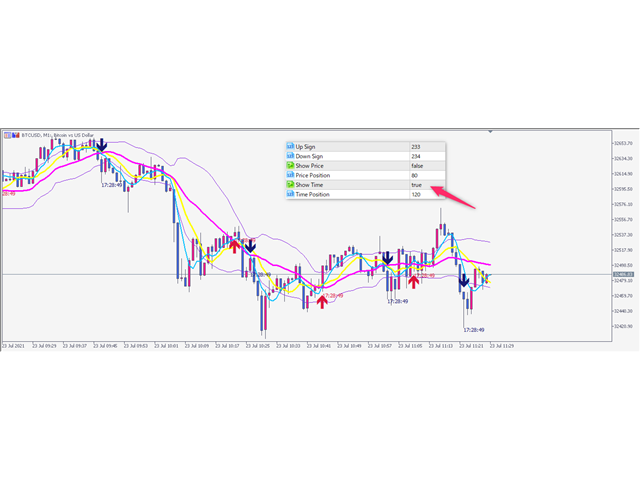
サインが表示された時間
設定することによりサインが表示されたときの時間を表示することが可能になります。
ディフォルトでは表示されないようになっています。
サインのアラート表示とメール通知およびSNSの通知
サイン発生時のアラート表示を設定により有効にしたり無効にしたりできます。
サイン発生時のアラート表示を設定により有効にしたり無効にしたりできます。
設定によりサイン発生時のメール通知やSNSへの通知を可能になります。
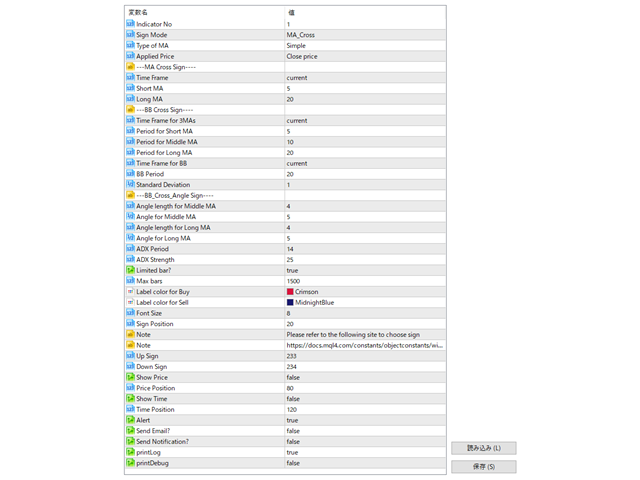
パラメータ説明:
■Indicator No:この数字を変更することによりこのインジケータを複数適用することができます。
■Sign Mode:
MA_Cross:MAのクロスで買いサインや売りサインを表示します。
BB_Cross:BBと短期(5MA)のクロスでサインを表示します。
BB_Cross_Angle:BBと短期(5MA)のクロスと中期と長期のMAの角度の条件でサインを表示します。
---MA Cross Sign----
■Time Frame:MA Cross で使用する時間足を設定します。
■Short MA:MA_Crossで使用する短期期間の設定します。
■Long MA:MA_Crossで使用する長期期間の設定します。
---BB Cross Sign----
■Time Frame for 3MAs:BB Crossで使用する時間足を設定します。
■Period for Short MA:短期MAの期間を設定、BBのクロスで使用します。ディフォルトは5
■Period for Middle MA:中期MAの期間を設定、MAの角度で使用します。ディフォルトは10
■Period for Long MA:長期MAの期間を設定、MAの角度で使用します。ディフォルトは20
■Time Frame for BB:BBで使用する時間足を設定します。
■BB Period:BBの期間を設定します。
■Standard Deviation 1:BBの標準偏差を設定します。
---BB_Cross_Angle Sign----
■Angle length for Middle and Long MA:MAの角度の計算するための期間を設定します。
■Angle for Middle and Long MA:MAの角度を設定します。
■ADX Period:ADXで使用する期間を設定します。
■ADX Strength:ADXの強さを設定します。これを設定することによりレンジ回避の1つのフィルターになります。
---BB_Cross_Custom1 Sign----
■Display sign alternavly:BBと短期移動平均線のクロスでサインを買いサインと売りサインを交互に表示を設定します。
■Limited bar?:表示に使用するバーを制限するかどうかを設定します。
■Max bars:使用するバーの本数を設定します。
■Label color for buy:買いサインの色の設定します。
■Label color for sell:売りサインの色の設定します。
■Font Size:価格表示で使用されるフォントサイズを設定します。
■Sign Position:買いサインと売りサインの位置を設定します。
■Up Sign:買いで使用するサインを設定します。
■Down Sign:売りで使用するサインを設定します。
変更したい場合にはこちらを参考にして数字を入力してください。
https://docs.mql4.com/constants/objectconstants/wingdings
■Show price:価格を表示するか設定します。
■Price Position:価格を表示する位置を設定します。
■Show Time:時間を表示するか設定します。
■Time Position:時間を表示する位置を設定します。
■Alert:こちらを有効にすることにより買いサインまたは売りサインをアラートで表示します。
■Send E-Mail(Eメール):
こちらを有効にすることにより決済の結果をEメールにて送ることが可能になります。
■Send notifications(携帯への通知機能):
こちらを有効にすることにより携帯にインストールしたMT5に通知されるようになります。
■printLog:こちらを有効にすることのよりログがエキスパートログに
出力されるようになります。
■printDegug:こちらを有効にすることのよりさらなるログがエキスパートログに
出力されるようになります。