Half Trend TP SL
- Indicadores
- Jalitha K Johny
- Versão: 2.50
- Atualizado: 3 agosto 2021
- Ativações: 5
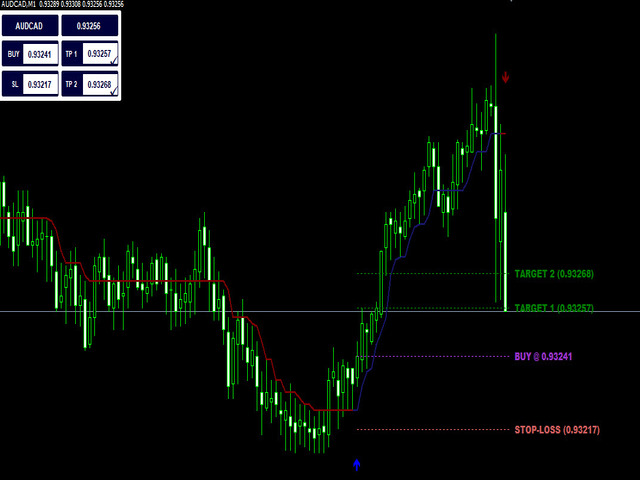
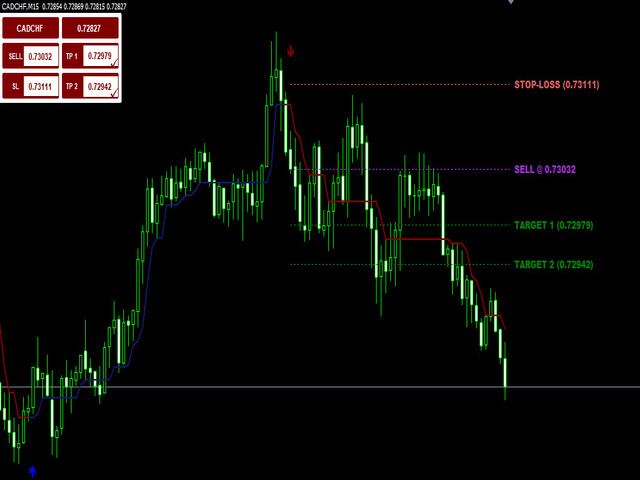
Half Trend TPSL Buy Sell Indicator calculates the open and close of the price bars over the selected period of time and applies its own
calculation method to find an average line of the price movement.
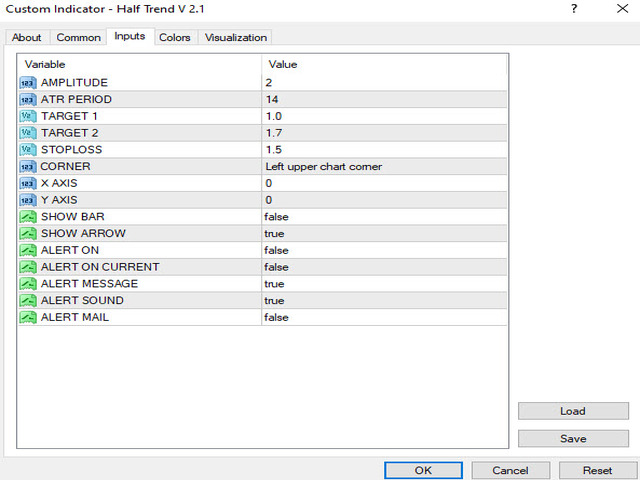
ATR based Take Profit and Stop Loss
ATR is a measure of volatility over a specified period of time. The most common length is 14, which is also a common length for oscillators, such as the relative strength index (RSI) and stochastics. A higher ATR indicates a more volatile market, while a lower ATR indicates a less volatile market.