WaveTheory Fully automatic calculation
- Indicadores
- Kaijun Wang
- Versão: 7.10
- Atualizado: 11 abril 2023
- Ativações: 5
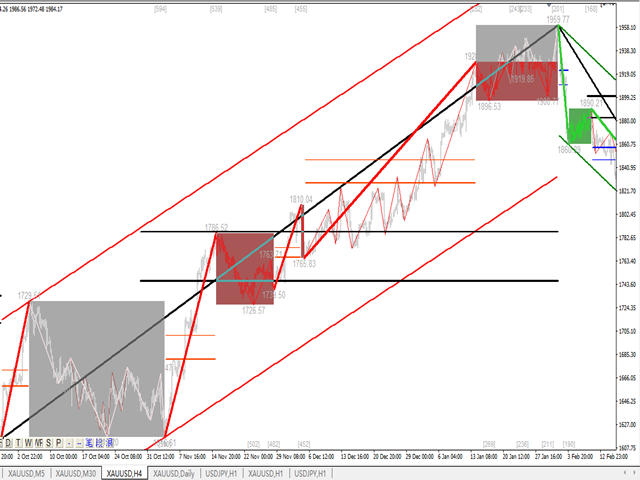
Este indicador é um indicador de análise automática de onda perfeito para negociação prática!
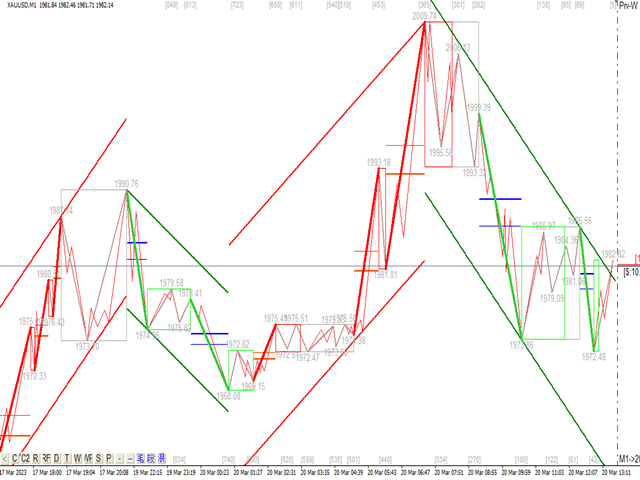
A definição padronizada da banda não é mais uma onda de pessoas diferentes, e o desenho de interferências feitas pelo homem é eliminado, o que desempenha um papel fundamental na análise rigorosa da abordagem. =>Increase the choice of international style mode, (red fall green rise style)
⭐⭐⭐ Atualmente comprando desconto! ⭐⭐⭐
Conteúdo do índice:
1 Onda básica: Primeiro, encontramos o ponto de inflexão da flutuação básica no processo de flutuação de preço. Claro, sua ordem não é muito forte, o que fornece uma base para o próximo cálculo.
2 Banda secundária : com base na onda básica, uma banda secundária mais óbvia é obtida por meio da análise de algoritmo, e a banda secundária fornece uma base para a análise de onda
3 Onda: há uma tendência mais clara e uma direção mais clara e intuitiva. Para analisar se uma onda continua, você precisa olhar para a forma da banda da onda secundária e analisar a composição da onda secundária para obter a previsão subsequente do aceno.
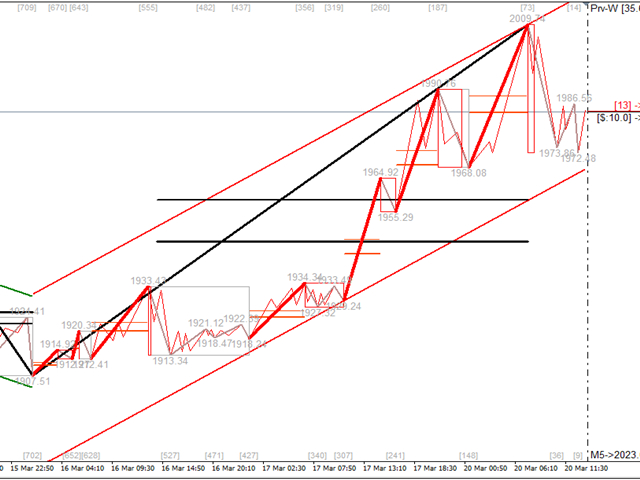
4 Canal: O cálculo do canal usa um método de regressão linear para o cálculo.
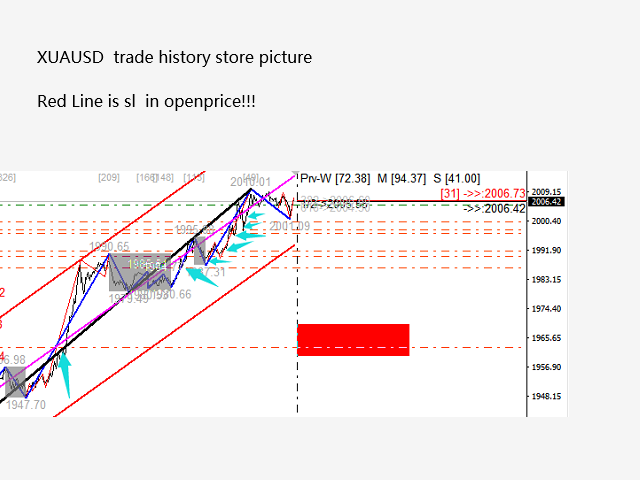
5 Retração: As duas retrações importantes na onda serão exibidas no final de cada onda. A força relativa dessas retrações importantes no combate real e a retração real determinam o momento da tendência
6 Intervalo de oscilação: O intervalo de oscilação é marcado no indicador
Combate indicador:
1. A fonte da teoria do combate real é a teoria ondulatória básica, a teoria taoísta.
2. A teoria do combate real é mais derivada do combate real, e você sempre ganhará lendo fotos milhares de vezes.
3. Originalmente, queria escrever alguma experiência prática, mas descobri que o plano de operação foi ligeiramente ajustado em diferentes variedades e pontos fortes. A transação é constantemente escrita e atualizada. A transação é como uma linha enterrada na areia, mesmo que se agarre a corda. Mas a areia continua mudando de forma.
4. Quando a onda for definida pela quantificação, a transação se tornará simples e eficaz, a tendência ficará muito clara, existe a tendência geral no coração e tudo se torna simples e eficaz.
5. Quer seja negociando à esquerda ou à direita, seja uma negociação de tendência ou oscilante, este conjunto de indicadores tem suas respostas. Todos precisam sentir o ritmo, nível, impulso e tempo da tendência e chocá-la é extremamente importante.
6. Para compreender as ondas e as ondas de negociação, devemos analisar os vários níveis e períodos.
Experiência real de combate:
1. A teoria das ondas e a teoria taoísta são escritas, mas não estão totalmente de acordo com as leis das flutuações naturais. Muitas situações difíceis serão encontradas no processo real de análise de transações.
2. Abaixo, podemos dividir o mercado em dois tipos, o mercado ordenado analisável e o mercado desordenado.
3. Existem tendências e choques no mercado ordenado e analisável. Este segmento do mercado pode ser analisado por nós, ou seja, a parte graphable e a parte negociável. Uma vez que esta parte seja encomendada, ela continuará com as características ordenadas, então Podemos obter lucro suficiente nisso
4. Mercado desordenado, as flutuações aparecerão desordenadas, diferentes dos choques, o mercado desordenado não pode participar.Pegando dinheiro em ordem, evitando na desordem.
Espero encontrar pessoas destinadas, compartilhar a alegria de negociar juntos e crescer juntos!
É mais adequado para ouro, petróleo bruto, libra-dia, bitcoin e outras variedades de tendências.
por kjoin.


这套波浪系统非常棒,解决了缠论的画线段问题,从级别的不断递推,分析行情有帮助,感谢作者