• Visão global
  • Comentários (4)
  • Discussão
  • O que há de novo

AutomaticZigZag

4.67
This is a non-parametric ZigZag providing 4 different methods of calculation.
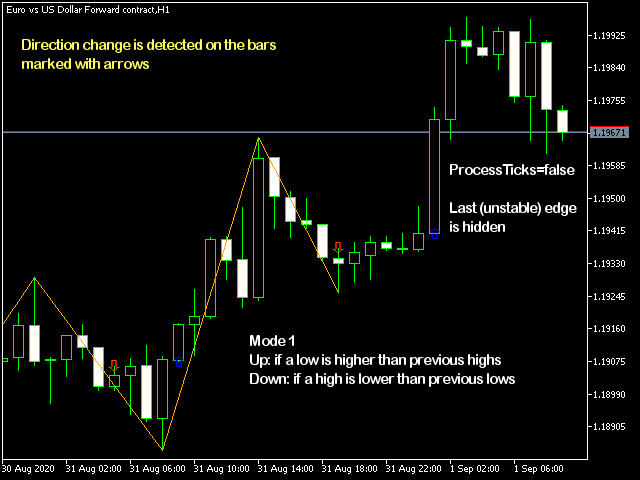
  1. Upward edge continues on new bars while their `highs` are above highest `low` among previous bars, downward edge continues on next bars while their `lows` are below lowest `high` among previous;
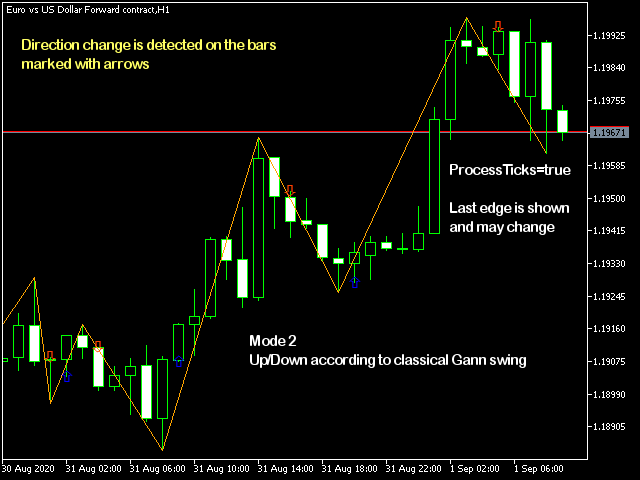
  2. Gann swing: upward edge continues while `highs` and `lows` are higher than on the left adjacent bar, downward edge continues while `highs` and `lows` are lower than on the left adjacent bar. Inside bars (with lower `high` and higher `low`) and outside bars (with higher `highs` and lower `low`) do not affect edge direction;
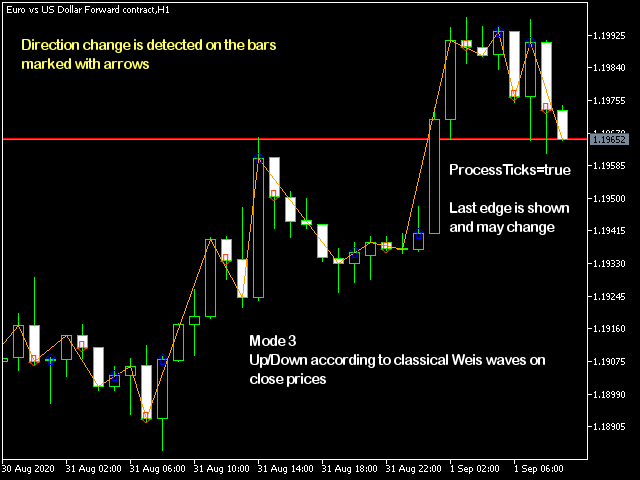
  3. Weis wave: upward edge continues while `close` prices increase, downward edge continues while `close` prices decrease;
  4. Retracement by price % or Self-Adjusting Level.
In addition to zigzag itself (shown in orange color), the indicator shows signal marks on those bars where zigzag direction changes. The blue arrow up denotes that new bullish edge is started (but not yet completed), whereas the red arrow down denotes that new bearish edge is emerging (but not yet completed). This marks can be used as trading signals.


Parameters

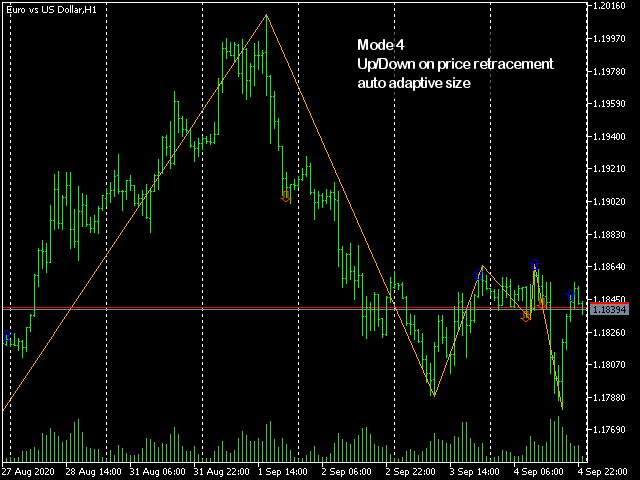
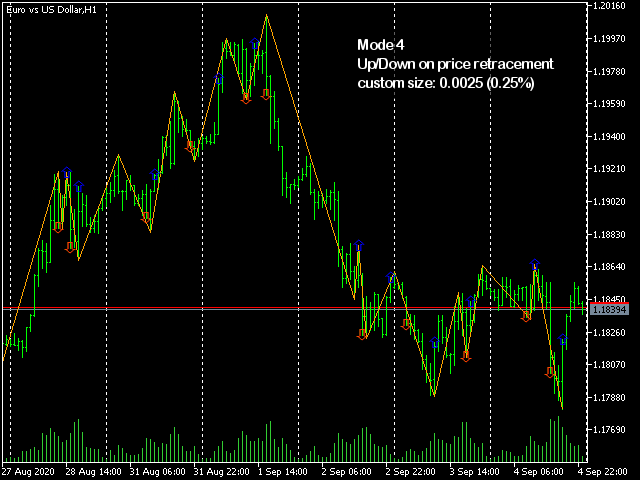
  • Mode - one of supported methods: High below Low/Low above High, Gann swing, Close vs Close (Weis wave), Retracement;
  • ProcessTicks - an option to calculate ZigZag on every tick, by default - false; with this value, the last incomplete edge is not shown until it's formed comletely and new (hidden yet) edge is started; if the option is set to true, the last incomplete edge is shown on the chart and my be redrawn according to ongoing price action;
  • RetracementPercent - size of price retracement (%), which changes zigzag direction (used in Retracement or Close vs Close modes only); 0 by default means special auto-adaptive retracement algorithm (see below);


NOTE. As with any other ZigZag implementation, the indicator may redraw the last edge if it's not yet completed (and tick processing is enabled). This is by design. All previous edges and up/down marks are stable.


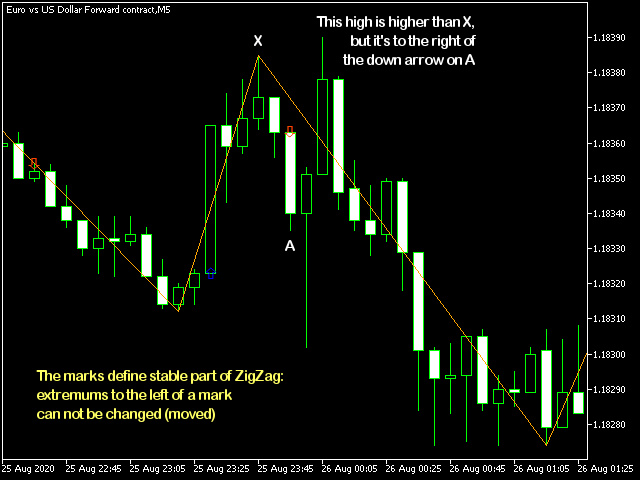
WARNING. While using the 1-st mode, the extremums may not always hit visually most prominent candles. This happens if a higher high or a lower low occurs on a bar where new edge is already forming in opposite direction. For example, if a down arrow mark is shown on the bar A, that means that downward edge is forming on the next bars to the right of A, and hence only lows are processed there for searching extremums. High extremum should remain standing to the left of A only. As a result, if a higher high is located between the bar A and next low extremum, the high can not be marked as high extremum (because it's a section of downward edge). This behaviour is intentional and ensures stability of already formed edges. This is according to the 1-st algorithm. Please, find an explanation on one of the screenshots below.


Auto-adaptive retracement level is calculated by the formula:

Retracement = LastExtreme ± |LastEdge| / sqrt(N + 1),

where N is a number of bars between the last extreme and current bar. On the current bar N = 0, hence the retracement size is equal to 1, that is the total size of the last edge. On single bar distance the size is about 0.71, on 3 bars - 0.5, on 8 bars - 1/3 of the last edge price change.


Comentários 4
Corrado Bruni
403
Corrado Bruni 2023.02.13 19:04 
 

For the Gann Swing Chart finally an indicator done right, thank you.

If there was also the option for the top level on the bullish swing candle and bottom on the bearish swing candle, on a higher tf (selectable), it would be complete.

On the weekly and daily tf I have been using it for about 9 years.

Also having an alarm when the first candle closes above the level.

Aleksandr Tamonin
4109
Aleksandr Tamonin 2021.01.23 20:09 
 

Спасибо, очень хороший инструмент!

Calogero Vella
391
Calogero Vella 2024.03.28 08:13 
 

Nice indicator, many thanks for that. Unfortunately, the arrows are too close to the bars. You can hardly recognize them. But otherwise quite useful. Thank you

Produtos recomendados
The   Pivot Point indicator   automatically calculates and displays the pivot point line and support and resistance levels. Pivot can be calculated according to the Classic, Floor, Fibonacci, Woodie, Camarilla or DeMark formula. It is also possible to select the period for calculating the indicator. A trader can choose from daily, weekly, monthly, or user-defined periods. Types of pivots Classic Floor Fibonacci Woodie Camarilla DeMark Main features The indicator shows the current and histor
FREE
Are you tired of drawing trendlines every time you're analyzing charts? Or perhaps you would like more consistency in your technical analysis. Then this is for you. This indicator will draw trend lines automatically when dropped on a chart. How it works Works similar to standard deviation channel found on mt4 and mt5. It has 2 parameters: 1. Starting Bar 2. Number of bars for calculation The   starting bar   is the bar which drawing of the trend lines will begin, while the   number of bars for c
FREE
RenkoExpert
Andrey Goida
3.67 (3)
Renko Expert Advisor based on Renko bar simulation.    The EA has two options for building Renko bars. Classic and ATR. In the classic version, renko bars are marked with areas on the main chart; in the ATR version, renko bars are modeled and drawn in the indicator window. Modeling renko bars inside the EA allows you to optimize the robot better than drawing renko bars offline.      Telegramm channel   Set file Our second robot RENKOTREND Does not use martingale!  Trades opened by the robot co
FREE
This indicator is stand alone version from  MP Pivot Levels  (All in one) containing Demark's Pivots. Calculations:     PP = X / 4     R1 = X / 2 - LOWprev     S1 = X / 2 - HIGHprev Uses: When the pair currency price may change the direction of movement. Possible constraints of support and resistance that creates plateaus for the currency pair prices. Tendency identification by comparing the present prices according to current day's pivot point and also the prior day's pivot points. ___________
FREE
AliPivot Points is a Meta Trader 5 Indicator that draws you the latest pivot points. You can choose from timeframes ranging from 1 Minute to 1 Month. Calculation methods for pivot points includes: Classic Pivot Points Camarilla Pivot Points Fibonacci Pivot Points Woodie Pivot Points You can personalize the line colors, style, and width to suit your preference. The indicator displays values on the right side of the chart. AliPivot Points values can also be utilized by developers for creating Expe
FREE
Important Lines
Terence Gronowski
4.88 (26)
This indicator displays Pivot-Lines, preday high and low, preday close and the minimum and maximum of the previous hour. You just have to put this single indicator to the chart to have all these important lines, no need to setup many single indicators. Why certain lines are important Preday high and low : These are watched by traders who trade in a daily chart. Very often, if price climbs over or falls under a preday low/high there is an acceleration in buying/selling. It is a breakout out of
FREE
Este é um indicador de agressão comprador e vendedor que analisa o formato de cada vela e projeta esses dados em forma de histograma. Há 4 histogramas em um só. Na parte frontal temos dois: Superior - força compradora Inferior - força vendedor Na parte de trás temos também dois histogramas, ambos da mesma cor. Eles medem a força conjunta dos compradores e vendedores. Esses histogramas podem ser desativados nos Parâmetros de Entrada. É possível também ter o volume real ou de tick para fazer essa
FREE
Rainbow MT5
Jamal El Alama
4.33 (3)
Description : Rainbow MT5 is a technical indicator based on Moving Average with period 34 and very easy to use. When price crosses above MA and MA changes color to green, then this is a signal to buy. When price crosses below MA and MA changes color to red, then this is a signal to sell. The Expert advisor ( Rainbow EA MT5 ) based on Rainbow MT5 indicator is now available here . MT4 version is available here .
FREE
LT Donchian Channel
Thiago Duarte
4.75 (4)
Donchian Channel (ou canal de Donchian) é um indicador criado por  Richard Donchian. Ele é  formado tomando a máxima mais alta e a mais baixa mais baixa do último período especificado em velas. A área entre alta e baixa é o canal para o período escolhido. Sua configuração é simples. É possível ter a média entre a linha superior e inferior além de alertas quando o preço atinge um dos lados. Se tiver alguma dúvida ou encontrar alguma falha, me contate. Faça bom uso!
FREE
Basic Renko MT5
Mehran Sepah Mansoor
The   Basic Renko   indicator shows the Renko boxes on the main chart. MT4 Version Its advantage is that you have access to both the main chart and the Renko chart at the same time. In addition, you can find out how many bars it took to form each Renko box. When a reversal occurs, the indicator will notify you with pop-up, push and email alerts. This indicator does not have complicated settings, and beginners and professionals can easily use it in their strategies. Through the inputs, y ou can
FREE
PZ Penta O MT5
PZ TRADING SLU
4 (6)
The Penta-O is a 6-point retracement harmonacci pattern which usually precedes big market movements. Penta-O patterns can expand and repaint quite a bit. To make things easier this indicator implements a twist: it waits for a donchian breakout in the right direction before signaling the trade. The end result is an otherwise repainting indicator with a very reliable trading signal. The donchian breakout period is entered as an input. [ Installation Guide | Update Guide | Troubleshooting | FAQ | A
FREE
Automatic Trendlines
Pasi Hakamaki
4.63 (48)
O indicador desenha linhas de tendência no gráfico. Este indicador possui seis entradas. O usuário pode especificar rótulos alternativos para ambas as linhas. Se várias instâncias do indicador forem usadas, os rótulos devem ser diferentes. O usuário pode definir a largura e a cor das linhas e a profundidade que especifica quais picos significativos devem ser usados. Por exemplo, Depth = 10 define as linhas de tendência usando os picos e vales atuais que têm pelo menos 10 barras à direita e à esq
FREE
This indicator is stand alone version from  MP Pivot Levels  (All in one) containing Woodie Pivots. Woodie’s pivot points are made up of multiple key levels, calculated from past price points, in order to frame trades in a simplistic manner. The key levels include the ‘pivot’ itself, and multiple support and resistance levels (usually up to three each). Traders use these levels as a guide for future price movements when setting up trades. The pivot : (Previous high + previous low + 2 x previou
FREE
O Pivot Point Fibo RSJ é um indicador que traça as linhas de suporte e resistência do dia usando as proporções   de Fibonacci. Este indicador espetacular cria até 7 níveis de suporte e resistência por meio do Pivot Point usando proporções de Fibonacci. É fantástico como os preços respeitam cada nível deste suporte e resistência, onde é possível perceber possíveis pontos de entrada / saída de uma operação. Recursos Até 7 níveis de suporte e 7 níveis de resistência Defina as cores dos níveis in
FREE
The selective pin bar is designed to identify reversals. To use the selective pin bar effectively, traders typically look for Strong Rejection: The tail of the pin bar should extend significantly beyond the surrounding price action. It indicates that there was a sharp rejection of higher or lower prices during the trading period. A strong rejection suggests that the market sentiment may be changing.
FREE
Free automatic Fibonacci is an indicator that automatically plots a Fibonacci retracement based on the number of bars you select on the BarsToScan setting in the indicator. The Fibonacci is automatically updated in real time as new highest and lowest values appears amongst the selected bars. You can select which level values to be displayed in the indicator settings. You can also select the color of the levels thus enabling the trader to be able to attach the indicator several times with differe
FREE
Simple Weis Wave
Jean Jacques Huve Ribeiro
4.2 (5)
One of the best tools for analyzing volume, Weis Wave was idelized by David Weis, to facilitate the reading of directional flow. For the VSA method disciples it is an evolution of the practices created by Richard Wycoff, facilitating a predictive reading of the market, always seeking an accumulation and distribution of the negotiated contracts. Cumulative wave volume  Range of wave ( removed) Average Wave volume Ref "Tim Ord lectures" ( removed)
FREE
My Candle Patterns
Francisco Gomes Da Silva
5 (1)
Este indicador é uma versão demo do My candle completo que pode ser baixado aqui: Candle Patterns Creator com a versão completa você pode criar suas próprias regras de candle além de pode modificar um padrão de candle tradicional para ficar mais assertivo de acordo com sua estratégia No indicador tem varias regras de candles de exemplo, mas aqui vou demostrar apenas algumas: Pattern Rule Candle Green C > O Candle Red C < O Doji C = O Hammer (C > O and (C-O) *2 < O-L and (C-O) *0.5 > H-C) o
FREE
White Weis Volume Ticks
Ricardo Almeida Branco
5 (3)
White Weis Volume Este indicador mostra o somatório do volume em cada onda, bulish ou bearish, conforme idealizado por David Weis, mas traz um importante adicional que é a marcação da barra de maior volume da onda (White Bar)! Na codificação do indicador, foi buscado otimizar o código para exigir o mínimo processamento durante o uso e não sobrecarregar o mt5. O indicador pode ser usado para análise e estudo pré pregão, onde o trader analisa possíveis pontos de suporte e resistência com
Demand and supply zones Support and Resistance areas Show broken zones Show tested and untested zones Show weak zones Fractal factors Notifications when price reaches point of Interest with Push notifications and pop ups Customizable History Clickable Works on all Timeframes Works on all pairs. Free for a while till further notice and changes. The demand and supply bot coming soon
FREE
Follow The Line MT5
Oliver Gideon Amofa Appiah
4.4 (30)
This indicator obeys the popular maxim that: "THE TREND IS YOUR FRIEND" It paints a GREEN line for BUY and also paints a RED line for SELL. (you can change the colors). It gives alarms and alerts of all kinds. IT DOES NOT REPAINT and can be used for all currency pairs and timeframes. Yes, as easy and simple as that. Even a newbie can use it to make great and reliable trades. NB: For best results, get my other premium indicators for more powerful and reliable signals. Get them here: https://www.m
FREE
Swiss VWAPsimple
Terence Gronowski
5 (4)
Swiss VWAPsimple Motivation Did not find free VWAP that works, the one that I found craseh. So I created a VWAP which calculates values only for the actual day. So computer resouces are not over stressed. What is VWAP, how is it used?  VWAP stands for Volume Weighed Average Price, it calculates the running sum of tick volume and the runnung sum of price times tickvolume. The division of these sums result in a weighed price (Sum P*V/Sum V). The calculation starts normally at midnight. The value
FREE
The utility draws pivot levels based on a selection from day week month The previous candlestick of the selected timeframe is taken and the values for the levels are calculated using the following formulas: Pivot = (high + close + low) / 3 R1 = ( 2 * Pivot) - low S1 = ( 2 * Pivot) - high R2 = Pivot + (R1 -S1) R3 = high + ( 2 * (Pivot - low)) S2 = Pivot - (R1 - S1) S3 = low - ( 2 * (high - Pivot)); The style and thickness for all lines are adjusted. The colors for the R, Pivot and S line
FREE
Cybertrade Keltner Channels
Emanuel Andriato
4.67 (3)
Cybertrade Keltner Channels - MT5 Criado por Chester Keltner, esse é um indicador de volatilidade utilizado pela análise técnica. É possível seguir a tendência dos preços de ativos financeiros e gerar padrões de suporte e resistência. Além disso, os envelopes são uma forma de acompanhar a volatilidade, a fim de identificar oportunidades de compra e venda desses ativos. Funciona em períodos maiores do que o período visível no gráfico. Todos os valores estão disponíveis em forma de buffers para
FREE
Value Chart Candlesticks
Flavio Javier Jarabeck
4.75 (8)
The idea of a Value Chart indicator was presented in the very good book I read back in 2020 , " Dynamic Trading Indicators: Winning with Value Charts and Price Action Profile ", from the authors Mark Helweg and David Stendahl. The idea is simple and the result is pure genius: Present candlestick Price analysis in a detrended way! HOW TO READ THIS INDICATOR Look for Overbought and Oversold levels. Of course, you will need to test the settings a lot to find the "correct" one for your approach.
FREE
This indicator is an automated version of the Fibonacci retracement (Fib) indicator. Deciding the best areas to use when drawing the fib can be tricky and this  indicator was made with that in mind. When you drop it on the chart it will automatically choose the best points to draw the fib with, but in case you aren't satisfied with those regions, you can adjust it as you wish.
FREE
Bar Color Trend
Germano Chagas
4.5 (10)
Combinando o melhor de Price Action , Movimento Direcional , e análise de Divergência/Convergência , o indicador Candle Color Trend is é uma forma fácil e confiável de identificar a direção da tendência. O indicador automaticamente pinta os candles de acordo com a premissa de que a tendência de alta é definida por preços que formam uma série de topos e fundos ascendentes. Por outro lado, a tendência de baixa é definido por preços que formam uma série de topos e fundos descendentes. Adicionalment
FREE
Renko Chart
Marcin Konieczny
4.27 (11)
This indicator allows to display Renko charts in the indicator window. Renko charts show only price movements that are bigger than the specified box size. It helps to eliminate noise and allows to focus on main trends. Time is not a factor here. Only price movements are taken into account. That's why Renko chart is not synchronized with the main chart it is attached to. Indicator works in two modes: CLOSE - only close prices are taken into account while building the chart HIGH_LOW - only high/
FREE
Amiguinhos Bar Counter
Eduardo Correia Da Silva
3 (2)
O Amiguinho's Bar Counter é um indicador de price action para exibir a contagem de barras (candles) com algumas opções interessantes. Sobre o parâmetro "Período de análise": caso o timeframe corrente estiver em minutos, então o período de análise será considerado em dias; caso o timeframe corrente estiver em dias, então o período de análise será considerado em meses; ou caso o timeframe corrente estiver em semanas ou meses, então o período de análise será considerado em anos.
FREE
Result per Symbol MT5
Edilson Domingos
5 (5)
Quando se trabalha com vários ativos e tem várias posições abertas em ativos diferentes é um pouco complicado de visualizar quanto de lucro ou prejuízo está em cada ativo, então com esse problema em mente desenvolvi esse indicador onde ele facilita a visualização das operações abertas em cada ativo, onde você poderá abrir vários ativos diferentes e poderá visualizar o resultado individual de cada ativo e agilizar a sua tomada de decisão nos seus trades.
FREE
Os compradores deste produto também adquirem
Atomic Analyst MT5
Issam Kassas
4.22 (9)
Primeiramente, vale ressaltar que este Indicador de Negociação não repinta, não redesenha e não apresenta atrasos, tornando-o ideal tanto para negociação manual quanto automatizada. O Analista Atômico é um Indicador de Ação de Preço PA que utiliza a força e o momentum do preço para encontrar uma vantagem melhor no mercado. Equipado com filtros avançados que ajudam a remover ruídos e sinais falsos, e aumentam o potencial de negociação. Utilizando múltiplas camadas de indicadores complexos, o A
Primeiramente, vale ressaltar que este Sistema de Trading é um Indicador Não Repintado, Não Redesenho e Não Atrasado, o que o torna ideal tanto para o trading manual quanto para o automatizado. O "Sistema de Trading Inteligente MT5" é uma solução completa de trading projetada para traders novos e experientes. Ele combina mais de 10 indicadores premium e apresenta mais de 7 estratégias de trading robustas, tornando-o uma escolha versátil para diversas condições de mercado. Estratégia de Seguime
Quantum Trend Sniper
Bogdan Ion Puscasu
5 (36)
Apresentando       Quantum Trend Sniper Indicator   , o inovador Indicador MQL5 que está transformando a maneira como você identifica e negocia as reversões de tendência! Desenvolvido por uma equipe de traders experientes com experiência comercial de mais de 13 anos,       Indicador de Atirador de Tendência Quântica       foi projetado para impulsionar sua jornada de negociação a novos patamares com sua forma inovadora de identificar reversões de tendência com precisão extremamente alta. ***C
Trend Screener Pro MT5
STE S.S.COMPANY
4.89 (61)
Desbloqueie o poder da negociação de tendências com o indicador Trend Screener: sua solução definitiva de negociação de tendências, alimentada por lógica difusa e sistema de múltiplas moedas! Eleve sua negociação de tendências com o Trend Screener, o revolucionário indicador de tendências alimentado por lógica difusa. É um poderoso indicador de acompanhamento de tendências que combina mais de 13 ferramentas e recursos premium e 3 estratégias de negociação, tornando-o uma escolha versátil para to
Gold Stuff mt5
Vasiliy Strukov
4.88 (162)
Gold Stuff mt5-um indicador de tendência projetado especificamente para o ouro, também pode ser usado em qualquer instrumento financeiro. O indicador não é redesenhado ou atrasado. O timeframe recomendado é H1. Importante! Entre em contato comigo imediatamente após a compra para obter instruções e bônus! PARÂMETRO Draw Arrow-incl.desligado. desenhar setas no gráfico. Alertas-ligado.desligado.alertas sonoros. E-mail notification-incl.desligado. notificações por e-mail. Puch-notification-at
FX Power MT5 NG
Daniel Stein
5 (4)
Receba a sua atualização diária do mercado com detalhes e screenshots através do nosso Morning Briefing aqui no mql5 e no Telegram ! O FX Power MT5 NG é a próxima geração do nosso medidor de força de moeda muito popular de longa data, o FX Power. E o que é que este medidor de força da próxima geração oferece? Tudo o que adorou no FX Power original MAIS Análise de força GOLD/XAU Resultados de cálculo ainda mais precisos Períodos de análise configuráveis individualmente Limite de cálculo personal
Advanced Supply Demand MT5
Bernhard Schweigert
4.53 (15)
Atualmente com 33% de desconto! A melhor solução para qualquer Trader Novato ou especialista! Este indicador é uma ferramenta de negociação exclusiva, de alta qualidade e acessível porque incorporamos uma série de recursos proprietários e uma nova fórmula. Com esta atualização, você poderá mostrar fusos horários duplos. Você não só será capaz de mostrar um TF mais alto, mas também mostrar ambos, o TF do gráfico, MAIS o TF mais alto: MOSTRANDO ZONAS ANINHADAS. Todos os traders de Oferta e Demanda
RelicusRoad Pro MT5
Relicus LLC
4.81 (21)
Agora US $ 147 (aumentando para US $ 499 após algumas atualizações) - Contas ilimitadas (PCs ou Macs) Manual do usuário do RelicusRoad + vídeos de treinamento + acesso ao grupo de discórdia privado + status VIP UMA NOVA FORMA DE OLHAR PARA O MERCADO O RelicusRoad é o indicador de negociação mais poderoso do mundo para forex, futuros, criptomoedas, ações e índices, oferecendo aos traders todas as informações e ferramentas necessárias para se manterem rentáveis. Fornecemos análises técnica
Antes de tudo, vale ressaltar que esta Ferramenta de Negociação é um Indicador Não Repintante, Não Redesenhante e Não Atrasado, o que a torna ideal para negociação profissional. O Indicador de Conceitos de Ação de Preço Inteligente é uma ferramenta muito poderosa tanto para traders novos quanto experientes. Ele combina mais de 20 indicadores úteis em um único, combinando ideias avançadas de negociação como Análise do Trader do Círculo Interno e Estratégias de Negociação de Conceitos de Dinhei
Este é um indicador para MT5 que fornece sinais precisos para entrar em uma negociação sem redesenhar. Ele pode ser aplicado a qualquer ativo financeiro: forex, criptomoedas, metais, ações, índices. Ele fornecerá estimativas bastante precisas e informará quando é melhor abrir e fechar um negócio. Assista o vídeo (6:22) com um exemplo de processamento de apenas um sinal que compensou o indicador! A maioria dos traders melhora seus resultados de negociação durante a primeira semana de negociação c
AW Trend Predictor MT5
AW Trading Software Limited
4.76 (54)
A combinação de níveis de tendência e quebra em um sistema. Um algoritmo de indicador avançado filtra o ruído do mercado, determina a tendência, os pontos de entrada e os possíveis níveis de saída. Os sinais indicadores são registrados em um módulo estatístico, que permite selecionar as ferramentas mais adequadas, mostrando a eficácia do histórico do sinal. O indicador calcula as marcas Take Profit e Stop Loss. Manual e instruções ->   AQUI   / versão MT4 ->   AQUI Como negociar com o indicador
FX Volume MT5
Daniel Stein
4.94 (17)
Receba a sua atualização diária do mercado com detalhes e screenshots através do nosso Morning Briefing aqui no mql5 e no Telegram ! O Volume FX é o PRIMEIRO e ÚNICO indicador de volume que fornece uma visão REAL do sentimento do mercado do ponto de vista de um corretor. Ele fornece uma visão incrível de como os participantes do mercado institucional, como corretores, estão posicionados no mercado Forex, muito mais rápido do que os relatórios COT. Ver essas informações diretamente no seu gráfi
The Volume by Price Indicator for MetaTrader 5 features Volume Profile and Market Profile TPO (Time Price Opportunity). Get valuable insights out of currencies, equities and commodities data. Gain an edge trading financial markets. Volume and TPO histogram bar and line charts. Volume Footprint charts. TPO letter and block marker charts including split structures. Versatile segmentation and compositing methods. Static, dynamic and flexible ranges with relative and/or absolute visualizations. Lay
Apresentando       Quantum Breakout PRO   , o inovador Indicador MQL5 que está transformando a maneira como você negocia Breakout Zones! Desenvolvido por uma equipe de traders experientes com experiência comercial de mais de 13 anos,       Quantum Breakout PRO       foi projetado para impulsionar sua jornada comercial a novos patamares com sua estratégia de zona de fuga inovadora e dinâmica. O Quantum Breakout Indicator lhe dará setas de sinal em zonas de breakout com 5 zonas-alvo de lucro e
ICT, SMC, SMART MONEY CONCEPTS, SMART MONEY, Smart Money Concept, Support and Resistance, Trend Analysis, Price Action, Market Structure, Order Blocks, BOS/CHoCH,   Breaker Blocks ,  Momentum Shift,   Supply&Demand Zone/Order Blocks , Strong Imbalance,   HH/LL/HL/LH,    Fair Value Gap, FVG,  Premium  &   Discount   Zones, Fibonacci Retracement, OTE, Buy Side Liquidity, Sell Side Liquidity, BSL/SSL Taken, Equal Highs & Lows, MTF Dashboard, Multiple Time Frame, BigBar, HTF OB, HTF Market Structure
Auto Order Block with break of structure based on ICT and Smart Money Concepts Futures Break of Structure ( BoS )             Order block ( OB )            Higher time frame Order block / Point of Interest ( POI )    shown on current chart           Fair value Gap ( FVG ) / Imbalance   ,  MTF      ( Multi Time Frame )    Volume Imbalance     ,  MTF          vIMB Gap’s Equal High / Low’s     ,  MTF             EQH / EQL Liquidity               Current Day High / Low           HOD /
TPSpro TRENDPRO  - is a trend indicator that automatically analyzes the market and provides information about the trend and each of its changes, as well as giving signals for entering trades without redrawing! The indicator uses each candle, analyzing them separately. referring to different impulses - up or down impulse. Exact entry points into transactions for currencies, crypto, metals, stocks, indices!  -  Version MT4                  DETAILED DESCRIPTION        /       TRADING SETUPS       
TrendMaestro5
Stefano Frisetti
note: this indicator is for METATRADER4, if you want the version for METATRADER5 this is the link:  https://www.mql5.com/it/market/product/108106 TRENDMAESTRO recognizes a new TREND in the bud, he never makes mistakes. The certainty of identifying a new TREND is priceless. DESCRIPTION TRENDMAESTRO identifies a new TREND in the bud, this indicator examines the volatility, volumes and momentum to identify the moment in which there is an explosion of one or more of these data and therefore the mome
IX Power MT5
Daniel Stein
5 (1)
O   IX Power   traz finalmente a precisão imbatível do FX Power para símbolos não-Forex. Determina com exatidão a intensidade das tendências a curto, médio e longo prazo nos seus índices, acções, mercadorias, ETFs e até criptomoedas favoritos. Pode   analisar tudo o que   o seu terminal tem para oferecer. Experimente e veja como   o seu timing melhora significativamente   quando negoceia. Características principais do IX Power Resultados de cálculo 100% precisos e sem repintura - para tod
Torne-se um Negociador Breaker e lucre com as mudanças na estrutura do mercado à medida que o preço reverte. O indicador de quebra de bloco de pedidos identifica quando uma tendência ou movimento de preço está chegando à exaustão e pronto para reverter. Ele o alerta sobre mudanças na estrutura do mercado, que normalmente ocorrem quando uma reversão ou uma grande retração está prestes a ocorrer. O indicador usa um cálculo proprietário que identifica rupturas e momento do preço. Toda vez que
Quantum Heiken Ashi PRO MT5
Bogdan Ion Puscasu
4.5 (8)
Apresentando o   Quantum Heiken Ashi PRO Projetadas para fornecer informações claras sobre as tendências do mercado, as velas Heiken Ashi são conhecidas por sua capacidade de filtrar o ruído e eliminar sinais falsos. Diga adeus às confusas flutuações de preços e olá para uma representação gráfica mais suave e confiável. O que torna o Quantum Heiken Ashi PRO verdadeiramente único é sua fórmula inovadora, que transforma os dados tradicionais de velas em barras coloridas fáceis de ler. As barras ve
TrendLine PRO MT5
Evgenii Aksenov
4.78 (49)
The Trend Line PRO indicator is an independent trading strategy. It shows the trend change, the entry point to the transaction, as well as automatically calculates three levels of Take Profit and Stop Loss protection Trend Line PRO is perfect for all Meta Trader symbols: currencies, metals, cryptocurrencies, stocks and indices Advantages of Trend Line PRO Never redraws its signals The possibility of using it as an independent strategy It has three automatic levels Take Profit and Stop Loss lev
TrendDecoder Premium MT5
Christophe, Pa Trouillas
5 (1)
Identifica os intervalos e os próximos movimentos prováveis  |  Obter os primeiros sinais e a força das tendências  |  Obter saídas claras antes da reversão | Detetar os níveis Fibo que o preço irá testar   |  Indicador não repintável e não atrasado - ideal para trading manual e automatizado - adequado para todos os activos e todas as unidades de tempo $69   no lançamento - depois volta a >>   $149 Após a compra,   por favor contacte-me neste canal  para obter as definições recomendadas Versão
A key element in trading is zones or levels from which decisions to buy or sell a trading instrument are made. Despite attempts by major players to conceal their presence in the market, they inevitably leave traces. Our task was to learn how to identify these traces and interpret them correctly. Reversal First Impulse levels (RFI)   -  Version MT4                  INSTRUCTIONS                 RUS                 ENG                         R ecommended to use with an indicator   -  TREND PRO  
Was: $249  Now: $99   Market Profile defines a number of day types that can help the trader to determine market behaviour. A key feature is the Value Area, representing the range of price action where 70% of trading took place. Understanding the Value Area can give traders valuable insight into market direction and establish the higher odds trade. It is an excellent addition to any system you may be using. Inspired by Jim Dalton’s book “Mind Over Markets”, this indicator is designed to suit the
Dark Power MT5
Marco Solito
4.84 (56)
Dark Power  is an Indicator for intraday trading. This Indicator is based on   Trend Following  strategy, also adopting the use of an histogram to determine the right power . We can enter in good price with this Indicator, in order to follow the   strong trend   on the current instrument. The histogram is calculated based on the size of the bars and two moving averages calculated on the histogram determine the direction of the signal Key benefits Easily visible take profit/stop loss lines Int
PZ Swing Trading MT5
PZ TRADING SLU
5 (4)
Swing Trading é o primeiro indicador projetado para detectar oscilações na direção da tendência e possíveis oscilações de reversão. Ele usa a abordagem de negociação de linha de base, amplamente descrita na literatura de negociação. O indicador estuda vários vetores de preço e tempo para rastrear a direção da tendência agregada e detecta situações nas quais o mercado está sobrevendido ou sobrecomprado em excesso e pronto para corrigir. [ Guia de instalação | Guia de atualização | Solução de prob
Owl Smart Levels MT5
Sergey Ermolov
4.47 (36)
Versão MT4  |  FAQ O Indicador Owl Smart Levels é um sistema de negociação completo dentro de um indicador que inclui ferramentas populares de análise de mercado, como fractais avançados de Bill Williams , Valable ZigZag que constrói a estrutura de onda correta do mercado e níveis de Fibonacci que marcam os níveis exatos de entrada no mercado e lugares para obter lucros. Descrição detalhada da estratégia Instruções para trabalhar com o indicador Consultor de negociação Owl Helper Chat privado d
Blahtech Supply Demand MT5
Blahtech Limited
4.57 (14)
Was: $299  Now: $99   Supply Demand uses previous price action to identify potential imbalances between buyers and sellers. The key is to identify the better odds zones, not just the untouched ones. Blahtech Supply Demand indicator delivers functionality previously unavailable on any trading platform. This 4-in-1 indicator not only highlights the higher probability zones using a multi-criteria strength engine, but also combines it with multi-timeframe trend analysis, previously confirmed swings
Sweet VWAP Anchored MT5
Francisco Gomes Da Silva
5 (3)
Economize tempo e tome decisões mais certeiras com as VWAPs ancoradas Se você quer testar o poder dessa ferramenta, você pode baixar o indicador gratuito de VWAPs ancoradas para MT5 . Além deste indicador trabalhar de forma independente, ele também é uma extensão para a versão gratuita Sweet VWAP. Isso porque, quando você der um clique na versão gratuita, aquela VWAP que você vê no ponteiro do mouse será fixada. E para melhor entendimento, quem estará fixado lá é este indicador, com todas as fun
Mais do autor
WalkForwardOptimizer MT5
Stanislav Korotky
3.86 (7)
WalkForwardOptimizer library allows you to perform rolling and cluster walk-forward optimization of expert advisers (EA) in MetaTrader 5. To use the library include its header file WalkForwardOptimizer.mqh into your EA source code, add call provided functions as appropriate. Once the library is embedded into EA, you may start optimization according to the procedure described in the User guide . When it's finished, intermediate results are saved into a CSV file and some special global variables.
RenkoFromRealTicks
Stanislav Korotky
4.67 (3)
This non-trading expert utilizes so called custom symbols feature ( available in MQL API as well) to build renko charts based on history of real ticks of selected standard symbol. RenkoFromRealTicks generates custom symbol quotes, thus you may open many charts to apply different EAs and indicators to the renko. It also transmits real ticks to update renko charts in real time. The generated renko chart uses M1 timeframe. It makes no sense to switch the renko chart to a timeframe other than M1. T
VolumeDeltaBars
Stanislav Korotky
This indicator is a conventional analytical tool for tick volumes changes. It calculates tick volumes for buys and sells separately, and their delta on every bar, and displays volumes by price clusters (cells) within a specified bar (usually the latest one). The algorithm used internally is the same as in the indicator VolumeDeltaMT5 , but results are shown as cumulative volume delta bars (candlesticks). Analogous indicator for MetaTrader 4 exists - CumulativeDeltaBars . This is a limited substi
Time And Sales Layout indicator shows traded buy and sell volumes right on the chart. It provides a graphical representation of most important events in the time and sales table. The indicator downloads and processes a history of real trade ticks. Depending from selected depth of history, the process may take quite some time. During history processing the indicator displays a comment with progress percentage. When the history is processed, the indicator starts analyzing ticks in real time. The l
CustomVolumeDelta
Stanislav Korotky
4.5 (2)
This indicator displays volume delta (of either tick volume or real volume) encoded in a custom symbol, generated by special expert advisers, such as RenkoFromRealTicks . MetaTrader does not allow negative values in the volumes, this is why we need to encode deltas in a special way, and then use CustomVolumeDelta indicator to decode and display the deltas. This indicator is applicable only for custom instruments generated in appropriate way (with signed volumes encoded). It makes no sense to ap
FREE
SOMFX1Predictor
Stanislav Korotky
If you like trading by candle patterns and want to reinforce this approach by modern technologies, this indicator and other related tools are for you. In fact, this indicator is a part of a toolbox, that includes a neural network engine implementing Self-Organizing Map (SOM) for candle patterns recognition, prediction, and provides you with an option to explore input and resulting data. The toolbox contains: SOMFX1Builder  - a script for training neural networks; it builds a file with generalize
VolumeDeltaWaves
Stanislav Korotky
5 (1)
This indicator is an extended implementation of Weis waves. It builds Weis waves on absolute volumes (which is the classical approach) or delta of volumes (unique feature) using different methods of wave formation and visualization. It works with real volumes, if available, or with tick volumes otherwise, but also provides an option to use so called "true volume surrogates", as an artificial substitution for missing real volumes (for example, for Forex symbols), which was introduced in correspo
Comparator
Stanislav Korotky
4.14 (7)
This indicator compares the price changes during the specified period for the current symbol and other reference symbol. It allows to analyze the similar movements of highly correlated symbols, such as XAUUSD and XAGUSD, and find their occasional convergences and divergences for trading opportunities. The indicator displays the following buffers: light-green thick line - price changes of the current symbol for TimeGap bars; light-blue thin line - price changes of the reference symbol ( LeadSymbo
FREE
HZZM
Stanislav Korotky
2.67 (3)
This is an adaptive ZigZag based on modification of  HZZ indicator (original source code is available in this article ). Most important changes in this version: two additional indicator buffers added for zigzag evolution monitoring - they show cross signs at points where zigzag direction first changes; zigzag range (H) autodetection on day by day basis; time-dependent adjustment of zigzag range. Parameters: H - zigzag range in points; this parameter is similar to original HZZ, but it can take 0
FREE
This is a demo version of a non-trading expert , which utilizes so called the custom symbols feature ( available in MQL as well ) to build renko charts based on historical quotes of selected standard symbol and to refresh renko in real-time according to new ticks. Also it translates real ticks to the renko charts, which allows other EAs and indicators to trade and analyze renko. Place the EA on a chart of a working instrument. The lesser timeframe of the source chart is, the more precise resulti
FREE
Most of traders use resistance and support levels for trading, and many people draw these levels as lines that go through extremums on a chart. When someone does this manually, he normally does this his own way, and every trader finds different lines as important. How can one be sure that his vision is correct? This indicator helps to solve this problem. It builds a complete set of virtual lines of resistance and support around current price and calculates density function for spatial distributi
ADXS
Stanislav Korotky
5 (3)
Ever wondered why standard ADX is made unsigned and what if it would be kept signed? This indicator gives the answer, which allows you to trade more efficient. This indicator calculates ADX values using standard formulae, but excludes operation of taking the module of ADX values, which is forcedly added into ADX for some reason. In other words, the indicator preserves natural signs of ADX values, which makes it more consistent, easy to use, and gives signals earlier than standard ADX. Strictly s
ADXSignal
Stanislav Korotky
Classical ADX revamped to provide faster and more solid trading signals. This indicator calculates ADX values using standard formulae, but excludes operation of taking the module of ADX values, which is forcedly added into ADX for some reason. In other words, the indicator preserves natural signs of ADX values, which makes it more consistent, easy to use, and gives signals earlier than standard ADX. Strictly speaking, any conversion to an absolute value destroys a part of information, and it mak
Order Book, known also as Market Book, market depth, Level 2, - is a dynamically updated table with current volumes of orders to buy and to sell specific financial instument at price levels near Bid and Ask. MetaTrader 5 provides the means for receiving market book from your broker, but in real time only, without access to its history. This expert adviser OrderBook History Playback allows you to playback the market book events on the history using files, created by OrderBook Recorder . The exper
FREE
WalkForwardDemo MT5
Stanislav Korotky
4 (2)
WalkForwardDemo is an expert adviser (EA) demonstrating how the built-in library WalkForwardOptimizer (WFO) for walk-forward optimization works. It allows you to easily optimize, view and analyze your EA performance and robustness in unknown trading conditions of future. You may find more details about walk-forward optimization in Wikipedia . Once you have performed optimization using WFO, the library generates special global variables (saved in an "archived" file with GVF-extension) and a CSV-f
FREE
PointsVsBars
Stanislav Korotky
This indicator provides a statistical analysis of price changes (in points) versus time delta (in bars). It calculates a matrix of full statistics about price changes during different time periods, and displays either distribution of returns in points for requested bar delta, or distribution of time deltas in bars for requested return. Please, note, that the indicator values are always a number of times corresponding price change vs bar delta occurred in history. Parameters: HistoryDepth - numbe
FREE
ReturnAutoScale
Stanislav Korotky
5 (2)
The indicator calculates running total of linear weighted returns. It transforms rates into integrated and difference-stationary time series with distinctive buy and sell zones. Buy zones are shown in blue, sell zones in red. Parameters: period - number of bars to use for linear weighted calculation; default value - 96; smoothing - period for EMA; default value - 5; mode - an integer value for choosing calculation mode: 0 - long term trading; 1 - medium term trading; 2 - short term trading; defa
FREE
RenkoFromRealTicks DEMO
Stanislav Korotky
1 (1)
This non-trading expert utilizes so called   custom symbols   feature to build renko charts based on history of real ticks of selected standard symbol. RenkoFromRealTicks generates custom symbol quotes, thus you may open many charts to apply different EAs and indicators to the renko. It also transmits real ticks to update renko charts in real time. This is a functionally limited demo version of  RenkoFromRealTicks . RenkoFromRealTicks utility can not work in the tester because it uses CustomSym
FREE
Order Book, known also as Market Book, market depth, Level 2, - is a dynamically updated table with current volumes of orders to buy and to sell specific financial instument at price levels near Bid and Ask. MetaTrader 5 provides the means for receiving market book from your broker in real time. The expert OrderBook Recorder records market book changes and stores them in local files for further usage in indicators and expert adviser, including testing in the tester. The expert stores market book
FREE
SOMFX1Builder
Stanislav Korotky
5 (1)
If you like trading by candle patterns and want to reinforce this approach by modern technologies, this script is for you. In fact, it is a part of a toolbox, that includes a neural network engine implementing Self-Organizing Map (SOM) for candle patterns recognition, prediction, and provides you with an option to explore input and resulting data. The toolbox contains: SOMFX1Builder  - this script for training neural networks; it builds a file with generalized data about most characteristic pric
FREE
Year2Year
Stanislav Korotky
This indicator shows price changes for the same days in past years. D1 timeframe is required. This is a predictor indicator that finds D1 bars for the same days in past 8 years and shows their relative price changes on the current chart. Parameters: LookForward - number of days (bars) to show "future" price changes; default is 5; Offset - number of days (bars) to shift back in history; default is 0; ShowAverage - mode switch; true - show mean value for all 8 years and deviation bounds; false - s
FREE
CyclicPatterns
Stanislav Korotky
This indicator shows price changes for the same days in the past. This is a predictor that finds bars for the same days in past N years, quarters, months, weeks, or days (N is 10 by default) and shows their relative price changes on the current chart. Number of displayed buffers and historical time series for comparison is limited to 10, but indicator can process more past periods if averaging mode is enabled (ShowAverage is true) - just specify required number in the LookBack parameter. Paramet
RenkoCharts
Stanislav Korotky
This non-trading expert utilizes so called custom symbols feature ( available in MQL as well ) to build renko charts based on historical quotes of selected standard symbol and to refresh renko in real-time according to new ticks. Also, it translates real ticks to the renko charts, which allows other EAs and indicators to trade and analyze renko. Place RenkoCharts on a chart of a work instrument. The lesser timeframe of the source chart is, the more precise resulting renko chart is, but the lesse
WalkForwardBuilder MT5
Stanislav Korotky
5 (1)
This script allows performing a walk-forward analysis of trading experts based on the data collected by the WalkForwardLight MT5 library. The script builds a cluster walk forward report and rolling walk forward reports that refine it, in the form of a single HTML page. This script is optional, as the library automatically generates the report immediate after the optimization in the tester is complete. However, the script is convenient because it allows using the same collected data to rebuild th
FREE
OrderBook Utilities is a script, which performs several service operations on order book hob-files, created by OrderBook Recorder . The script processes a file for work symbol of the current chart. The file date is selected by means of the input parameter CustomDate (if it's filled in) or by the point where the script is dropped on the chart. Depending from the operation, useful information is written into the log, and optionally new file is created. The operation is selected by the input parame
FREE
Mirror
Stanislav Korotky
This indicator predicts rate changes based on the chart display principle. It uses the idea that the price fluctuations consist of "action" and "reaction" phases, and the "reaction" is comparable and similar to the "action", so mirroring can be used to predict it. The indicator has three parameters: predict - the number of bars for prediction (24 by default); depth - the number of past bars that will be used as mirror points; for all depth mirroring points an MA is calculated and drawn on the ch
If you like trading crosses (such as AUDJPY, CADJPY, EURCHF, and similar), you should take into account what happens with major currencies (especially, USD and EUR) against the work pair: for example, while trading AUDJPY, important levels from AUDUSD and USDJPY may have an implicit effect. This indicator allows you to view hidden levels, calculated from the major rates. It finds nearest extremums in major quotes for specified history depth, which most likely form resistence or support levels, a
EvoLevels
Stanislav Korotky
The indicator displays most prominent price levels and their changes in history. It dynamically detects regions where price movements form attractors and shows up to 8 of them. The attractors can serve as resistance or support levels and outer bounds for rates. Parameters: WindowSize - number of bars in the sliding window which is used for detection of attractors; default is 100; MaxBar - number of bars to process (for performance optimization); default is 1000; when the indicator is called from
This is an intraday indicator that uses conventional formulae for daily and weekly levels of pivot, resistance and support, but updates them dynamically bar by bar. It answers the question how pivot levels would behave if every bar were considered as the last bar of a day. At every point in time, it takes N latest bars into consideration, where N is either the number of bars in a day (round the clock, i.e. in 24h) or the number of bars in a week - for daily and weekly levels correspondingly. So,
The indicator draws a histogram of important levels for several major currencies attached to the current cross rates. It is intended for using on charts of crosses. It displays a histogram calculated from levels of nearest extremums of related major currencies. For example, hidden levels for AUDJPY can be detected by analyzing extremums of AUD and JPY rates against USD, EUR, GBP, and CHF. All instruments built from these currencies must be available on the client. This is an extended version of
Filtro:
Calogero Vella
391
Calogero Vella 2024.03.28 08:13 
 

Nice indicator, many thanks for that. Unfortunately, the arrows are too close to the bars. You can hardly recognize them. But otherwise quite useful. Thank you

Stanislav Korotky
42927
Resposta do desenvolvedor Stanislav Korotky 2024.03.28 11:26
Please, provide a screenshot how it looks in your environment (and specify its parameters, such as screen size, DPI, and scale in Windows settings) and how you suggest to fix this. You can change the size of the arrows.
Corrado Bruni
403
Corrado Bruni 2023.02.13 19:04 
 

For the Gann Swing Chart finally an indicator done right, thank you.

If there was also the option for the top level on the bullish swing candle and bottom on the bearish swing candle, on a higher tf (selectable), it would be complete.

On the weekly and daily tf I have been using it for about 9 years.

Also having an alarm when the first candle closes above the level.

sancocorecords
24
sancocorecords 2022.12.13 15:32 
 

excelentes mejoras, a mi me gusta mucho el indicador, muchas gracias!!!!

Aleksandr Tamonin
4109
Aleksandr Tamonin 2021.01.23 20:09 
 

Спасибо, очень хороший инструмент!

Responder ao comentário
Versão 1.7 2020.09.24
- Check for symbol synchronization with server is added;
- For Gann swing mode one can specify number of bars with signal confirmations required to switch zigzag direction - just enter the number in RetracementPercent parameter (yes, it's multifunctional now and optionally can be used in 3 of 4 modes); 0 means existing behaviour (direction change upon single bar with lower low (if upward movement was in effect before this moment) or higher high (if downward movement was in effect)), 1 requires one additional bar, which meets the same requirement, 2 requires two, etc ("inside" and "outside" bars are not counted and simply skipped).
Versão 1.6 2020.09.10
Minor improvements and fixes.
Versão 1.5 2020.09.07
Minor bugfixes.
Versão 1.4 2020.09.07
Parameter RetracementPercent is in effect now for the mode Close vs Close (Weis wave).
Versão 1.3 2020.09.06
Publishing fix.
Versão 1.2 2020.09.06
New mode of wave calculation is added, based on retracement size, specified in percent or by auto-adaptive self-adjusting algorithm.
Versão 1.1 2020.09.06
New calculation mode is added, based on retracement size, specified in percent or by auto-adaptive self-adjusting algorithm.