• Visão global
  • Comentários
  • Discussão
  • O que há de novo

Setups 9 Larry Williams

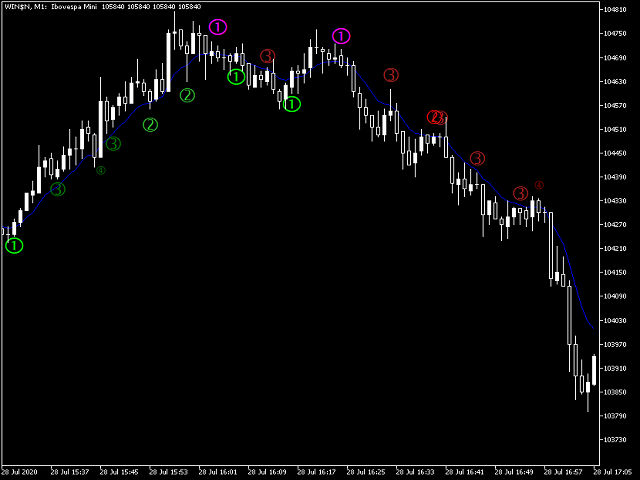
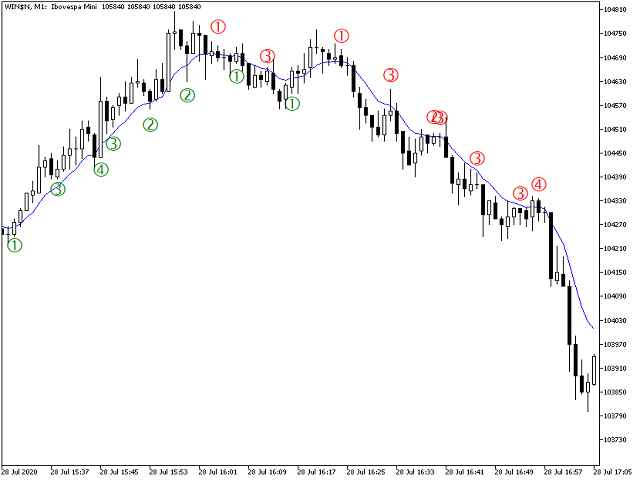
Sinais de compra e venda baseados nas estratégias 9.1, 9.2, 9.3 e 9.4 de Larry Williams, popularizadas no Brasil pelo Palex, para reversões e continuações de tendência.


Para entender a lógica de sinalização e operação de cada setup, por favor acesse:

Avisos: 
- Este indicador aciona muitos sinais. Certifique-se de que entende o que eles significam.
- O sinal é mostrado durante a formação da vela para prepará-lo para uma operação. Mas o sinal é válido somente após o fechamento da vela.
- Quando os Setups 9.2 e 9.3 são válidos juntos, é mostrado apenas o sinal de Setup 9.2. 

Propriedades editáveis conforme sua preferência:
- Quais setups mostrar. Caso queira ocultar algum deles, basta trocar sua cor para Nenhuma (None).
- Distância entre os sinais e a máxima/mínima do candle
- Cor e tamanho dos sinais de compra e venda
- Cor, espessura e estilo da média móvel exponencial
Produtos recomendados
O nível Premium é um indicador único com mais de 80% de precisão nas previsões corretas! Este indicador foi testado pelos melhores Especialistas em Negociação por mais de dois meses! O indicador do autor você não encontrará em nenhum outro lugar! A partir das imagens você pode ver por si mesmo a precisão desta ferramenta! 1 é ótimo para negociar opções binárias com um tempo de expiração de 1 vela. 2 funciona em todos os pares de moedas, ações, commodities, criptomoedas Instruções:
1 100 USD
Noize Absorption Index - is the manual trading system that measures the difference of pressure between bears forces and bulls forces. Green line - is a noize free index that showing curent situation. Zero value of index shows totally choppy/flat market.Values above zero level shows how powerfull bullish wave is and values below zero measures bearish forces.Up arrow appears on bearish market when it's ready to reverse, dn arrow appears on weak bullish market, as a result of reverse expectation.
199 USD
Uma das sequências numéricas é chamada de "Forest Fire Sequence". Foi reconhecida como uma das mais belas novas sequências. Sua principal característica é que essa sequência evita tendências lineares, mesmo as mais curtas. É esta propriedade que formou a base deste indicador. Ao analisar uma série temporal financeira, este indicador tenta rejeitar todas as opções de tendência possíveis. E somente se ele falhar, ele reconhece a presença de uma tendência e dá o sinal apropriado. Esta abordagem pe
30 USD
Gioteen Volatility Index (GVI) - your ultimate solution to overcoming market unpredictability and maximizing trading opportunities. This revolutionary indicator helps you in lowering your losing trades due to choppy market movements. The GVI is designed to measure market volatility, providing you with valuable insights to identify the most favorable trading prospects. Its intuitive interface consists of a dynamic red line representing the volatility index, accompanied by blue line that indicate
100 USD
Indicador único que implementa uma abordagem profissional e quantitativa para significar negociação de reversão. Ele capitaliza o fato de que o preço desvia e retorna à média de maneira previsível e mensurável, o que permite regras claras de entrada e saída que superam amplamente as estratégias de negociação não quantitativas. [ Installation Guide | Update Guide | Troubleshooting | FAQ | All Products ] Sinais de negociação claros Incrivelmente fácil de negociar Cores e tamanhos personalizáveis
249 USD
Was: $249    Now: $149   Market Profile defines a number of day types that can help the trader to determine market behaviour. A key feature is the Value Area, representing the range of price action where 70% of trading took place. Understanding the Value Area can give traders valuable insight into market direction and establish the higher odds trade. It is an excellent addition to any system you may be using. Blahtech Limited presents their Market Profile indicator for the MetaTrader community.
149 USD
Your Trend Friend
Luigi Nunes Labigalini
A tendência é sua amiga! Veja a cor do indicador e faça suas operações nessa direção. Ele não repinta. Ou seja, depois que cada candle se fecha, a cor dele é definitiva e não irá se alterar. Você pode focar em movimentos mais curtos e rápidos ou tendências mais longas, basta testar o que melhor se encaixa no seu operacional de acordo com o ativo e tempo gráfico usado. Altere o parâmetro de entrada "Length" e o indicador irá se adaptar automaticamente (quanto maior ele for, maior a tendência a
99 USD
Indicador para determinar o plano e a tendência. Se o preço estiver abaixo de qualquer um dos dois histogramas e duas linhas (vermelha e azul), esta é uma zona de venda. Ao adquirir esta versão do indicador, versão MT4 para uma conta real e uma demo - como um presente (para receber, escreva-me uma mensagem privada)! Se o preço estiver acima de qualquer um dos dois histogramas e duas linhas (vermelha e azul), esta é uma zona de compra. Versão MT4: https://www.mql5.com/en/market/product/3793 Se
69 USD
PipFinite Exit EDGE MT5
Karlo Wilson Vendiola
4.88 (34)
Did You Have A Profitable Trade But Suddenly Reversed? In a solid strategy, exiting a trade is equally important as entering. Exit EDGE helps maximize your current trade profit and avoid turning winning trades to losers. Never Miss An Exit Signal Again Monitor all pairs and timeframes in just 1 chart www.mql5.com/en/blogs/post/726558 How To Trade You can close your open trades as soon as you receive a signal Close your Buy orders if you receive an Exit Buy Signal. Close your Sell orde
88 USD
The Riko Trend indicator is a revolutionary trend trading and filtering solution with all the important features of a trend tool built into one tool! The Riko Trend indicator is good for any trader, suitable for any trader for both forex and binary options. You don’t need to configure anything, everything is perfected by time and experience, it works great during a flat and in a trend. The Riko Trend indicator is a technical analysis tool for financial markets that reflects the current price
109 USD
This indicator is a zero-lag indicator and displays  strength of trend change . True Trend  Oscillator Pro works best in combination with True Trend Moving Average Pro that displays exact trend as is. Oscillator value is exact price change in given direction of the trend. True Trend Moving Average Pro: https://www.mql5.com/en/market/product/103586 If you set PERIOD input parameter to 1 this indicator becomes a sharpshooter for binary options. Developers can use True Trend Oscillator in E
100 USD
Based on the trading model/strategy/system of gold double-position hedging and arbitrage launched by Goodtrade Brokers, problems encountered in daily operations: 1. Account B immediately places an order immediately following account A. 2: After account A places an order, account B will automatically copy the stop loss and take profit. 3: Account A closes the position of Account B and closes the position at the same time. 4: When account B closes the position, account A also closes the position.
840 USD
HMA Trend Professional MT5
Pavel Zamoshnikov
4.4 (5)
Improved version of the free HMA Trend indicator (for MetaTrader 4) with statistical analysis. HMA Trend is a trend indicator based on the Hull Moving Average (HMA) with two periods. HMA with a slow period identifies the trend, while HMA with a fast period determines the short-term movements and signals in the trend direction. The main differences from the free version: Ability to predict the probability of a trend reversal using analysis of history data. Plotting statistical charts for analyz
30 USD
Pullback Hunter
Anton Polkovnikov
PULLBACK HUNTER What is every trader's cherished dream? To see without delay the places where the reversal will happen. This, of course, is from the category of magic, though... nothing is impossible. But for now I've prepared for you an indicator that marks in real time the end of corrections to the current movement or in short - catches pullbacks.What is the main point? Many people practice rebounds when the price moves in the direction of the open position. And they do them on the formation o
100 USD
Este indicador mostrará os valores de TP e SL (naquela moeda) que você já definiu para todos os pedidos nos gráficos (fechados na linha de transação/pedido) que o ajudarão muito a estimar seus lucros e perdas para cada pedido. E também mostra os valores de PIPs. o formato mostrado é "Valores de moeda de nossos valores de Lucro ou Perda / PIPs". O valor TP será mostrado na cor verde e o valor SL será mostrado na cor vermelha. Para qualquer dúvida ou mais informações, sinta-se à vontade para en
99 USD
Este indicador inovador de medir a força das moedas da INFINITY é um assistente indispensável para cambistas e comerciantes que negociam em longo prazo. O sistema de análise de força / fraqueza das moedas é conhecido há muito tempo e é usado no mercado pelos principais traders do mundo. Qualquer negociação de arbitragem não está completa sem essa análise. Nosso indicador determina facilmente a força das moedas subjacentes em relação umas às outras. Ele exibe gráficos de linhas em todas ou no pa
30 USD
Introducing "X Marks the Spot" – Your Ultimate MetaTrader 5 Indicator for Perfect Trades! Are you tired of the guesswork in trading? Ready to take your MetaTrader 5 experience to a whole new level? Look no further – "X Marks the Spot" is here to revolutionize your trading strategy! What is "X Marks the Spot"? "X Marks the Spot" is not just another indicator – it's your personal trading compass that works seamlessly on all timeframes . Whether you're a beginner or an experienced trader,
65 USD
Magic Finger can help you identify trends and trading opportunities clearly. The finger points to the open position signal, and the discoloration line is confirmed by the trend. If you are a day trader, you can choose to trade during a period of active trading, referring to the discoloration line as the basis for the next order, finger signal as a filter. If you are a trend trader, you can choose a period above H1, wait for the appearance of the finger signal in the key price area, and enter
188 USD
How to use Pair Trading Station Pair Trading Station is recommended for H1 time frame and you can use it for any currency pairs. To generate buy and sell signal, follow few steps below to apply Pair Trading Station to your MetaTrader terminal. When you load Pair Trading Station on your chart, Pair Trading station will assess available historical data in your MetaTrader platforms for each currency pair. On your chart, the amount of historical data available will be displayed for each currency pai
280 USD
here is a link to back test results https://youtu.be/9BYDwS9aaqM https://youtu.be/iLxh43HV91Y However, the difficult task here for traders is to understand and select the indicator or tool that can help them with their trading plan and benefit their trading style. Traders want a tool that requires minimal effort and provides as much support as it can. There are multiple reasons for which traders need an indicator. One such reason is to determine the buy-sell signals in the market. Th
500 USD
This MT5 indicator has been designed to be used on any currency pair and any time frame . It has the scalper and swing trader in mind.  The indicator looks for short-term high-probability reversals in price and will indicate to you to go long (buy) or short (sell) if you see a green or red arrow next to the current candlestick respectively. The indicator provides the best trading opportunities to you during the active trading hours of London and New York, but it will continue to give signals al
199 USD
PipFinite Breakout EDGE MT5
Karlo Wilson Vendiola
4.84 (112)
The Missing Edge You Need To Catch Breakouts Like A Pro. Follow a step-by-step system that detects the most powerful breakouts! Discover market patterns that generate massive rewards based on a proven and tested strategy. Unlock Your Serious Edge Important information here www.mql5.com/en/blogs/post/723208 The Reliable Expert Advisor Version Automate Breakout EDGE signals using "EA Breakout EDGE" Click Here Have access to the game changing strategy that will take your trading to the n
98 USD
Be notified of every color change of Heiken Ashi (HA) candles. The indicator will trigger past and new signals every time that HA candles change their colors. ( Note : this tool is based on the code of Heiken Ashi indicator developed by MetaQuotes Software Corp.) Features The signals are triggered at closing of last bar/opening of a new bar; Any kind of alerts can be enabled: Dialog Box, Email message, SMS notifications for smartphones and tablets, and Sound alerts; By default, up arrows are p
35 USD
PipFinite Trend PRO MT5
Karlo Wilson Vendiola
4.86 (657)
Breakthrough Solution For Trend Trading And Filtering With All Important Features Built Inside One Tool! Trend PRO's smart algorithm detects the trend, filters out market noise and gives entry signals with exit levels. The new features with enhanced rules for statistical calculation improved the overall performance of this indicator. Important Information Revealed Maximize the potential of Trend Pro, please visit www.mql5.com/en/blogs/post/713938 The Powerful Expert Advisor Version Automa
98 USD
The Activator indicator was created to neutralize temporary pauses and rollbacks. It analyzes the price behavior and if there is a temporary weakness in the trend, you can notice it from the indicator readings, as in the case of a pronounced change in trend direction. Entering the market is not difficult, but staying in it is much more difficult. With the Giordano Bruno indicator and its unique trend line, staying in a trend will become much easier! Every rise and fall is reflected in your em
134 USD
PZ Trend Trading MT5
PZ TRADING SLU
3.67 (3)
O Trend Trading é um indicador projetado para lucrar o máximo possível com as tendências que ocorrem no mercado, cronometrando retrocessos e rupturas. Ele encontra oportunidades de negociação analisando o que o preço está fazendo durante as tendências estabelecidas. [ Guia de instalação | Guia de atualização | Solução de problemas | FAQ | Todos os produtos ] Negocie mercados financeiros com confiança e eficiência Lucre com as tendências estabelecidas sem ser chicoteado Reconhecer retrocesso
249 USD
To download MT4 version please click here . This is the exact conversion from TradingView: "WaveTrend [LazyBear]" By "zeusuk3". One of the coolest indicators out there to detect overbought and oversold zones. It can be used as a part of more complicated strategy and for confirming a potential trade setup. There are buffers to use in EAs also. The indicator is loaded light and non-repaint. - You can message in private chat for further changes you need. Thanks for downloading 
40 USD
Waves PRO
Flavio Javier Jarabeck
For those who appreciate Richard Wyckoff approach for reading the markets, we at Minions Labs designed a tool derived - yes, derived, we put our own vision and sauce into this indicator - which we called Waves PRO . This indicator provides a ZigZag controlled by the market volatility (ATR) to build its legs, AND on each ZigZag leg, we present the vital data statistics about it. Simple and objective. This indicator is also derived from the great book called " The Secret Science of Price and Volum
35 USD
A professional tool for trading - the divergence indicator between the WPR and the price, which allows you to receive a signal about a trend reversal in a timely manner or catch price pullback movements (depending on the settings). The indicator settings allow you to adjust the strength of the divergence due to the angle of the WPR peaks and the percentage change in price, which makes it possible to fine-tune the signal strength. The indicator code is optimized and is tested very quickly as par
37 USD
DYJ TRADINGVIEW é um sistema de classificação de vários indicadores, usando as contagens de sinais de classificação e ferramentas de análise para encontrar oportunidades de entrada nos mercados globais DYJ TRADINGVIEW possui 10 indicadores integrados para análise de mercado. A análise baseada em indicadores é usada por muitos traders para ajudá-los a tomar decisões sobre quais negociações realizar e onde entrar e sair delas. Usamos vários tipos diferentes que podem se complementar bem.
150 USD
Os compradores deste produto também adquirem
Robos
Namu Makwembo
5 (2)
Big promotion on the Robos, Get yours now Robos Indicator The   ROBOS   indicator is a multi timeframe oscillator that targets the   overbought   and   oversold  regions of a price chart, a signal is indicated by the two lines crossing, compatible with all tradable instruments Latest Release The latest release is the version 4.0 #What's new in version 4.0 ? Features Extreme oversold and overbought levels ROBOS version  4.0  comes with cool new feature , the ability to target on
255 USD
IVISTscalp5
Vadym Zhukovskyi
5 (1)
Apresentamos a você o indicador iVISTscalp5, que não é apenas único, mas também eficaz em operações de negociação. Este indicador é baseado em dados de tempo e é o resultado de muitos anos de experiência e análise aprofundada dos mercados financeiros. O indicador iVISTscalp5 é uma excelente ferramenta para negociação manual. Conveniência, simplicidade e visualização - toda a complexidade está escondida dentro dele. Simplificamos as configurações e o uso do indicador iVISTscalp5 ao máximo. O indi
500 USD
Este é sem dúvida o indicador de reconhecimento automático de formação de preço harmônico mais completo que você pode encontrar para a MetaTrader Platform. Ele detecta 19 padrões diferentes, leva as projeções de Fibonacci tão a sério quanto você, exibe a Zona de Reversão Potencial (PRZ) e encontra níveis adequados de stop loss e take-profit. [ Guia de instalação | Guia de atualização | Solução de problemas | FAQ | Todos os produtos ] Detecta 19 formações harmônicas de preços diferentes Tr
299 USD
The Volume by Price Indicator for MetaTrader 5 features Volume Profile and Market Profile TPO (Time Price Opportunity). Get valuable insights out of currencies, equities and commodities data. Gain an edge trading financial markets. Volume and TPO histogram bar, line and metric charts. TPO letter and block marker charts including split structures. Positioning and styling options to suit the user's needs and context. Volume Profile and Market Profile TPO Point of Control (VPOC and TPOC), Imbalanc
259 USD
Introduction to X3 Chart Pattern Scanner X3 Cherart Pattern Scanner is the non-repainting and non-lagging indicator detecting X3 chart patterns including Harmonic pattern, Elliott Wave pattern, X3 patterns, and Japanese Candlestick patterns. Historical patterns match with signal patterns. Hence, you can readily develop the solid trading strategy in your chart. More importantly, this superb pattern scanner can detect the optimal pattern of its kind. In addition, you can switch on and off individu
250 USD
Difícil de encontrar e com pouca frequência, as divergências são um dos cenários de negociação mais confiáveis. Este indicador localiza e verifica automaticamente divergências ocultas e regulares usando seu oscilador favorito. [ Guia de instalação | Guia de atualização | Solução de problemas | FAQ | Todos os produtos ] Fácil de trocar Encontra divergências regulares e ocultas Suporta muitos osciladores conhecidos Implementa sinais de negociação baseados em fugas Exibe níveis adequados de
249 USD
Offer 249 down from 350 for the next 1 copies. then back to 350 $ Are you tired of using outdated indicators that leave you guessing where to set your profit targets? Look no further than the AK CAP Opening Range Breakout Indicator. This powerful tool is backed by a US patent and has already helped countless traders pass funded challenges like FTMO. We use it daily on our prop traders and internal funds, and now it's available to you as well. The calculation behind the indicator is incredibly
249 USD
VTrende Pro
Andrii Diachenko
VTrende Pro - MTF indicator for trend trading with a display panel for MT5 *** Videos can be translated into any language using subtitles (video language - Russian) Although the signals of the VTrende Pro indicator can be used as signals of a full-fledged trading system, it is recommended to use them in conjunction with the Bill Williams TS. VTrende Pro is an extended version of the VTrende indicator. Difference between Pro version and VTrende: - Time zones - Signal V - signal 1-2 waves
697 USD
Apresentamos o revolucionário indicador MT5, Traffic Signal - seu portal definitivo para o mundo do trading bem-sucedido! Projetado com precisão e expertise, o Traffic Signal opera com uma estratégia especial que aproveita o poder de indicadores técnicos avançados - RSI, Stochastics, CCI e Tendências - em todos os intervalos de tempo. Prepare-se para uma experiência de trading extraordinária, pois este indicador de última geração oferece os sinais mais precisos para entrada, permitindo que você
450 USD
Weis Wave with Alert MT5
Trade The Volume Waves Single Member P.C.
4.93 (14)
Get 30% Discount until 30/9/20203 on Lifetime package 420$ from 599$. Rental/Lifetime Package Options and Privileges  * For optimum results the yearly or lifetime package is suggested due to live training and Discord  channel trading with the  creator! Rent Monthly Six Months   Yearly/Lifetime Weis Wave with Speed with Alert+Speed Index x x x Manual  x x x Quick Set up Video x x x Blog x x x Lifetime Updates x x x Setup and Training Material x x Free Rectangle Break Alert Tool      x Discord
420 USD
Introduction Excessive Momentum Indicator is the momentum indicator to measure the excessive momentum directly from raw price series. Hence, this is an extended price action and pattern trading. Excessive Momentum Indicator was originally developed by Young Ho Seo. This indicator demonstrates the concept of Equilibrium Fractal Wave and Practical Application at the same time. Excessive Momentum detects the market anomaly. Excessive momentum will give us a lot of clue about potential reversal and
200 USD
"Piranha" - an autonomous trading system that determines overbought and oversold levels on the chart. Red and blue zones represent overbought and oversold levels respectively. Entry points are marked with arrows: a downward arrow in the red zone for "sell" and an upward arrow in the blue zone for "buy". The Take profit level is indicated by the green moving average. Key features: Adjusting the Take profit level as the green moving average changes position. Averaging ability when a new market e
300 USD
Elliott Wave Trend was designed for the scientific wave counting. This tool focuses to get rid of the vagueness of the classic Elliott Wave Counting using the guideline from the template and pattern approach. In doing so, firstly Elliott Wave Trend offers the template for your wave counting. Secondly, it offers Wave Structural Score to assist to identify accurate wave formation. It offers both impulse wave Structural Score and corrective wave Structure Score. Structural Score is the rating to sh
200 USD
Description Very precise patterns to detect: entry signals as well as breakout, support and resistance reversal patterns. It points out zones in which, with a high probability, institutional orders with the potential to change the price’s direction and keep moving towards it, have been placed. Support:   We create great tools for the entire trading community. Most of them are free. If you believe in what we do  Support Us Here.   KEY LINKS:   Indicator Manual  -  All Products  How is this ind
280 USD
O Canal de Regressão LT é um sofisticado indicador técnico que incorpora princípios da análise de Fibonacci, análise de envelopes e extrapolação de Fourier. O indicador de envelopes é essencial para avaliar a volatilidade do mercado, enquanto a aplicação da análise de Fibonacci aprimora a precisão na identificação de níveis de sobrecompra e sobrevenda. Além disso, o componente de extrapolação de Fourier desempenha um papel crucial na previsão dos movimentos futuros do mercado, levando em cons
200 USD
PZ Day Trading MT5
PZ TRADING SLU
2.6 (5)
Este indicador detecta reversões de preços em zigue-zague, usando apenas análise de ação de preços e um canal donchiano. Ele foi projetado especificamente para negociações de curto prazo, sem repintar ou retroceder. É uma ferramenta fantástica para traders astutos, com o objetivo de aumentar o tempo de suas operações. [ Guia de instalação | Guia de atualização | Solução de problemas | FAQ | Todos os produtos ] Surpreendentemente fácil de negociar Fornece valor em cada período de tempo Imple
249 USD
The indicator is recommended to be used on D1. This version, unlike the version for MT4, does not have an additional filter. Peculiarities Suitable for all tools Many strategies; Important levels, recommendations; Flexibility in settings for different instruments and intervals. Signals B,S - predict the direction of movement of the candle at the beginning or at the close of the candle. Recommended TF from H4 and above. BuyStopLvl, SellStopLvl - levels that can be used to set Limit, Stop order
200 USD
Matreshka
Dimitr Trifonov
5 (1)
Matreshka self-testing and self-optimizing indicator: 1. Is an interpretation of the Elliott Wave Analysis Theory. 2. Based on the principle of the indicator type ZigZag, and the waves are based on the principle of interpretation of the theory of DeMark. 3. Filters waves in length and height. 4. Draws up to six levels of ZigZag at the same time, tracking waves of different orders. 5. Marks Pulsed and Recoil Waves. 6. Draws arrows to open positions 7. Draws three channels. 8. Notes support and re
245 USD
INTRODUCING WORLD'S FIRST MT5 "AUTO SCALE" Naveen Geometric Square with Circle To Analyze Markets Geometric Relationship. Naveen's Geometric Square  has some of the most impressive features you will ever find in Gann & Geometric Analysis world. The Naveen's Geometric Square  is a Powerful method of squaring TIME AND PRICE .It is a free-hand drawing tool giving you control of the size of the box. The internal diagonals, grid-lines and angles can be Enabled/ Disabled. All square diagonals lik
1 299 USD
Please send me Direct message on MQL5 CHAT after purchasing the Indicator for Training and Installation Support There are some additional files that is important to use with the Indicator . So be sure to contact me after purchasing the Indicator So that I can add you for training and support . If you find any difficulty with installation then send me Direct message here So that I can connect with you via Anydesk or Teamview for the product installation. " Smart Order Block Indicator " to find
249 USD
PZ Swing Trading MT5
PZ TRADING SLU
5 (4)
Swing Trading é o primeiro indicador projetado para detectar oscilações na direção da tendência e possíveis oscilações de reversão. Ele usa a abordagem de negociação de linha de base, amplamente descrita na literatura de negociação. O indicador estuda vários vetores de preço e tempo para rastrear a direção da tendência agregada e detecta situações nas quais o mercado está sobrevendido ou sobrecomprado em excesso e pronto para corrigir. [ Guia de instalação | Guia de atualização | Solução de prob
249 USD
[ MT4 Version ]  [ Order Blocks ]  [ Kill Zones ]  [ SMT Divergences ] ICT Breakers Multi TF The ICT Breakers Multi TF indicator is currently the most accurate and customizable indicator in the market. It has been designed to give you a strategic edge  for trades based on Breaker Blocks and Smart MT. Please note that the UI in the strategy tester may be laggy. However, we assure you that this is only a testing environment issue and that the indicator works perfectly in the real product. The I
224 USD
Multi-currency, multi-timeframe, harmonic pattern indicator AB = CD. Supports sending push notifications about signals to a mobile device, messages on e-mail, as well as messages using alerts on all available currency pairs and timeframes. This indicator was based on the indicator Harmonic ABCD Universal. Version for MetaTrader 5:  https://www.mql5.com/en/market/product/44972 . See also: Harmonic ABCD Universal for MetaTrader 4 . Using modern software development methods has made the indicator a
230 USD
[ MT4 Version ] Order Block Indicator MT5 Order Block Indicator MT5 is currently the most accurate and customizable indicator in the market. It has been developed to facilitate the analysis of operations based on Order Blocks and Supply and Demand Zones. These zones are possible reversal points of a movement. Order Blocks indicate a possible accumulation of orders in one area. The price usually gets to reach and react strongly to those areas. The most relevant levels for this reaction are the c
224 USD
Incinerat8
Paulos Ngwenya
This algorithm uses real time data to generate signals with an accuracy rate of 80%. It shows entries and where you should place both the stoploss and the take profit for each trade. It determines trend! It can even help you to become a signal provider! And it can generate up to 8 signals a day! You get access to a free forex trading community  Operates on any broker compatible to synthetic indices and forex   if you need any assistance whatsapp +2774 35 35 744 or telegram link @pipsempire01
400 USD
Volume Confluence
Mussadiq Abdul Rahim
Atenção! Antes de utilizar nosso produto, é importante ler atentamente o aviso legal em inglês. Nosso produto é projetado para fornecer informações sobre possíveis tendências do mercado e movimentos de preços. No entanto, não podemos garantir a obtenção de lucros ou resultados específicos na negociação. A negociação nos mercados financeiros envolve riscos, e não nos responsabilizamos por possíveis perdas. Todas as informações adicionais podem ser encontradas no aviso legal em inglês.
1 000 USD
EQ Cutrim Theory
Marco Aurelio Santos Costa
O Ronal Cutrim há 14 anos é um matemático dedicado e com mais de 10 anos de experiência no mercado financeiro. O conceito da teoria é simples, encontrar desequilíbrio entre compradores e vendedores. O que faz muito sentido, pois nada sobe para sempre, nada cai para sempre. Quando você encontra um ativo com probabilidade matemática de equilíbrio desequilibrado, é uma otima forma de entrar no trading, TUTORIAL  veja o video com atenção
799 USD
Institutional Order Block
Agustinus Biotamalo Lumbantoruan
This indicator doesn't repaint & shows several things 1) Order Block 2) Imbalance candle stick (the icon is a vertical rectangle) 3) Swings (zigzag), 3 to be exact (minor, major and external major zigzags). If you know market structure, you should understand internal & external trends. Minor & major are internal trends of external major in this indicator. 4) Supply & Demand (arrow icon) 5) Major supply & demand (purple arrow) 6) Range/Bias lines (only shown in time frame 1hour & lower) 7) Previo
200 USD
Seconds Charts
Aleksandr Goryachev
Micro  ******************* Секундные графики MT5 ********************** Более точного инструмента для входа в сделку вы не найдёте. Входные параметры: Timeframe, sek - период построения графика, секунды Displayed bars - отображаемые бары Step of price levels, pp, 0-off - шаг отрисовки ценовых уровней, пункты Scale points per bar, 0-off - масштаб в пунктах на бар Show lines - отображение текущих уровней Show comment - отображение комментария Standard color scheme - стандартная цветовая сх
1 500 USD
Introduction to EFW Analytics EFW Analytics was designed to accomplish the statement "We trade because there are regularities in the financial market". EFW Analytics is a set of tools designed to maximize your trading performance by capturing the repeating fractal geometry, known as the fifth regularity in the financial market. The functionality of EFW Analytics consists of three parts. Firstly, Equilibrium Fractal Wave Index is an exploratory tool to support your trading logic to choose which r
200 USD
Mais do autor
Setup da Onda
Luigi Nunes Labigalini
Sinais de compra e venda baseados na estratégia do Setup da Onda, popularizada no Brasil pelo Palex, para entradas em correções pós-reversão. Como o indicador funciona? O indicador ativa o sinal de compra ou venda quando suas respectivas condições são atendidas.  Para uma tendência de alta, precisamos de uma reversão para alta na MME9 seguida por preços acima da MM21 ascendente realizando uma correção e toque nela.  Para uma tendência de baixa, precisamos de uma reversão para baixa na MME9 se
10 USD
Your Trend Friend
Luigi Nunes Labigalini
A tendência é sua amiga! Veja a cor do indicador e faça suas operações nessa direção. Ele não repinta. Ou seja, depois que cada candle se fecha, a cor dele é definitiva e não irá se alterar. Você pode focar em movimentos mais curtos e rápidos ou tendências mais longas, basta testar o que melhor se encaixa no seu operacional de acordo com o ativo e tempo gráfico usado. Altere o parâmetro de entrada "Length" e o indicador irá se adaptar automaticamente (quanto maior ele for, maior a tendência a
99 USD
Trap Zone
Luigi Nunes Labigalini
4.5 (2)
Este indicador serve como alerta para regiões de clímax. Como funciona? Quando a média móvel aritmética de 20 períodos vai de encontro à média móvel aritmética de 200 períodos, forma-se uma região de conflito com duas grandes forças opostas brigando.  Isso faz com que o preço apresente repiques aleatórios até que se defina um lado vencedor, o que pode ser perigoso. Portanto, o indicador pinta a região entre as médias móveis para alertá-lo. Como usar? Pode ser usada para estratégias específi
FREE
Setup 91 Larry Williams
Luigi Nunes Labigalini
4.5 (2)
Sinais de compra e venda baseados no Setup 9.1 de Larry Williams, popularizada no Brasil pelo Palex, para reversões de tendência. Como funciona? O indicador ativa o sinal de compra ou venda quando acontece um fechamento de candle virando a média móvel exponencial (MME) de 9 períodos. Como usar? Uma maneira de usá-lo, proposta por Larry Williams, é entrar no trade com uma ordem stop um tick acima da máxima do candle com sinal de compra, colocando a ordem de stop loss um tick abaixo da mí
99 USD
Setup 92 Larry Williams
Luigi Nunes Labigalini
Sinais de compra e venda baseados no Setup 9.2 de Larry Williams, popularizado no Brasil pelo Palex, para continuação de tendência. Como funciona? O indicador ativa o sinal de compra quando um candle fecha abaixo da mínima anterior se a média móvel exponencial (MME) de 9 períodos estiver subindo. O indicador ativa o sinal de venda quando um candle fecha acima da máxima anterior se a MME9 estiver caindo. Como usar? Uma maneira de usá-lo, proposta por Larry Williams, é entrar no trade com
99 USD
Setup 93 Larry Williams
Luigi Nunes Labigalini
Sinais de compra e venda baseados no Setup 9.3 de Larry Williams, popularizado no Brasil pelo Palex, para continuação de tendência. Como funciona? O indicador ativa o sinal de compra quando dois candles fecham abaixo do fechamento referência e a média móvel exponencial (MME) de 9 períodos está subindo. O indicador ativa o sinal de venda quando dois candles fecham acima do fechamento referência e a MME9 está caindo. Como usar? Uma maneira de usá-lo, proposta por Larry Williams, é entrar no
99 USD
Setup 94 Larry Williams
Luigi Nunes Labigalini
Sinais de compra e venda baseados no Setup 9.4 de Larry Williams, popularizado no Brasil pelo Palex, para falhas de reversão e continuação de tendência. Como funciona? Para uma tendência de alta, o indicador sinaliza a compra quando temos um candle virando a MME9 para baixo e fechando abaixo dela, seguido de um candle virando ela para cima e fechando acima dela, com uma mínima mais alta que a mínima do candle anterior.  Para uma tendência de baixa, o indicador sinaliza a venda quando temos um
99 USD
Setup PC
Luigi Nunes Labigalini
Sinais de compra e venda baseados no Setup Ponto Contínuo (PC), popularizado no Brasil por Stormer e Palex, para continuação de tendência. Como funciona? O indicador ativa o sinal de compra quando temos preços acima da Média Móvel Aritmética de 21 períodos (MM21) ascendente seguidos por uma correção e toque nela. O indicador ativa o sinal de venda quando temos preços abaixo da MM21 descendente seguidos por uma correção e toque nela. Como usar? Uma maneira de usá-lo, proposta por Storm
99 USD
Joe DiNapoli
Luigi Nunes Labigalini
Sinais de compra e venda baseados no Setup Joe DiNapoli com a média móvel exponencial de 3 períodos deslocada em 3 períodos, para reversões de tendência. Quem é ele? Joe DiNapoli é um trader profissional e autor de livros, envolvido no mercado financeiro a mais de 38 anos. Ele é um Conselheiro de Commodities Trading registrado (C.T.A.) por mais de 15 anos e ensinou suas técnicas em grandes capitais financeiras da Europa, Ásia, África do Sul, Oriente Médio, Russia e Estados Unidos. Como o in
19.90 USD
HiLo Points
Luigi Nunes Labigalini
Esse indicador é baseado nas médias móveis das máximas e mínimas, para identificação de tendências e/ou condução de stop loss. Como o indicador funciona? O indicador plota os pontos de tendência de alta até que haja um fechamento abaixo da média móvel das mínimas. Quando isso acontece, inicia-se uma tendência de baixa e os pontos são plotados até que haja um fechamento acima da média móvel das máximas. Quando isso acontece, outra tendência de alta se inicia. E assim vai. Como usar o indicad
99 USD
Setup DT Trap
Luigi Nunes Labigalini
Sinais de compra e venda baseados no Setup Armadilha Day Trade (DT TRAP), popularizado no Brasil por Alexandre Wolwacz (STORMER), para falhas de rompimento. Como o indicador funciona? O indicador ativa o sinal de compra ou venda quando suas respectivas condições são atendidas.  Para uma compra, é preciso que o candle faça uma mínima menor que a mínima do dia anterior. Neste momento, será plotado o sinal com a cor secundária. Para uma venda, é preciso que o candle faça uma máxima maior que a m
99 USD
Setup PFR
Luigi Nunes Labigalini
Sinais de compra e venda baseados no Setup Preço de Fechamento de Reversão (PFR), criado por Stormer para operações em continuação de tendência. Como funciona? O indicador ativa o sinal de compra quando temos uma mínima menor que as duas mínimas anteriores e o fechamento maior que o fechamento anterior. O indicador ativa o sinal de venda quando temos uma máxima maior que as duas máximas anteriores e o fechamento menor que o fechamento anterior. Como usar? Uma maneira de usá-lo, propos
99 USD
Setup Double 7s
Luigi Nunes Labigalini
Sinais de entrada e saída da Estratégia Duplo 7 de Larry Connors em seu livro "Estratégias Operacionais de Curto Prazo Que Funcionam". Larry alega que esta estratégia previu a direção do mercado mais de 80% do tempo desde 1995. Lucrando sem se expor ao mercado em mais de 25% do tempo. Ótima para swing trade em gráfico diário do SPY, Nasdaq, FXI da China, EWZ do Brasil (IBOV dolarizado) e a maioria dos ETFs e índices do mundo. Como o indicador funciona? O indicador plota o sinal de compra qu
99 USD
Filtro:
Sem comentários
Responder ao comentário
Versão 1.1 2020.08.07
Fixed errors that erased previous valid setups.