• Visão global
  • Comentários (1)
  • Discussão (19)
  • O que há de novo

Modified Awesome Oscillator

5

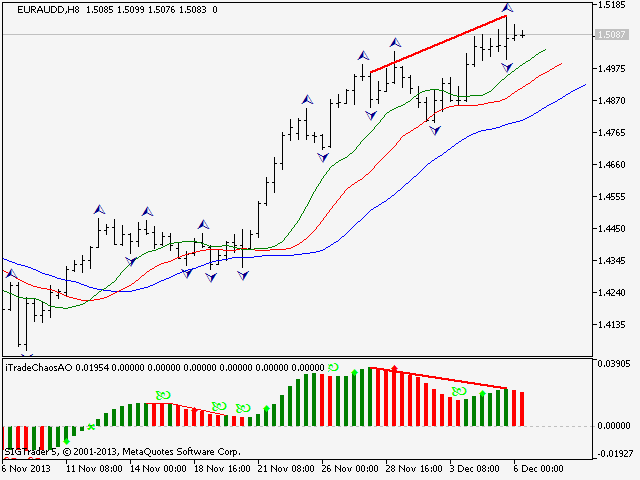
O principal objetivo do indicador é detectar e marcar sinais de negociação no histograma do Awesome Oscillator de acordo com as estratégias de "Trading Chaos, second edition" e "New Trading Dimensions".

O indicador detecta e marca os seguintes sinais de negociação:

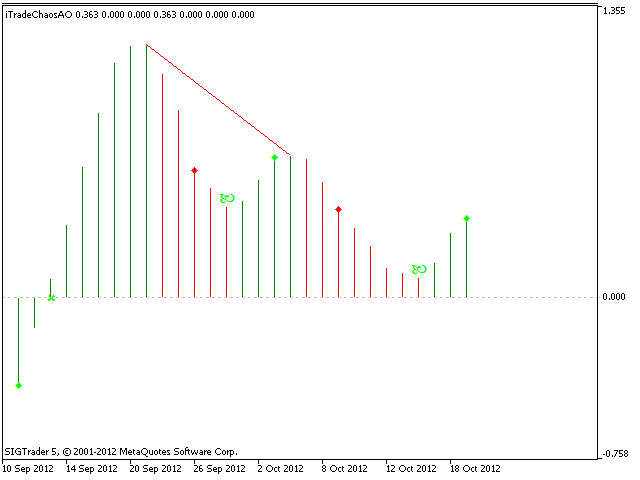
  1. "Two peaks" (dois topos) - divergência.
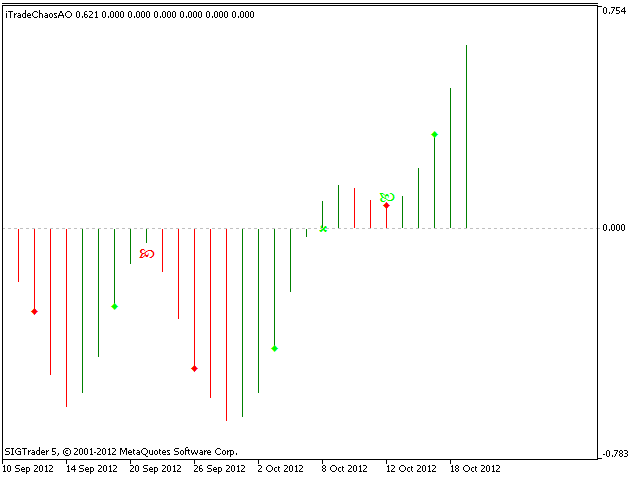
  2. O sinal do "Second wise-man" (Segundo homem sábio) - terceiro barra consequente do indicador Awesome Oscillator após a sua cor ter sido alterada.
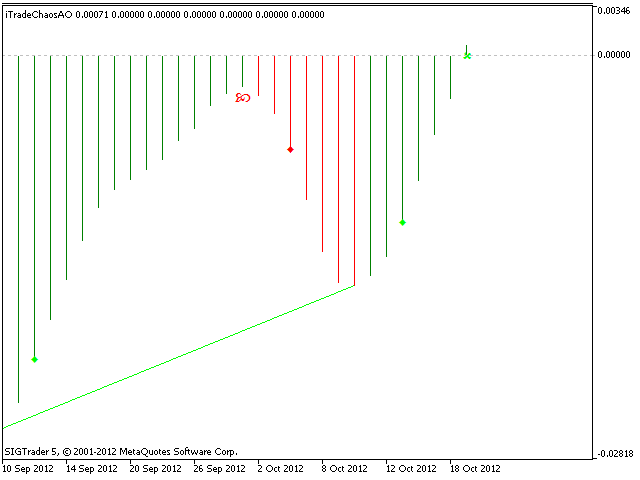
  3. O histograma cruza a linha zero.
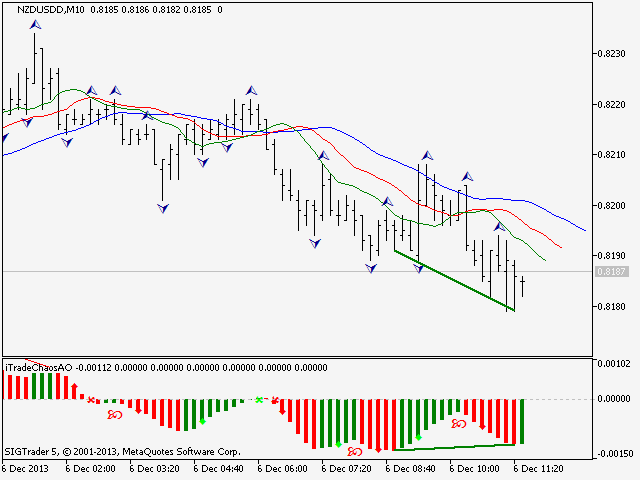
  4. O sinal "Saucer".

O indicador inclui um bloco de sinal que informa ao trader sobre novos sinais de forma prática.

É uma parte integral da complexa negociação baseada na estratégia "Trading Chaos". O indicador é parte de um padrão. Recomenda-se usar o indicador juntamente com os seguintes produtos:

Comentários 1
PROFITFACTOR1
106
PROFITFACTOR1 2021.06.29 21:54 
 

Удобный индикатор в дополнение панели

Produtos recomendados
The standard Bollinger Bands indicator has been improved by integrating additional indications from the Standard Deviation indicator (StdDev), which gives an additional filter for confirming trading signals. In addition, the color of the indicator's lines shows the beginning of a trend, its development and exhaustion. This indicator has a signal block that notifies the trader of the beginning of the trend on any time frame to which it is attached. Settings Type of messages - select the type of
30 USD
Order Book, known also as Market Book, market depth, Level 2, - is a dynamically updated table with current volumes of orders to buy and to sell specific financial instument at price levels near Bid and Ask. MetaTrader 5 provides the means for receiving market book from your broker, but in real time only, without access to its history. The indicator OrderBook Cumulative Indicator accumulates market book data online and visualizes them on the chart. In addition, the indicator can show the market
49 USD
RFOC Wedge and VWAP
Ronaldo Franco De Oliveira Cardoso
O RFOC Wedge VWAP indicador foi criado com o objetivo de auxiliar os trades à localizar possíveis alvos, conforme a data e hora de referência sinalizada pelo usuário, considerando a oscilação do preço.  O Incador apresenta 4 opções de seleção, diretamente no gráfico, sem a necessidade de ficar abrindo as configurações do indicador. As opções são: Cunha/Triangulo O usuário seleciona no gráfico a data e hora para que o incidor crie os alvos da fugura gráfica. Adicionalmente o usuário pode hab
35.99 USD
This indicator displays buy or sell signals according to Bill Williams' definition of the Trading Zone. [ Installation Guide | Update Guide | Troubleshooting | FAQ | All Products ] Easy to use and understand Avoid trading flat markets Deterministic indicator with clear rules The indicator is non-repainting It implements alerts of all kinds It has straightforward trading implications. A blue arrow is a buy signal A red arrow is a sell signal According to Bill Williams trading in the zone helps t
FREE
Range Target
Ignacio Agustin Mene Franco
Range Target! indicator that marks the depletion of strength of the candle where it touches the floor and catches a trend, whether it is up or down The indicator has two support lines where it marks the floor and the ceiling. where on the same line marks the entry for rise or fall, the lines have Gold and Blue colors the gold line shows the purchase the blue line shows the sale works for any season works for forex markets works for synthetic index markets! Good Profit, World Investor.
50 USD
Pattern DejaVu
Andriy Konovalov
1 (1)
This indicator predicts the nearest bars of the chart based on the search of up to three best coincided patterns (a sequence of bars of a given length) in the history of the current instrument of the current timeframe. The found patterns are aligned with the current pattern at the   opening price   of the current (last) bar. The predicted bars are bars following immediately for patterns found in history. Pattern search is performed once every time a new bar of the current timeframe opens. The i
30 USD
Just another   Auto Fibonacci Retracement indicator . However, this is the most   Flexible   &   Reliable   one you can find for FREE. If you use this indicator and you like it, please leave a review/comment. If you are looking for a more advanced Fibo indicator, check this Free  Trend-Based Fibo indicator . ### FEATURES ### Auto-calculate up to 7 Fibonacci levels on your customized frame. Adjust levels as your need. Use High/Low price or  Open/Close price to calculate. Freeze the levels and don
FREE
Italo Trend Indicator MT5
Italo Santana Gomes
4.75 (4)
BUY INDICATOR AND GET EA FOR FREE AS A BONUS + SOME OTHER GIFTS! ITALO TREND INDICATOR  is the best trend indicator on the market, the Indicator works on all time-frames and assets, indicator built after 6 years of experience on forex and many other markets. You know many trend indicators around the internet are not complete, does not help, and it's difficult to trade, but the Italo Trend Indicator is different , the Italo Trend Indicator shows the signal to buy or sell, to confirm the signal t
65 USD
Short term extremum
Gennadiy Stanilevych
5 (1)
The indicator determines and marks the short-term lows and highs of the market on the chart according to Larry Williams` book "Long-term secrets to short-term trading". "Any time there is a daily low with higher lows on both sides of it, that low will be a short-term low. We know this because a study of market action will show that prices descended in the low day, then failed to make a new low, and thus turned up, marking that ultimate low as a short-term point. A short-term market high is just
30 USD
This plots  Fibonacci deviation levels above and below a moving average of the price. Companion indicator to the " Golden Bull Wave Trader "  expert advisor which uses volume\price trend to determine price reversals. https://www.mql5.com/en/market/product/56291 The expert advisor and this indicator were created in order to: Identify ideal and repeatable trade entries with high level of certainty Create a day trading strategy which doesn’t require a hard SL and TP Use alternate risk management me
30 USD
Ichimoku Kinko Hyo é um sistema de gráficos de negociação de tendência que tem sido utilizado com sucesso em quase todos os mercados negociáveis. Ele é único em muitos aspectos, mas seu principal ponto forte é o uso de vários pontos de dados para dar ao trader uma visão mais abrangente e mais profunda no price action. Este ponto de vista mais profundo, e o fato de que Ichimoku é um sistema muito visual, permite que o comerciante possa discernir e filtra rapidamente "num piscar de olhos" as confi
30 USD
You can avoid constant monitoring of computer screen waiting for the DeMarker signal while receiving push notifications to a mobile terminal or a sound alert on the screen about all required events, by using this indicator - DeMarker Alerts. In fact, it is the replacement of the standard indicator with which you will never miss the oscillator signals. If you don't know the benefits of DeMarker or how to use it, please read here . If you need signals of a more popular RSI indicator, use RSI Alert
30 USD
This indicators automatically draws the   support and resistances   levels (key levels) for you once you've dropped it on a chart. It reduces the hustle of drawing and redrawing these levels every time you analyse prices on a chart. With it, all you have to do is drop it on a chart, adjust the settings to your liking and let the indicator do the rest. But wait, it gets better; the indicator is absolutely free! For more information:  https://youtu.be/rTxbPOBu3nY For more free stuff visit:  https
FREE
Секвента Демарка (Sequential) - индикатор, демонстрирующий развитие тренда, его структуру. Довольно точно отображает начальную и конечную точки, важные точки перелома. Срабатывает по открытию свечи, поэтому перерисовок не будет никогда. Здесь нет сложных формул, только статистика, отсчёт свечей, выбранных по определённым критериям. При этом индикатор может давать очень точные сигналы для входа, особенно при поддержке какого-нибудь индикатора уровней, например, этого . Алгоритм нахождения сигнал
50 USD
The   OHLC indicator   shows the current and historical values of High, Low, Open, Close and Mid for a specific time period. It can plot the current values or the values from the previous session. The indicator's range can be calculated from a daily, weekly, monthly, or user-specified session. Levels High  of the current or previous session. Low  of the current or previous session. Open  of current or previous session. Close  of the current or previous session. Midpoint  of the current or pre
FREE
TransitBlueOcean
Bonginkosi Innocent Khumalo
5 (1)
TransitBlueOcean is indicator system that uses ocean wave's pattern, to help one to know when to buy and when to sell. The indicator system is very powerful like the ocean waves.   How to use: Zoom in so that the Ocean will appear on your chart. Buy when you see the candles, the candle will be above the ocean wave (buying signal). Sell when you can't see the candles, the candles will be inside the wave (selling signal) . A notification based on both buying or selling will be given to alert y
95 USD
KDJ Index 4   交易实用必备工具指标 波浪自动计算指标,通道趋势交易 完美的趋势-波浪自动计算通道计算 , MT4版本 完美的趋势-波浪自动计算通道计算 , MT5版本 本地跟单复制交易 Easy And Fast Copy , MT4版本 Easy And Fast Copy , MT5版本 本地跟单复制交易 模拟试用 Easy And Fast Copy , MT4 模拟账号运行 Easy And Fast Copy , MT5 模拟账号运行 "Cooperative QQ:556024  "  "Cooperation wechat:556024"  "Cooperative email:556024@qq.com" 强烈推荐趋势指标, 波浪的标准自动计算   和   波浪的标准自动计算MT5版本     KDJ指标又叫 随机指标 ,是一种相当新颖、实用的技术分析指标,它起先用于期货市场的分析,后被广泛用于股市的中短期趋势分析,是期货和股票市场上最常用的技术分析工具。 随机指标KDJ一般是用于股票分析的统计体系,根据统计学原理,通过一个特定的周期(常为9日、9周等
30 USD
Peak Trough Analysis is the great tool to detect peaks and troughs in your chart. Peak Trough Analysis tool can use three different peaks and troughs detection algorithm. The three algorithm include the orignal Fractals Indicator by Bill Williams, the Modified Fractals indicator and ZigZag indicator. You can use this peak and trough analysis tool to detect the price pattern made up from Equilibrium Fractal-Wave process. For further usage, there are good guide line on how to use this peak trough
FREE
Shape Pack MT5
John Louis Fernando Diamante
This indicator provides common shapes as drawing object options. The shapes are rotatable, resizable, draggable, and will keep their proportions (according to their handle trendline) across different chart scales. Multiple drawings are supported. Shapes: Square Rhombus Triangle (quadrilateral & isosceles) Circle (grid, overlapped grid, flexi grid, rotatable grid, concentric circles) Features: rays (all object edges will be rays) show/hide each individual drawing type, or all delete last drawn
FREE
Every indicator has its advantages and disadvantages. Trending ones show good signals during a trend, but lag during a flat. Flat ones thrive in the flat, but die off as soon as a trend comes. All this would not be a problem, if it was easy to predict when a flat changes to a trend and when a trend changes to a flat, but in practice it is an extremely serious task. What if you develop such an algorithm, which could eliminate an indicator's flaws and enhance its strengths? What if such an algorit
70 USD
Donchian Channel DC is the indicator of Donchian Channels, that plots maximum and minimum values of a specific period, besides mean value line. It´s possible to configure simple period for analysis and the indicator will plot all three values. You can trade with this indicator as trend or reversal, according to each strategy. Do not let to test others indicators as soon as others expert advisors.
30 USD
Swiss VWAPsimple
Terence Gronowski
5 (3)
Swiss VWAPsimple Motivation Did not find free VWAP that works, the one that I found craseh. So I created a VWAP which calculates values only for the actual day. So computer resouces are not over stressed. What is VWAP, how is it used?  VWAP stands for Volume Weighed Average Price, it calculates the running sum of tick volume and the runnung sum of price times tickvolume. The division of these sums result in a weighed price (Sum P*V/Sum V). The calculation starts normally at midnight. The value
FREE
JAC Trend Color Candle
Eduardo Da Costa Custodio Santos
O indicador "JAC  Trend Color Candle" para Meta Trader 5, foi criado para facilitar visualmente a tendência para o trader. Ele tem como base três parâmetros, que identifica a tendência de alta, tendência de baixa e mercado sem tendência. As cores são podem ser configuradas pelo trader, e a média também pode ser configurada pelo trader. os parâmetros de tendência não podem ser configurados, pois, são o diferencial do indicador.
30 USD
HLC bar MT5 Wyckoff
Eduardo Da Costa Custodio Santos
O indicador "HLC_bar_MT5 Wyckoff" para MT5 foi criado para facilitar a análise na hora da negociação. A Barra HLC foi utilizada por Richard Wyckoff e atualmente muito utilizada nas operações de "VSA". Wyckoff descobriu que a utilização da Máxima, mínima e fechamento deixava o gráfico muito mais limpo e fácil de ser analisado. O Indicador "HLC_bar_MT5 Wyckoff" permite: # Alterar a largura da barra; # Deixar a barra da mesma cor; # E destacar a barra que abriu e fechou no mesmo preço.
30 USD
O indicador é uma versão estendida do indicador Ichimoku Kinko Hyo padrão. Este indicador combina várias abordagens de análise de mercado e é usado para determinar as linhas de tendência, suporte e resistência, bem como sinais de compra ou venda. Para todas as linhas foi adicionada a capacidade de suavizar valores (26 tipos). Além disso, foi adicionada a capacidade de selecionar os preços de cálculo usados no algoritmo (16 opções), o que permite calcular os valores do indicador, por exemplo, a p
30 USD
Automatic Trendlines
Pasi Hakamaki
4.64 (42)
O indicador desenha linhas de tendência no gráfico. Este indicador possui seis entradas. O usuário pode especificar rótulos alternativos para ambas as linhas. Se várias instâncias do indicador forem usadas, os rótulos devem ser diferentes. O usuário pode definir a largura e a cor das linhas e a profundidade que especifica quais picos significativos devem ser usados. Por exemplo, Depth = 10 define as linhas de tendência usando os picos e vales atuais que têm pelo menos 10 barras à direita e à esq
FREE
Menora Indicator
Arnold Kurapa
4 (1)
Menora (All In One) Indicator. This is the advanced and premium indicator for the Magic Trend, a free indicator.  It has 3 output signals driven by different market conditions. This indicator has a double function of working as an indicator and utility at the same time. Specifications  1]  3 output signals a) Slow Moving Average with color change - The MA has a non-repaint color change, which makes it perfect for entry signals. b) Fast Moving Average (the original Magic Trend line) - Give
FREE
This indicator is an automated version of the Fibonacci retracement (Fib) indicator. Deciding the best areas to use when drawing the fib can be tricky and this  indicator was made with that in mind. When you drop it on the chart it will automatically choose the best points to draw the fib with, but in case you aren't satisfied with those regions, you can adjust it as you wish.
FREE
Indicator and Expert Adviser  EA Available in the comments section of this product. Download with Indicator must have indicator installed for EA to work. Mt5 indicator alerts for bollinger band and envelope extremes occurring at the same time. Buy signal alerts occur when A bullish candle has formed below both the lower bollinger band and the lower envelope  Bar must open and close below both these indicators. Sell signal occur when A bear bar is formed above the upper bollinger band and upp
FREE
Os compradores deste produto também adquirem
ICT, SMC, SMART MONEY CONCEPTS, SMART MONEY, Smart Money Concept, Support and Resistance, Trend Analysis, Price Action, Market Structure, Order Blocks, BOS/CHoCH,   Breaker Blocks ,  Momentum Shift,   Supply&Demand Zone/Order Blocks , Strong Imbalance,   HH/LL/HL/LH,    Fair Value Gap, FVG,  Premium  &   Discount   Zones, Fibonacci Retracement, OTE, Buy Side Liquidity, Sell Side Liquidity, BSL/SSL Taken, Equal Highs & Lows, MTF Dashboard, Multiple Time Frame, BigBar, HTF OB, HTF Market Structur
65 USD
Este é um indicador para MT5 que fornece sinais precisos para entrar em uma negociação sem redesenhar. Ele pode ser aplicado a qualquer ativo financeiro: forex, criptomoedas, metais, ações, índices. Ele fornecerá estimativas bastante precisas e informará quando é melhor abrir e fechar um negócio. Assista o vídeo (6:22) com um exemplo de processamento de apenas um sinal que compensou o indicador! A maioria dos traders melhora seus resultados de negociação durante a primeira semana de negociação c
125 USD
AW Trend Predictor MT5
Alexander Nechaev
5 (34)
A combinação de níveis de tendência e quebra em um sistema. Um algoritmo de indicador avançado filtra o ruído do mercado, determina a tendência, os pontos de entrada e os possíveis níveis de saída. Os sinais indicadores são registrados em um módulo estatístico, que permite selecionar as ferramentas mais adequadas, mostrando a eficácia do histórico do sinal. O indicador calcula as marcas Take Profit e Stop Loss. Manual e instruções ->   AQUI   / versão MT4 ->   AQUI Como negociar com o indicador
55 USD
Este é sem dúvida o indicador de reconhecimento automático de formação de preço harmônico mais completo que você pode encontrar para a MetaTrader Platform. Ele detecta 19 padrões diferentes, leva as projeções de Fibonacci tão a sério quanto você, exibe a Zona de Reversão Potencial (PRZ) e encontra níveis adequados de stop loss e take-profit. [ Guia de instalação | Guia de atualização | Solução de problemas | FAQ | Todos os produtos ] Detecta 19 formações harmônicas de preços diferentes Tr
249 USD
Matrix Arrow Indicator MT5
Juvenille Emperor Limited
5 (11)
O   Matrix Arrow Indicator MT5   é uma tendência única 10 em 1 seguindo um indicador multi-timeframe   100% sem repintura   que pode ser usado em todos os símbolos/instrumentos:   forex ,   commodities ,   criptomoedas ,   índices ,   ações .  O  Matrix Arrow Indicator MT5  determinará a tendência atual em seus estágios iniciais, reunindo informações e dados de até 10 indicadores padrão, que são: Índice de movimento direcional médio (ADX) Índice de canal de commodities (CCI) Velas clássicas de
75 USD
Advanced Supply Demand MT5
Bernhard Schweigert
4.42 (12)
Atualmente com 33% de desconto! A melhor solução para qualquer Trader Novato ou especialista! Este indicador é uma ferramenta de negociação exclusiva, de alta qualidade e acessível porque incorporamos uma série de recursos proprietários e uma nova fórmula. Com esta atualização, você poderá mostrar fusos horários duplos. Você não só será capaz de mostrar um TF mais alto, mas também mostrar ambos, o TF do gráfico, MAIS o TF mais alto: MOSTRANDO ZONAS ANINHADAS. Todos os traders de Oferta e Demanda
199 USD
Blahtech Supply Demand MT5
Blahtech Limited
4.45 (11)
Supply Demand uses previous price action to identify potential imbalances between buyers and sellers. The key is to identify the better odds zones, not just the untouched ones. Blahtech Supply Demand indicator delivers functionality previously unavailable on any trading platform. This 4-in-1 indicator not only highlights the higher probability zones using a multi-criteria strength engine, but also combines it with multi-timeframe trend analysis, previously confirmed swings and engulfing detecto
99 USD
Owl Smart Levels MT5
Sergey Ermolov
5 (7)
Guia do Indicador   |  Estratégia  Owl Smart Levels  |   Versão MT4  |  Como instalar?   |   FAQ O Indicador Owl Smart Levels é um sistema de negociação completo dentro de um indicador que inclui ferramentas populares de análise de mercado, como fractais avançados de Bill Williams , Valable ZigZag que constrói a estrutura de onda correta do mercado e níveis de Fibonacci que marcam os níveis exatos de entrada no mercado e lugares para obter lucros. Para uma descrição detalhada do sistema de nego
97 USD
TPA True Price Action indicator reveals the true price action of the market makers through 100% non-repainting signals strictly at the close of a candle! TPA shows entries and re-entries, every time the bulls are definitely stronger than the bears and vice versa. Not to confuse with red/green candles. The shift of power gets confirmed at the earliest stage and is ONE exit strategy of several. There are available now two free parts of the TPA User Guide for our customers. The first "The Basics"
168 USD
The Volume by Price Indicator for MetaTrader 5 features Volume Profile and Market Profile TPO (Time Price Opportunity). Get valuable insights out of currencies, equities and commodities data. Gain an edge trading financial markets. Volume and TPO histogram bar, line and metric charts. TPO letter and block marker charts including split structures. Positioning and styling options to suit the user's needs and context. Volume Profile and Market Profile TPO Point of Control (VPOC and TPOC), Imbalanc
179.95 USD
Market Profile defines a number of day types that can help the trader to determine market behaviour. A key feature is the Value Area, representing the range of price action where 70% of trading took place. Understanding the Value Area can give traders valuable insight into market direction and establish the higher odds trade. It is an excellent addition to any system you may be using. Blahtech Limited presents their Market Profile indicator for the MetaTrader community. Inspired by Jim Dalton’s
99 USD
ACB Breakout Arrows MT5
KEENBASE SOFTWARE SOLUTIONS
5 (1)
The ACB Breakout Arrows indicator provides a crucial entry signal in the market by detecting a special breakout pattern. The indicator constantly scans the chart for a settling momentum in one direction and provide the accurate entry signal right before the major move. Get multi-symbol and multi-timeframe scanner from here - Scanner for ACB Breakout Arrows MT 5 Key features Stoploss   and Take Profit levels are provided by the indicator. Comes with a MTF Scanner dashboard which tracks the br
145 USD
Italo Volume Indicator MT5
Italo Santana Gomes
4.69 (13)
BUY INDICATOR AND GET EA FOR FREE AS A BONUS + SOME OTHER GIFTS! ITALO VOLUME INDICATOR  is the best volume indicator ever created, and why is that? The Indicator works on all time-frames and assets, indicator built after 6 years of experience on forex and many other markets. You know many volume indicators around the internet are not complete, does not help, and it's difficult to trade, but the Italo Volume Indicator is different , the Italo Volume Indicator shows the wave volume, when market
65 USD
Auto Order Block with break of structure Detect Break of Structure , Mark Order Block and draw Entry / Stop and Risk to Reward lines when Order block is touch by price with Alert. Trend is Manually set to filter signals in a direction by a button on the chart. Entry / Stop and Risk to Reward lines can also be switch on / off by button on chart. Futures Auto Mark Break of Structure Auto Mark Order block Auto Mark higher time frame Point Of  Interest ( POI ) Popup Alert when BoS , Order block
55 USD
Royal Wave Pro M5
Vahidreza Heidar Gholami
3.67 (3)
Royal Wave is a Trend-Power oscillator which has been programmed to locate and signal low-risk entry and exit zones. Its core algorithm statistically analyzes the market and generates trading signals for overbought, oversold and low volatile areas. By using a well-designed alerting system, this indicator makes it easier to make proper decisions regarding where to enter and where to exit trades. Features Trend-Power Algorithm Low risk Entry Zones and Exit Zones Predictions for Overbought and Over
129 USD
FX Power MT5
Daniel Stein
4.3 (23)
Quer tornar-se um comerciante forex de 5 estrelas constantemente lucrativo? 1.   Leia a descrição básica do nosso   sistema de   negociação simples e   a sua grande actualização estratégica em 2020 2.   Envie um screenshot da sua compra para obter o seu convite pessoal para o nosso chat comercial exclusivo FX Power   é o primeiro medidor de força da moeda com uma história completa em todos os períodos de tempo. Analisa o impulso e a força de todas as principais moedas para determinar transa
66 USD
Introduction to EFW Analytics EFW Analytics was designed to accomplish the statement "We trade because there are regularities in the financial market". EFW Analytics is a set of tools designed to maximize your trading performance by capturing the repeating fractal geometry, known as the fifth regularity in the financial market. The functionality of EFW Analytics consists of three parts. Firstly, Equilibrium Fractal Wave Index is an exploratory tool to support your trading logic to choose which r
200 USD
Legacy of Gann for MT5
Pavel Zamoshnikov
5 (2)
The indicator very accurately determines the levels of the possible end of the trend and profit fixing. The method of determining levels is based on the ideas of W.D.Gann, using an algorithm developed by his follower Kirill Borovsky. Extremely high reliability of reaching levels (according to K. Borovsky  - 80-90%) Indispensable for any trading strategy – every trader needs to determine the exit point from the market! Precisely determines targets on any timeframes and any instruments (forex, met
65 USD
Ultimate Supply Demand MT5
Ramon Sobrevals Arce
5 (2)
After working during many months, with the help of Neural Networks, we have perfected the ultimate tool you are going to need for identifying key price levels (Supports and Resistances) and Supply and Demand zones. Perfectly suitable to trigger your trades, set up your future actions, decide your Take Profit and Stop Loss levels, and confirm the market direction. Price will always move between those levels, bouncing or breaking; from one zone to another, all the remaining movements are just mark
79 USD
XQ Indicator MT5
Marzena Maria Szmit
5 (1)
The signal conditions are a combination of three indicators, and XQ Forex Indicators only display  medium and long-term trends . The indicator's efficacy has been improved with the addition of a filter that blocks out false signals. The XQ Forex Indicator can be used on  FX pairs, CFDs, and Cryptocurrencies . There are two type of signals:  Buy or Sell and Big Long or Big Short It is possible to enable sending emails when a major trend-change signal is detected, as well as to display the alerts
179 USD
MetaBands M5
Vahidreza Heidar Gholami
5 (2)
MetaBands utiliza algoritmos poderosos e únicos para desenhar canais e detectar tendências, a fim de fornecer aos traders pontos potenciais para entrar e sair de negociações. É um indicador de canal mais um indicador de tendência poderoso. Inclui diferentes tipos de canais que podem ser mesclados para criar novos canais simplesmente usando os parâmetros de entrada. O MetaBands usa todos os tipos de alertas para notificar os usuários sobre eventos de mercado. Recursos Suporta a maioria dos algori
129 USD
Este indicador reconhece mais de 30 padrões de candlestick japoneses e os destaca maravilhosamente no gráfico. É simplesmente um daqueles indicadores que os operadores de ação de preços não podem viver sem. Melhore sua análise técnica da noite para o dia Detectar padrões de velas japonesas facilmente Negocie padrões de reversão confiáveis e universais Entre nas tendências estabelecidas com segurança usando padrões de continuação O indicador não repinta e implementa alertas O indicador implement
99 USD
Royal Scalping Indicator M5
Vahidreza Heidar Gholami
5 (8)
Royal Scalping Indicator is an advanced price adaptive indicator designed to generate high-quality trading signals. Built-in multi-timeframe and multi-currency capabilities make it even more powerful to have configurations based on different symbols and timeframes. This indicator is perfect for scalp trades as well as swing trades. Royal Scalping is not just an indicator, but a trading strategy itself. Features Price Adaptive Trend Detector Algorithm Multi-Timeframe and Multi-Currency Trend Low
149 USD
ICT Concepts
Minh Truong Pham
The ICT Concepts indicator regroups core concepts highlighted by trader and educator "The Inner Circle Trader" (ICT) into an all-in-one toolkit. Features include Market Structure (MSS & BOS), Order Blocks, Imbalances, Buyside/Sellside Liquidity, Displacements, ICT Killzones, and New Week/Day Opening Gaps. It’s one kind of Smart money concepts. DETAILS Market Structure Market structure labels are constructed from price breaking a prior extreme point. This allows a user to determine the current ma
55 USD
PZ Trend Trading MT5
PZ TRADING SLU
3.67 (3)
O Trend Trading é um indicador projetado para lucrar o máximo possível com as tendências que ocorrem no mercado, cronometrando retrocessos e rupturas. Ele encontra oportunidades de negociação analisando o que o preço está fazendo durante as tendências estabelecidas. [ Guia de instalação | Guia de atualização | Solução de problemas | FAQ | Todos os produtos ] Negocie mercados financeiros com confiança e eficiência Lucre com as tendências estabelecidas sem ser chicoteado Reconhecer retrocesso
175 USD
IVISTscalp5
Vadym Zhukovskyi
Apresentamos a você o indicador iVISTscalp5, que não é apenas único, mas também eficaz em operações de negociação. Este indicador é baseado em dados de tempo e é o resultado de muitos anos de experiência e análise aprofundada dos mercados financeiros. O indicador iVISTscalp5 é uma excelente ferramenta para negociação manual. Conveniência, simplicidade e visualização - toda a complexidade está escondida dentro dele. Simplificamos as configurações e o uso do indicador iVISTscalp5 ao máximo. O indi
500 USD
The Price Action Finder Multi indicator is a multi-currency and multi-timeframe indicator. It searches for patterns of the Price Action system on all standard time frames at once and on a large (up to 60) number of instruments (currencies, stocks, metals, etc.). The resulting patterns are placed by the indicator in a table at the bottom of the screen. Patterns: At the moment, the indicator contains the following patterns: Outside bar , Inside bar , Pin bar , Force bar , PPR , as well as the In
149 USD
Stargogs Spike Catcher
Lorenzo Edward Beukes
5 (6)
Stargogs Spike Catcher V3.11 This Indicator is Developed To milk the BOOM and CRASH indices . Send me Message if you need any help with the indicator.  CHECK OUT THE STARGOGS SPIKE CATCHER EA/ROBOT V3: CLICK HERE ALSO CHECK OUT SECOND TO NONEFX SPIKE CATCHER:   CLICK HERE STARGOGS SPIKE CATCHER V3.11 WHATS NEW! Brand New Strategy. This is the Indicator you need for 2023. The Indicator Gives you an Entry at a time when conditions are met and you should use TP & SL. New Trendline that changes col
100 USD
AI Forecast MT5
Leonardo Antonio Camacaro Armas
The "AI Forecast" indicator is the result of a unique experiment in which I asked an AI how to create the best indicator to anticipate the market. The AI suggested measuring the past history of the price and its reactions to different levels, and then calculating the probabilities of the price reaction in the future. With this idea, I designed with the help of another AI the "AI Forecast" indicator, which adapts to any MetaTrader chart and shows you three lines: one for entry and two for poss
150 USD
BTFX Daybreak
Bradley Thomas Farrington
O indicador Daybreak criado por Best Trades Fx marca as zonas para observar um rompimento durante a abertura do mercado de Londres.   As zonas são definidas em GMT + 2 como padrão, para que isso seja eficaz em sua plataforma, você deve selecionar a hora de início para corresponder às 12h GMT e a hora de término para corresponder às 7h GMT, dependendo do servidor da sua corretora.   Este indicador pode ser usado em todos os símbolos.   Assista ao vídeo do Youtube para uma explicação mais aprofund
66 USD
Mais do autor
Trading Chaos Chart
Gennadiy Stanilevych
5 (1)
O principal objetivo do indicador é detectar e marcar no gráfico os seguintes sinais de negociação descritos em "Trading Chaos (2-nd edition)": Divergência nas barras de alta e baixa com angulação (incluindo o squat). Barras nas zonas em vermelho e verde de acordo com a cor do histograma Awesome Oscillator. Barras Squat no gráfico são independente da cor do histograma Awesome Oscillator. Níveis de fractais "importantes" em relação à "linha dos Dentes" do indicador Alligator. Desenha raios de ang
60 USD
Recognizer 1 2 3 Patterns
Gennadiy Stanilevych
4.53 (34)
tO indicador é destinado ao reconhecimento e marcação dos padrões 1-2-3 comprar e vende de um gráfico. O indicador vai ajudar um negócio para determinar o início e o sinal de fractais, e especificar os possíveis pontos de entrada em todos os tempos do МetaTrader 5. Linhas de Fibonacci são desenhados no gráfico para indicar supostos alvos de movimento sobre a base da teoria ondulatória. As formações 1-2-3 parecem ser especialmente importante como as divergências (convergências) são formados em to
FREE
Trading Chaos Expert
Gennadiy Stanilevych
5 (10)
Não existe software igual no mundo e que represente um "console" universal de negociação informando sinais para operar, entrada automatizada do mercado, configurando o Stop Loss e o Take Profit, assim como o Trailling Profit para diversas negociações em apenas uma janela aberta. O controle intuitivo do Expert Advisor em "três cliques" garante um uso abrangente de todas as suas funções em diferentes computadores, incluindo tablets. Interagindo com indicadores de sinal adicionais que marcam o gráf
995 USD
Alligator modified
Gennadiy Stanilevych
5 (5)
The indicator has standard settings. The new modification of indicator provides special marking of the segment when the moving averages begin to form a cross in one direction or another. The Alligator`s cross indicates that the trend is about to change. Modified Alligator helps traders to determine a trend on a particular timeframe even if the averages are intertwined and have a shift in the future. Direction of a trend is determined by a cross of the averages with a specified marking area on th
100 USD
Spread and Swap monitor
Gennadiy Stanilevych
5 (1)
O indicador tem o objetivo de determinar o tamanho do spread e swap, a distância para configurar ordens pendentes, stop loss permitido com o preço atual e o risco por 1 ponto na moeda de depósito. O indicador informa ao trader sobre possíveis despesas e os lucros adicionais relacionados com a transferência de uma posição para a próxima sessão de negociação do instrumento financeiro. Ele também informa sobre o tamanho do spread, a distância das ordens pendentes, stop loss e o trailing stop a part
30 USD
Trading Chaos Expert Lite
Gennadiy Stanilevych
5 (1)
Trading Chaos Expert Lite is a light version of Trading Chaos Expert. In the Lite version it is not possible to receive the table of trading signals, automatically place pending orders based on them and maintain open positions for multiple symbols at the same time in one window. Only the Current Chart mode is available. In all other features the panel is fully consistent with the basic version of the Expert Advisor. This is, rather, a well thought out trader's assistant which is not easy to do w
250 USD
Purpose and functions of the indicator The indicator determines and marks the moments of trend change on the chart based on the theory of fractal levels breakout on any of the analyzed timeframes. If a breakout based on all rules is valid, a horizontal line with corresponding color will appear on the chart. If there is an uptrend, the line will be blue. In the descending trend, the line will be red. The blue line is a strong support level, the trader should look for buying opportunities above th
60 USD
Auto Format
Gennadiy Stanilevych
Este é um utilitário para o dimensionar automaticamente o gráfico com menos de 140 barras visíveis. Isso é necessário para uma análise correta de ondas de acordo com a estratégia "Negociação do Caos"de Bill Williams. O utilitário pode ser usado em qualquer período de tempo disponível no МetaТrader 5. Ele desenha uma linha vertical através da primeira barra iniciando o cálculo. Esta linha permite que você veja o ponto provável de partida da sequência da onda, juntamente com um número suficiente d
60 USD
Short term extremum
Gennadiy Stanilevych
5 (1)
The indicator determines and marks the short-term lows and highs of the market on the chart according to Larry Williams` book "Long-term secrets to short-term trading". "Any time there is a daily low with higher lows on both sides of it, that low will be a short-term low. We know this because a study of market action will show that prices descended in the low day, then failed to make a new low, and thus turned up, marking that ultimate low as a short-term point. A short-term market high is just
30 USD
O principal objetivo do indicador é determinar e marcar sinais de negociação no histograma do Accelerator Oscillator, que foram descritos por Bill Williams em seu livro "New Trading Dimensions". A lista de sinais: O sinal de compra quando o histograma do indicador está abaixo da linha zero. O sinal de venda quando o histograma do indicador está abaixo da linha zero. O sinal de venda quando o histograma do indicador está acima da linha de zero. O sinal de compra quando o histograma do indicador e
30 USD
Slider
Gennadiy Stanilevych
5 (1)
This is a utility created to ease charts watching on tablet PCs. The indicator allows you automatically alternately display "slide show" of all currency charts from "MarketWatch". The user can set the display time interval (in seconds) between charts in indicator settings. In addition, there is an option of selecting the angle of Start/Stop button which starts and stops the display of charts. This function is very useful if a trader noticed a trading signal and would like to study it in more det
FREE
Trading Chaos Expert Demo
Gennadiy Stanilevych
4 (7)
Trading Chaos Expert Demo é uma versão demo do Trading Chaos Expert. A versão demo do Painel Expert permite que o trader aprenda o funcionamento e as possibilidades do algoritmo Trading Chaos Expert. Isso irá ajudá-lo a aprender a trabalhar com o Expert Advisor sem risco em uma conta demo em vez do testador de estratégia. Na versão demo: apenas um par de moeda é usado (1 especificado nas configurações) você só pode usar os tempos M5, M30 e H12 (mesmo se você especificar outro) todas as posições
FREE
Slider profy
Gennadiy Stanilevych
The idea of ​​enhancing the free Slider utility appeared after the release of a lite version of the EA trade panel Trading Chaos Expert Lite , which operates in the Current Chart mode without the possibility to maintain trades of several symbols in a single window. The purpose of Slider profy Ease search for trading signals by automatic display of charts of currency pairs from the "Market Watch" one by one at a specified interval of time in seconds. Automation of one-click placing of pending ord
30 USD
Stairway
Gennadiy Stanilevych
The multi-timeframe indicator of the levels of the Pivot Points. Every closed daily period has its own so-called reference point - Pivot Point, which sets the levels for smaller intraday timeframes for the following day. The Pivot Points indicators existing in the codes have no method of showing the dynamics of the pivot point changes on the historical data of the price chart. Pivot Point calculation formula. Pivot=(High + Low + Close) /3 High — the maximum of the previous day; Low — the minimum
30 USD
The standard Bollinger Bands indicator has been improved by integrating additional indications from the Standard Deviation indicator (StdDev), which gives an additional filter for confirming trading signals. In addition, the color of the indicator's lines shows the beginning of a trend, its development and exhaustion. This indicator has a signal block that notifies the trader of the beginning of the trend on any time frame to which it is attached. Settings Type of messages - select the type of
30 USD
Fifth dimension
Gennadiy Stanilevych
5 (1)
The indicator looks for the "Fifth dimension" trade signals and marks them on the chart. A detailed description of the chart patterns that generate the trade signals can be found in Chapter 8 "The Balance Line Trades" in the book Williams' "New Trading Dimensions". Signal levels with indication of the position entry or stop loss placement price are indicated directly on the chart. This feature creates additional convenience for the trader when placing pending orders. A solid horizontal line is d
30 USD
Filtro:
PROFITFACTOR1
106
PROFITFACTOR1 2021.06.29 21:54 
 

Удобный индикатор в дополнение панели

Responder ao comentário
Versão 6.961 2021.12.07
Индикатор скомпилирован в новой версии редактора МТ5 по рекомендации администрации mql5.
Versão 6.91 2019.06.02
Исправлена ошибка в сигнале "блюдце" при переходе гистограммы через линию нуля.
Versão 6.90 2019.03.18
Индикатор оптимизирован для работы с 2009 версией терминала МТ5 и выше.
Versão 6.15 2017.01.13
Added the signal block.
Versão 6.13 2015.05.26
Code optimization. Acceleration with graphic objects on the chart.
Versão 2.4 2013.12.25
Improved performance of the indicator due to optimization of the source code for less resource consumption.
Versão 2.3 2013.12.09
Enhanced the function that detects and displays divergence. The divergence lines are now displayed both on the Modified Awesome Oscillator histogram and on the main price chart.