• Visão global
  • Comentários (5)
  • Discussão
  • O que há de novo

Profile Map MT5

5

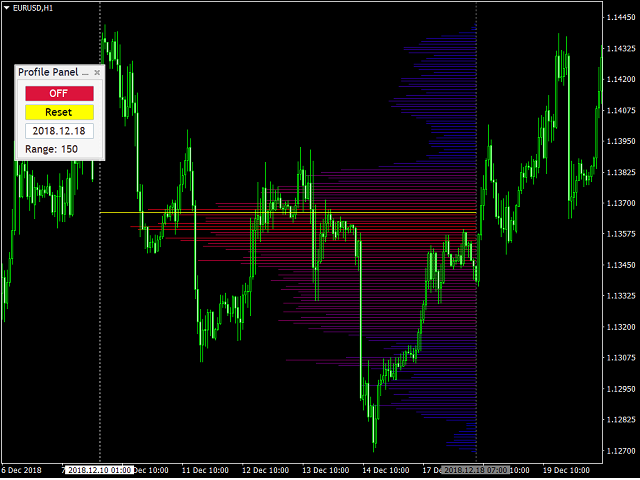
Market Profile helps the trader to identify the behavior if major market players and define zones of their interest. The key feature is the clear graphical display of the range of price action, in which 70% of the trades were performed. Understanding of the location of volume accumulation areas can help traders increase the probability of success. The tool can be used as an independent system as well as in combination with other indicators and trading systems.

this indicator is designed to suit the needs of all profile traders. It provides functionality and features to display the market profile on the required number of bars in history.


Feature Highlights

  • Possibility to display the market profile on the required number of bars in history.
  • Display of the profile for the required time period and control from the chart.
  • Display of the required number of horizontal lines.
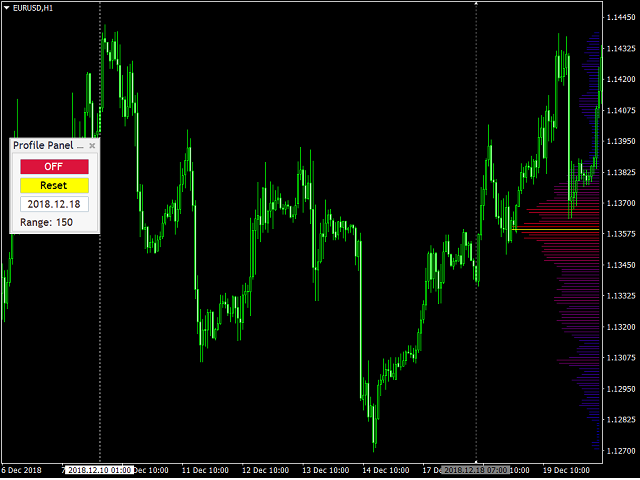
  • Display of the profile at a convenient side.
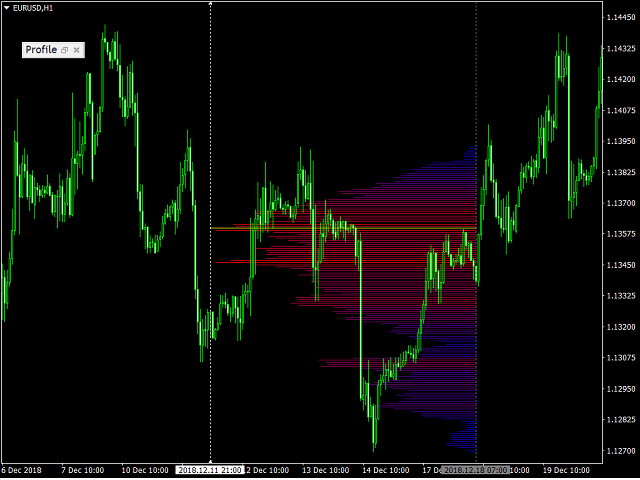
  • Graphical display of the profile in the form of a gradient, reflecting the strength of the levels.
  • Color change of the profile and accumulation center.
  • Point of control


Inputs

  • Volume type - tick or real
  • Amount of lines - he number of horizontal lines in the profile
  • Shift the right edge to the newest bar - shifting the right edge/line of the profile
  • Shift the left edge if the right was shifted - shifting the left edge if the right one is shifted.
  • Left edge style - the style for the left edge/line
  • Right edge style - the style for the right edge/line
  • Right edge color - the color for the right edge/line
Comentários 5
Mikhail Morozov
145
Mikhail Morozov 2018.08.08 10:22 
 

Здравствуйте! В индикаторе не разбираюсь. Но на графике выглядит очень стильно профессионально и красиво, радует глаз. Купил и всем рекомендую...

vazelin2x5
34
vazelin2x5 2018.07.01 20:10 
 

Всем брать!!! Спасибо за труды!.

Compositeman
20
Compositeman 2018.06.26 09:40 
 

Добавьте возможность изменять цвет и, если можно, толщину левой вертикальной линии (в свойствах индикатора на вкладке "цвета" некая настройка есть, но она не изменяется).

По умолчанию в текущей версии (1.2) цвет у этой линии белый/серебристый (а не синий как на скриншотах) и при использовании на графиках со светлым фоном ее вообще не видно.

Produtos recomendados
Noize Absorption Index - is the manual trading system that measures the difference of pressure between bears forces and bulls forces. Green line - is a noize free index that showing curent situation. Zero value of index shows totally choppy/flat market.Values above zero level shows how powerfull bullish wave is and values below zero measures bearish forces.Up arrow appears on bearish market when it's ready to reverse, dn arrow appears on weak bullish market, as a result of reverse expectation.
199 USD
VWAP Daily
Anton Polkovnikov
Weighted average price indicator or VWAP. The well-known standard VWAP with the beginning of the day is added with the function of selecting the periodization. It can be calculated both every day and on other periods. Also the indicator allows to exclude the volume from the calculation, which will allow using it on the cryptocurrencies and forex. There is an alert for a VWAP price crossing. There are 1 and 2 standard deviation. Settings: Volume: turning volume on and off in the calculation mecha
50 USD
O nível Premium é um indicador único com mais de 80% de precisão nas previsões corretas! Este indicador foi testado pelos melhores Especialistas em Negociação por mais de dois meses! O indicador do autor você não encontrará em nenhum outro lugar! A partir das imagens você pode ver por si mesmo a precisão desta ferramenta! 1 é ótimo para negociar opções binárias com um tempo de expiração de 1 vela. 2 funciona em todos os pares de moedas, ações, commodities, criptomoedas Instruções:
1 100 USD
Este indicador permite-lhe desfrutar os dois produtos mais populares para analisar volumes de ofertas e das negociações no mercado a um preço favorável: Actual Depth of Market Chart Actual Tick Footprint Volume Chart Este produto combina o poder de ambos os indicadores e é fornecido como um único arquivo. Venda Anti-crise. Hoje com menor preço. Anda logo! A funcionalidade do COMBO Actual Depth of Market e Tick Volume Chart é totalmente idêntica aos indicadores originais. Você vai aproveitar o p
40 USD
Trend Fibonacci is a unique indicator that combines a power of Fibonacci sequences and ranges. How to read: - There are three zones --> red, gold and green - Red candlestick = downtrend - Green candlestick = uptrend   - Gold candlestick = no established trend Inputs: Per = number of bars used for calculations FirstRatio = first Fibonacci ratio (Or use any ratio you want) SecondRatio = second Fibonacci ratio (Or use any ratio you want) !! IF YOU PURCHASE THE INDICATOR, CONTACT ME FOR
47 USD
BoxChart MT5
Evgeny Shevtsov
5 (6)
The market is unfair if only because 10% of participants manage 90% of funds. An ordinary trader has slim changes to stand against these "vultures". This problem can be solved. You just need to be among these 10%, learn to predict their intentions and move with them. Volume is the only preemptive factor that faultlessly works on any timeframe and symbol. First, the volume appears and is accumulated, and only then the price moves. The price moves from one volume to another. Areas of volume accumu
33 USD
O indicador cria cotações atuais, que podem ser comparadas com as históricas e, com base nisso, fazer uma previsão do movimento dos preços. O indicador possui um campo de texto para navegação rápida até a data desejada. Opções: Símbolo - seleção do símbolo que o indicador exibirá; SymbolPeriod - seleção do período do qual o indicador coletará dados; IndicatorColor - cor do indicador; HorisontalShift - deslocamento das cotações desenhadas pelo indicador pelo número especificado de
55 USD
O indicador calcula e traça automaticamente os níveis de suporte e resistência de Fibonacci - uma das ferramentas mais eficazes para análise de mercado. O cálculo usa os dados de preço médio para o período e intervalo de tempo selecionados. O mínimo e o máximo para este período são considerados o início e o fim do movimento. Os níveis de Fibonacci permitem que você veja os pontos de referência potenciais, em torno dos quais o movimento do preço pode desacelerar ou reverter, ou seja, eles são usa
30 USD
Before installing the HeatMap indicator make sure you are using a broker that gives you access to the Depth of market (DOM) !! This indicator creates a heatmap on your chart allowing you to see the buy or sell limit orders easily and in real time. You have the possibility to change the setting and the colors of the HeatMap in order to adapt to all markets and all charts. Here is an example of a setting you can use with the NASDAQ100 on the AMPGlobal broker :  https://www.youtube.com/watch?v=x0
80 USD
Este é um painel de negociação visual que ajuda você a realizar e gerenciar operações facilmente, evitando erros humanos e aprimorando sua atividade comercial. Ele combina uma interface visual fácil de usar com uma abordagem sólida de gerenciamento de riscos e posições. [ Guia de instalação | Guia de atualização | Solução de problemas | FAQ | Todos os produtos ] Surpreendentemente fácil de usar Negocie facilmente a partir do gráfico Negocie com gerenciamento preciso de riscos, sem complicações
99 USD
A singularidade deste indicador reside no algoritmo de contabilidade de volume: a acumulação ocorre diretamente para o período selecionado sem referência ao início do dia. As últimas barras podem ser excluídas do cálculo, então os dados atuais terão menos influência sobre os níveis significativos (volumes) formados anteriormente. Para um cálculo mais preciso, os dados do gráfico M1 são usados por padrão. A etapa de distribuição dos volumes de preços é regulamentada. Por padrão, a borda direita d
35 USD
Market Profile defines a number of day types that can help the trader to determine market behaviour. A key feature is the Value Area, representing the range of price action where 70% of trading took place. Understanding the Value Area can give traders valuable insight into market direction and establish the higher odds trade. It is an excellent addition to any system you may be using. Blahtech Limited presents their Market Profile indicator for the MetaTrader community. Inspired by Jim Dalton’s
99 USD
Uma das sequências numéricas é chamada de "Forest Fire Sequence". Foi reconhecida como uma das mais belas novas sequências. Sua principal característica é que essa sequência evita tendências lineares, mesmo as mais curtas. É esta propriedade que formou a base deste indicador. Ao analisar uma série temporal financeira, este indicador tenta rejeitar todas as opções de tendência possíveis. E somente se ele falhar, ele reconhece a presença de uma tendência e dá o sinal apropriado. Esta abordagem pe
30 USD
HMA Trend Professional MT5
Pavel Zamoshnikov
4.4 (5)
Improved version of the free HMA Trend indicator (for MetaTrader 4) with statistical analysis. HMA Trend is a trend indicator based on the Hull Moving Average (HMA) with two periods. HMA with a slow period identifies the trend, while HMA with a fast period determines the short-term movements and signals in the trend direction. The main differences from the free version: Ability to predict the probability of a trend reversal using analysis of history data. Plotting statistical charts for analyz
30 USD
O Initial Balance (Equilíbrio Inicial/Balanço inicial) é um conceito relacionado ao estudo de volume (para saber mais, estude sobre Market Profile e Auction Market Theory. É possível encontrar alguns vídeos em inglês ao pesquisar "Initial Balance Market Profile"). O IB define um range em que os preços foram negociados na primeira hora do pregão. A amplitude do range é importante e o rompimento do range definido pelo Initial Balance pode ter ocorrido pelo movimento de diversos players operando
30 USD
This is a multi-symbol and multi-timeframe table-based indicator designed for a candlestick patterns detection with 46 patterns for META TRADER 5. Each formation has own image for easier recognition. Here you find most popular formations such as "Engulfing", "Hammer", "Three Line Strike", "Piercing" or Doji - like candles. Check my full list of patterns on my screenshots below. Also you can not only switch all bearish or bullish patterns from input, but also select formation for a specified symb
30 USD
The best time to trade Using this Indicator is when the time reach exactly hour,half,45 minutes,15 minutes and sometimes 5 minutes.. This indicators is helpful to those who trade boom and crash indecies.How to read this indicator first you'll see Blue allow and Red allow all these allows used to indicate or to detect the spike which will happen so the allow happens soon before the spike happen.This indicator works properly only in boom and crash trading thing which you have to consider when
30 USD
Market profile was developed by Peter Steidlmayer in the second half of last century. This is a very effective tool if you understand the nature and usage. It's not like common tools like EMA, RSI, MACD or Bollinger Bands. It operates independently of price, not based on price but its core is volume. The volume is normal, as the instrument is sung everywhere. But the special thing here is that the Market Profile represents the volume at each price level. 1. Price Histogram The Price Histogram
50 USD
VolumeProfile MT5
Robert Hess
3.33 (6)
Description: The Volume Profile displays detailed informations of historical trading activities at certain price levels (Market Profile). Locate the areas with the best prices in the market and get an advantage over other market participants. Support: The indicator is constantly being developed and improved. Please do not hesitate to contact me via the MQL5 Platform. I am very grateful about any Bug report, so that i can constantly improve the indicator. I appreciate any public review for this
140 USD
Tunafish EA
Ismaele Daniele Lodetti
Tunafish EA is the most efficient EA on my profile. I spent a lot of time and effort to make this software sophisticated with possibilities of high potential returns while keeping the drawdown below 25%. The algorithms of the robot provide investors of any level of training with an investment opportunity that is both safe and aggressive. Tunafish EA imitating the work of the brain, capable of learning and adapting to changing conditions and predicting situations. When applied to trading in fina
69 USD
Binary Options Assistant (BOA) Multi Currency Dashboard for Binary Options (MT5) . You can use any of the BOA Signals Indicators with the dashboard. Just change the BOA Signals Indicator Name in the dashboard settings to the indicator you want to get signals from. For example: CHILL. BLAZE:  BOA_BLAZE_Indicator_v1   Strategy :   BLW Online Trading Binary Options Strategy (3 Moving Average) LAVA:  BOA_LAVA_Indicator_v1   Strategy:   Lady Trader Binary Options Strategy (Bollinger Bands & Stoc
30 USD
Traçar fan e retração de fibonacci manualmente é cansativo e propenso a erros, então deixe o indicador traçar para você e se concentre na análise de mercado e preços, o indicador é personalizável, você será capaz de definir o número de dias, o tipo (fan ou retração) e níveis percentuais independentes para fan e retração. Um vídeo vale mais que mil palavras, então assista ao vídeo de demonstração.
30 USD
Perfect Sniper
Ignacio Agustin Mene Franco
Perfect Sniper! is a triple indicator with support resistance detection, downtrend channel, uptrend channel Bands included! where he hunts the rebounds in the red lines for sale, in the green lines mark purchase, in the lower bands that are the breaks gives another second entry either buy or sell, perfect to take advantage of the double entrance, It is used in any temporality, It is used to scalp and long on h1 or h4 to D1. It works for Forex markets, All pairs. It is used for the synthetic inde
100 USD
Best SAR MT5
Ashkan Hazegh Nikrou
5 (1)
Descrição :  estamos felizes em apresentar nosso novo indicador gratuito baseado em um dos indicadores profissionais e populares no mercado forex (PSAR) este indicador é uma nova modificação no indicador SAR parabólico original, no indicador pro SAR você pode ver o cruzamento entre os pontos e o gráfico de preços, este crossover não é sinal, mas fala sobre o potencial de fim de movimento, você pode começar a comprar pelo novo ponto azul e colocar o stop loss um atr antes do primeiro ponto azu
FREE
Volality Index scalper indicator  Meant for Volality pairs such as Volality 10, 25, 50, 75 and 100 The indicator works on all timeframes from the 1 minute to the monthly timeframe the indicator is non repaint the indicator has 3 entry settings 1 color change on zero cross 2 color change on slope change 3 color change on signal line cross Orange line is your sell signal Blue line is your buy signal.
35 USD
Modified Rainbow
Rafael Alejandro Rey Alves
Modified Rainbow   The Modified Rainbow indicator is intended to work in different scenarios. The indicator uses a combination of technical indicators to detect buy or sell opportunities (different Moving Averages and other technical indicators). The indicator works with any currency pair, stocks, cryptocurrencies and synthetic indices. The indicator can be used for both traditional trading and binary options. The indicator works with any time frame, from M1 to MN. When the blue arrow
30 USD
Your Trend Friend
Luigi Nunes Labigalini
A tendência é sua amiga! Veja a cor do indicador e faça suas operações nessa direção. Ele não repinta. Ou seja, depois que cada candle se fecha, a cor dele é definitiva e não irá se alterar. Você pode focar em movimentos mais curtos e rápidos ou tendências mais longas, basta testar o que melhor se encaixa no seu operacional de acordo com o ativo e tempo gráfico usado. Altere o parâmetro de entrada "Length" e o indicador irá se adaptar automaticamente (quanto maior ele for, maior a tendência a
99 USD
Why Our Indicators? 1. At our service, we offer the lowest prices possible without compromising on quality or features. 2. Enjoy premium features and top-notch quality trading tools at an affordable price point. 3. With up to 100 activations, you can use our tools on multiple devices without extra cost. 4. Our mission is to provide powerful trading tools to everyone, regardless of their budget. 5. Join us today and discover the best value in the market for high-quality trading tools. Current P
30 USD
1. What is this         Rising volatility and falling volatility are not the same, whether it is academic research or actual testing has shown this point.         The original ATR indicator is calculated by putting up and down fluctuations together. This indicator is to calculate separately the upward volatility and the downward volatility, which can better help you study the market. 2. Indicator description          There are two modes for the calculation of this indicator, as shown in the f
30 USD
Snipeer2
Ignacio Agustin Mene Franco
Sniper2 , It has points of lines, with colors that are showing you an entrance, that work as support and resistance! green dotted lines green shows entry for sale, the red dotted lines show a buy entry, pay attention to the supports that work as a break to catch long candles in a longer period of time. works for forex all pairs works for synthetic indices all pairs ! indicator on sale!
40 USD
Os compradores deste produto também adquirem
ICT, SMC, SMART MONEY CONCEPTS, SMART MONEY, Smart Money Concept, Support and Resistance, Trend Analysis, Price Action, Market Structure, Order Blocks, BOS/CHoCH,   Breaker Blocks ,  Momentum Shift,   Supply&Demand Zone/Order Blocks , Strong Imbalance,   HH/LL/HL/LH,    Fair Value Gap, FVG,  Premium  &   Discount   Zones, Fibonacci Retracement, OTE, Buy Side Liquidity, Sell Side Liquidity, BSL/SSL Taken, Equal Highs & Lows, MTF Dashboard, Multiple Time Frame, BigBar, HTF OB, HTF Market Structur
65 USD
Este é um indicador para MT5 que fornece sinais precisos para entrar em uma negociação sem redesenhar. Ele pode ser aplicado a qualquer ativo financeiro: forex, criptomoedas, metais, ações, índices. Ele fornecerá estimativas bastante precisas e informará quando é melhor abrir e fechar um negócio. Assista o vídeo (6:22) com um exemplo de processamento de apenas um sinal que compensou o indicador! A maioria dos traders melhora seus resultados de negociação durante a primeira semana de negociação c
125 USD
AW Trend Predictor MT5
Alexander Nechaev
5 (33)
A combinação de níveis de tendência e quebra em um sistema. Um algoritmo de indicador avançado filtra o ruído do mercado, determina a tendência, os pontos de entrada e os possíveis níveis de saída. Os sinais indicadores são registrados em um módulo estatístico, que permite selecionar as ferramentas mais adequadas, mostrando a eficácia do histórico do sinal. O indicador calcula as marcas Take Profit e Stop Loss. Manual e instruções ->   AQUI   / versão MT4 ->   AQUI Como negociar com o indicador
55 USD
Trend Screener Pro MT5
STE S.S.COMPANY
4.87 (38)
Indicador de tendência, solução única inovadora para negociação e filtragem de tendências com todos os recursos de tendências importantes construídos dentro de uma ferramenta! É um indicador multi-timeframe e multi-moedas 100% sem repintura que pode ser usado em todos os símbolos/instrumentos: forex, commodities, criptomoedas, índices e ações. O Trend Screener é um indicador eficiente que segue a tendência do indicador que fornece sinais de tendência de seta com pontos no gráfico. Os recursos qu
50 USD
Torne-se um Negociador Breaker e lucre com as mudanças na estrutura do mercado à medida que o preço reverte. O indicador de quebra de bloco de pedidos identifica quando uma tendência ou movimento de preço está chegando à exaustão e pronto para reverter. Ele o alerta sobre mudanças na estrutura do mercado, que normalmente ocorrem quando uma reversão ou uma grande retração está prestes a ocorrer. O indicador usa um cálculo proprietário que identifica rupturas e momento do preço. Toda vez que
49 USD
Matrix Arrow Indicator MT5
Juvenille Emperor Limited
5 (11)
O   Matrix Arrow Indicator MT5   é uma tendência única 10 em 1 seguindo um indicador multi-timeframe   100% sem repintura   que pode ser usado em todos os símbolos/instrumentos:   forex ,   commodities ,   criptomoedas ,   índices ,   ações .  O  Matrix Arrow Indicator MT5  determinará a tendência atual em seus estágios iniciais, reunindo informações e dados de até 10 indicadores padrão, que são: Índice de movimento direcional médio (ADX) Índice de canal de commodities (CCI) Velas clássicas de
75 USD
Owl Smart Levels MT5
Sergey Ermolov
5 (7)
Guia do Indicador   |  Estratégia  Owl Smart Levels  |   Versão MT4  |  Como instalar?   |   FAQ O Indicador Owl Smart Levels é um sistema de negociação completo dentro de um indicador que inclui ferramentas populares de análise de mercado, como fractais avançados de Bill Williams , Valable ZigZag que constrói a estrutura de onda correta do mercado e níveis de Fibonacci que marcam os níveis exatos de entrada no mercado e lugares para obter lucros. Para uma descrição detalhada do sistema de nego
97 USD
TPA True Price Action indicator reveals the true price action of the market makers through 100% non-repainting signals strictly at the close of a candle! TPA shows entries and re-entries, every time the bulls are definitely stronger than the bears and vice versa. Not to confuse with red/green candles. The shift of power gets confirmed at the earliest stage and is ONE exit strategy of several. There are available now two free parts of the TPA User Guide for our customers. The first "The Basics"
168 USD
Blahtech Supply Demand MT5
Blahtech Limited
4.45 (11)
Supply Demand uses previous price action to identify potential imbalances between buyers and sellers. The key is to identify the better odds zones, not just the untouched ones. Blahtech Supply Demand indicator delivers functionality previously unavailable on any trading platform. This 4-in-1 indicator not only highlights the higher probability zones using a multi-criteria strength engine, but also combines it with multi-timeframe trend analysis, previously confirmed swings and engulfing detecto
99 USD
Blahtech VWAP - Volume Weighted Average Price (VWAP) is the ratio of price to total volume. It provides an average price over a specified time interval.  Links [  Install  |  Update  |  Documentation   ] Feature Highlights Configurable VWAP Line Sessions, intervals, anchored or continuous Previous day settlement line Standard Deviation bands Alerts at bar close or real time Automatic Broker or Tick volumes Significantly reduced CPU usage Input Parameters Max Bars   - Restrict the number of
49 USD
XQ Indicator MT5
Marzena Maria Szmit
5 (1)
The signal conditions are a combination of three indicators, and XQ Forex Indicators only display  medium and long-term trends . The indicator's efficacy has been improved with the addition of a filter that blocks out false signals. The XQ Forex Indicator can be used on  FX pairs, CFDs, and Cryptocurrencies . There are two type of signals:  Buy or Sell and Big Long or Big Short It is possible to enable sending emails when a major trend-change signal is detected, as well as to display the alerts
149 USD
Advanced Supply Demand MT5
Bernhard Schweigert
4.36 (11)
Atualmente com 33% de desconto! A melhor solução para qualquer Trader Novato ou especialista! Este indicador é uma ferramenta de negociação exclusiva, de alta qualidade e acessível porque incorporamos uma série de recursos proprietários e uma nova fórmula. Com esta atualização, você poderá mostrar fusos horários duplos. Você não só será capaz de mostrar um TF mais alto, mas também mostrar ambos, o TF do gráfico, MAIS o TF mais alto: MOSTRANDO ZONAS ANINHADAS. Todos os traders de Oferta e Demanda
199 USD
MetaBands M5
Vahidreza Heidar Gholami
5 (2)
MetaBands utiliza algoritmos poderosos e únicos para desenhar canais e detectar tendências, a fim de fornecer aos traders pontos potenciais para entrar e sair de negociações. É um indicador de canal mais um indicador de tendência poderoso. Inclui diferentes tipos de canais que podem ser mesclados para criar novos canais simplesmente usando os parâmetros de entrada. O MetaBands usa todos os tipos de alertas para notificar os usuários sobre eventos de mercado. Recursos Suporta a maioria dos algori
129 USD
Trend Line Map Pro MT5
STE S.S.COMPANY
4.8 (5)
O indicador Trend Line Map é um complemento do Trend Screener Indicator. Ele funciona como um scanner para todos os sinais gerados pelo Trend screener (Trend Line Signals). É um Trend Line Scanner baseado no Trend Screener Indicator. Se você não tiver o Trend Screener Pro Indicator, o Trend Line Map Pro não funcionará. It's a Trend Line Scanner based on Trend Screener Indicator. If you don't have Trend Screener Pro Indicator,     the Trend Line Map Pro will not work . Acessando nosso Blog
50 USD
Auto Order Block with break of structure Detect Break of Structure , Mark Order Block and draw Entry / Stop and Risk to Reward lines when Order block is touch by price with Alert. Trend is Manually set to filter signals in a direction by a button on the chart. Entry / Stop and Risk to Reward lines can also be switch on / off by button on chart. Futures Auto Mark Break of Structure Auto Mark Order block Auto Mark higher time frame Point Of  Interest ( POI ) Popup Alert when BoS , Order block
55 USD
Introduction to X3 Chart Pattern Scanner X3 Cherart Pattern Scanner is the non-repainting and non-lagging indicator detecting X3 chart patterns including Harmonic pattern, Elliott Wave pattern, X3 patterns, and Japanese Candlestick patterns. Historical patterns match with signal patterns. Hence, you can readily develop the solid trading strategy in your chart. More importantly, this superb pattern scanner can detect the optimal pattern of its kind. In addition, you can switch on and off individu
250 USD
Italo Volume Indicator MT5
Italo Santana Gomes
4.69 (13)
BUY INDICATOR AND GET EA FOR FREE AS A BONUS + SOME OTHER GIFTS! ITALO VOLUME INDICATOR  is the best volume indicator ever created, and why is that? The Indicator works on all time-frames and assets, indicator built after 6 years of experience on forex and many other markets. You know many volume indicators around the internet are not complete, does not help, and it's difficult to trade, but the Italo Volume Indicator is different , the Italo Volume Indicator shows the wave volume, when market
65 USD
Introduction to EFW Analytics EFW Analytics was designed to accomplish the statement "We trade because there are regularities in the financial market". EFW Analytics is a set of tools designed to maximize your trading performance by capturing the repeating fractal geometry, known as the fifth regularity in the financial market. The functionality of EFW Analytics consists of three parts. Firstly, Equilibrium Fractal Wave Index is an exploratory tool to support your trading logic to choose which r
200 USD
Desenhe automaticamente os níveis de apoio e resistência MAIS espaços de velas de propulsão no seu gráfico, para que possa ver para onde é provável que o preço se dirija a seguir e/ou potencialmente inverta. Este indicador foi concebido para ser utilizado como parte da metodologia de negociação de posições ensinada no meu website (The Market Structure Trader) e exibe informação chave para a segmentação e potenciais entradas. MT4 Version:  https://www.mql5.com/en/market/product/97246/ Existem
49 USD
O Support And Resistance Screener está em um indicador de nível para MetaTrader que fornece várias ferramentas dentro de um indicador. As ferramentas disponíveis são: 1. Screener de estrutura de mercado. 2. Zona de retração de alta. 3. Zona de retração de baixa. 4. Pontos de Pivô Diários 5. Pontos Pivot semanais 6. Pontos Pivot mensais 7. Forte suporte e resistência com base no padrão harmônico e volume. 8. Zonas de nível de banco. OFERTA POR TEMPO LIMITADO: O indicador de suporte e resistência
50 USD
Forex Master Pattern
Alberto Gauer Borrego
4.8 (10)
The Forex Master Pattern  is an alternative form of technical analysis that provides a framework which will help you to find and follow the hidden price pattern that reveals the true intentions of financial markets. This algorithm here does a good job detecting the Phase 1 of the Forex Master Pattern cycle, which is the contraction point (or Value).  On Phase 2 we get higher timeframe activation (also called Expansion), which is where price oscillates above and below the average price defined
49 USD
Setups 9 Larry Williams
Luigi Nunes Labigalini
Sinais de compra e venda baseados nas estratégias 9.1, 9.2, 9.3 e 9.4 de Larry Williams, popularizadas no Brasil pelo Palex, para reversões e continuações de tendência. Para entender a lógica de sinalização e operação de cada setup, por favor acesse: Setup 9.1:  https://www.mql5.com/pt/market/product/50986 Setup 9.2:  https://www.mql5.com/pt/market/product/52268 Setup 9.3:  https://www.mql5.com/pt/market/product/52269 Setup 9.4:  https://www.mql5.com/pt/market/product/52273 Avisos:  - Este
199 USD
Stargogs Spike Catcher
Lorenzo Edward Beukes
5 (6)
Stargogs Spike Catcher V3.11 This Indicator is Developed To milk the BOOM and CRASH indices . Send me Message if you need any help with the indicator.  CHECK OUT THE STARGOGS SPIKE CATCHER EA/ROBOT V3: CLICK HERE ALSO CHECK OUT SECOND TO NONEFX SPIKE CATCHER:   CLICK HERE STARGOGS SPIKE CATCHER V3.11 WHATS NEW! Brand New Strategy. This is the Indicator you need for 2023. The Indicator Gives you an Entry at a time when conditions are met and you should use TP & SL. New Trendline that changes col
100 USD
Introduction to Fractal Pattern Scanner Fractal Indicator refers to the technical indicator that makes use of the fractal geometry found in the financial market. Fractal Pattern Scanner is the advanced Fractal Indicator that brings the latest trading technology after the extensive research and development work in the fractal geometry in the financial market. The most important feature in Fractal Pattern Scanner is the ability to measure the turning point probability as well as the trend probabil
185 USD
Trend Chief mt5
Vladimir Stepanov
O Trend Chief é um algoritmo de indicador avançado que filtra o ruído do mercado, determina a tendência, os pontos de entrada e os possíveis níveis de saída. Use prazos mais curtos para scalping e prazos mais altos para swing trading. Trend Chief é perfeito para todos os símbolos Metatrader: moedas, metais, moedas criptográficas, ações e índices * Como usar o indicador Trend Chief: - Obtenha a tendência principal observando os gráficos diários e H4 - Se a tendência for de alta, vá para interva
45 USD
Legacy of Gann for MT5
Pavel Zamoshnikov
5 (2)
The indicator very accurately determines the levels of the possible end of the trend and profit fixing. The method of determining levels is based on the ideas of W.D.Gann, using an algorithm developed by his follower Kirill Borovsky. Extremely high reliability of reaching levels (according to K. Borovsky  - 80-90%) Indispensable for any trading strategy – every trader needs to determine the exit point from the market! Precisely determines targets on any timeframes and any instruments (forex, met
65 USD
MACD Intraday Trend PRO é um indicador desenvolvido por meio de uma adaptação feita do MACD original criado por Gerald Appel na década de 1960. Ao longo dos anos de negociação, observou-se que alterando os parâmetros do MACD com as proporções de Fibonacci alcançamos uma melhor apresentação da continuidade dos movimentos de tendência, sendo possível detectar de forma mais eficiente o início e o fim de uma tendência de preço. Devido à sua eficiência na detecção de tendências de preços, também é po
77 USD
Dark Power MT5
Marco Solito
4.83 (48)
Dark Power  is an Indicator for intraday trading. This Indicator is based on   Trend Following  strategy, also adopting the use of an histogram to determine the right power . We can enter in good price with this Indicator, in order to follow the   strong trend   on the current instrument. The histogram is calculated based on the size of the bars and two moving averages calculated on the histogram determine the direction of the signal Key benefits Easily visible take profit/stop loss lines Int
49 USD
O Indicador de Reversão ADR mostra rapidamente onde o preço está sendo negociado atualmente em relação ao seu intervalo médio diário normal. Você receberá alertas instantâneos via pop-up, e-mail ou push quando o preço exceder seu intervalo médio e níveis acima dele de sua escolha, para que você possa saltar rapidamente para retrocessos e reversões. O indicador desenha linhas horizontais no gráfico nos extremos médios do intervalo diário e também extensões acima daqueles níveis que têm probabili
49 USD
Royal Scalping Indicator M5
Vahidreza Heidar Gholami
5 (8)
Royal Scalping Indicator is an advanced price adaptive indicator designed to generate high-quality trading signals. Built-in multi-timeframe and multi-currency capabilities make it even more powerful to have configurations based on different symbols and timeframes. This indicator is perfect for scalp trades as well as swing trades. Royal Scalping is not just an indicator, but a trading strategy itself. Features Price Adaptive Trend Detector Algorithm Multi-Timeframe and Multi-Currency Trend Low
149 USD
Mais do autor
Grid Trade Panel
Dmitriy Sapegin
5 (4)
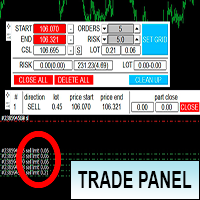
Торговая панель предназначена для установки сетки ордеров с различными параметрами на основных  FOREX валютных парах. Панель не предназначена для торговли фьючерсов, золота, нефти и других подобных инструментов! Только для валютных пар.  Имеет несколько основных функций по установке ордеров в заданном диапазоне и с заданным риском, закрытию части ордеров из сетки, переносом в безубыток, закрытие части по профиту на определённом уровне, а также отображает информацию по текущему риску и отображае
90 USD
Profile Map
Dmitriy Sapegin
5 (14)
Market Profile helps the trader to identify the behavior if major market players and define zones of their interest. The key feature is the clear graphical display of the range of price action, in which 70% of the trades were performed. Understanding of the location of volume accumulation areas can help traders increase the probability of success. The tool can be used as an independent system as well as in combination with other indicators and trading systems. this indicator is designed to suit
39 USD
HarleyBot
Dmitriy Sapegin
Торговая стратегия представляет собой "сеточную" технологию с элементами мартингейла.  Робот рассчитан на просадки в 700-800 пунктов без отката. Для торговли подойдут основные валютные пары, такие как EURUSD, GBPUSD, USDJPY, USDCHF, AUDUSD, USDCAD.  Общие настройки Разрешение торговли на продажу -    Разрешить | Запретить открывать Sell ордера и выставлять SellStop отложенные ордера. Разрешение открывать первый ордер - Разрешить | запретить боту самому открывать первый ордер Sell сетки. Зак
30 USD
Rectangle control
Dmitriy Sapegin
4 (1)
Rectangle Control простой индикатор который отображает на графике панель для рисования прямоугольников с различными настройками, будет удобен тем кто рисует на графике зоны поддержки, сопротивления. Прямоугольник можно нарисовать с заливкой или без, различной толщины и цвета. А также выбрать таймфрейм на котором нарисованный прямоугольник  будет отображаться. При нажатой кнопке алерт будет срабатывать оповещение (если прямоугольник находиться ниже цены на верхнем его краю, если прямоугольник нах
FREE
Утилита предназначена для приёма котировок из терминала МТ5 и МТ4 и открытие оффлайн графиков для дальнейшего анализа. Котировки передаются по тем символам которые находятся в "Обзоре рынка" в терминале МТ5.  Утилита служит исключительно для приёма котировок, не производит никаких торговых операций и не выводит ни какой информации на оффлайн графике. Передатчик котировок из МТ5:  https://www.mql5.com/ru/market/product/41628 Для отображение оффлайн графиков нужно сделай всё по инструкции: 1.   От
FREE
Grid Trade Panel MT5
Dmitriy Sapegin
5 (1)
Торговая панель предназначена для установки сетки ордеров с различными параметрами. Добавлено все что есть у версии для МТ4. Предназначена для форекс счетов с хеджированием. Имеет несколько основных функций по установке ордеров в заданном диапазоне и с заданным риском, закрытию части ордеров из сетки, переносом в безубыток, закрытие части по профиту на определённом уровне, а также отображает информацию по текущему риску и отображает все сетки которые были выставлены по определённой паре при этом
90 USD
Торговая панель предназначена для установки сетки ордеров с различными параметрами. Предназначена для торговли акциями, где в одном лоте будет одна акция, на неттинговых видах счетов. Панель не дает дает открывать сетки на продажу, если уже стоят ордера на покупку и наоборот, есть возможность только управления текущей сеткой.  Имеет несколько основных функций по установке ордеров в заданном диапазоне и с заданным риском, закрытию части ордеров из сетки, переносом в безубыток, закрытие части по п
90 USD
Filtro:
Mikhail Morozov
145
Mikhail Morozov 2018.08.08 10:22 
 

Здравствуйте! В индикаторе не разбираюсь. Но на графике выглядит очень стильно профессионально и красиво, радует глаз. Купил и всем рекомендую...

vazelin2x5
34
vazelin2x5 2018.07.01 20:10 
 

Всем брать!!! Спасибо за труды!.

Compositeman
20
Compositeman 2018.06.26 09:40 
 

Добавьте возможность изменять цвет и, если можно, толщину левой вертикальной линии (в свойствах индикатора на вкладке "цвета" некая настройка есть, но она не изменяется).

По умолчанию в текущей версии (1.2) цвет у этой линии белый/серебристый (а не синий как на скриншотах) и при использовании на графиках со светлым фоном ее вообще не видно.

Space
27
Space 2018.06.21 14:34 
 

Ура! Спасибо!

Aleksandr Veselov
136
Aleksandr Veselov 2018.05.28 10:49 
 

Наконец-то, спасибо!

При перетаскивании индикатора на график берется какое-то небольшое к-во баров, нужно растаскивать вручную. При изменении периода также нужно вручную тащить заново. Пожелание: дать возможность сохранять настройки по умолчанию и каждый раз их выставлять.

Responder ao comentário
Versão 1.35 2019.01.29
При смене ТФ профиль принимает диапазон в 100 баров и перемещается на нулевой бар.
Versão 1.34 2019.01.25
При смене тайм фрейма панель не меняет свое состояние (свернута/развернута).
При набрасывании индикатора на график берется 100 баров по умолчанию, но это не является минимальным ограничением теперь и границы можно сдвигать вплоть до 20 баров.
При набрасывании графика можно установить будет ли будет ли отображаться панель или нет.
Versão 1.32 2019.01.22
Добавлена панель управления.
Добавлен новый режим отображения профиля.
Изменен способ настройки режима профиля.
Появилась возможность задавать цвет для обоих границ/линий и устанавливать минимальное количество баров между ними.

Входные параметры
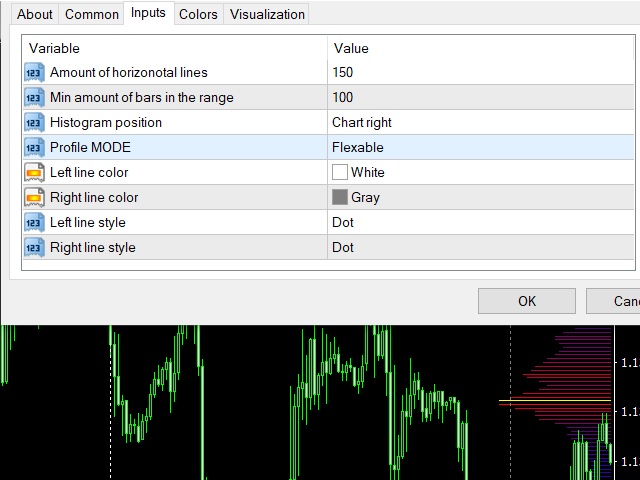
Amount of horizontal lines - количество горизонтальных линий в профиле
Min amount of bars in the range - минимально количество между границами/линиями
Histogram position:
Right inside - профиль отображается между границами/линиями и зафиксирован справа.
Chart right - профиль отображается от правой границы на графике
Profile MODE:
Strict - в этом режиме нет возможности двигать правую границу, она привязана к последнему бару. Так же нет возможности переносить профиль на любую дату и панели управления.
Flexable - в этом режиме можно передвигать любую границу профиля и задавать даты в панели управления.
Left line style - стиль левой границы/линии
Left line color - цвет левой границы/линии
Right line style - стиль правой границы/линии
Right line color - цвет правой границы/линии

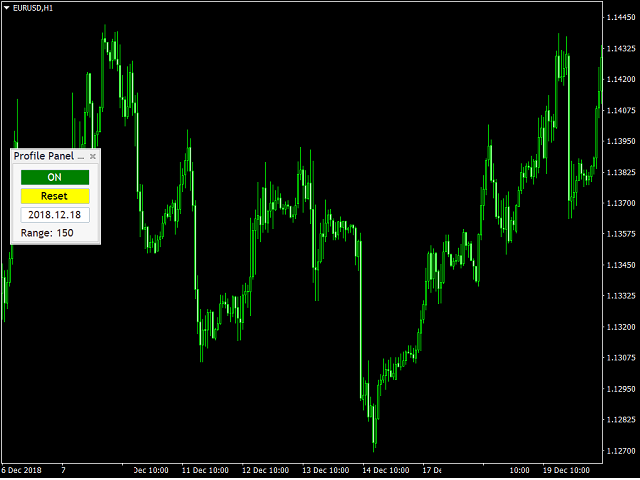
Панель управления
ON/OFF - кнопка включает/выключает отображение профиля на графике
Reset - сбрасывает настройки профиля на настройки по умолчанию.
Date box - отображает число правой границы/линии. Можно указать необходимую дату, тогда правая граница/линия профиля будет перемещена на указанную дату.
Range - показывает количество баров между линиями/границами.
Versão 1.2 2018.06.05
Fixes:
Changing the chart timeframe caused the predefined time range to be changed to the default range.
Changed the line colors and styles for better readability.