Dashboard RSI Multicurrency
- Indicadores
- Taras Slobodyanik
- Versão: 5.20
- Atualizado: 14 março 2024
- Ativações: 10
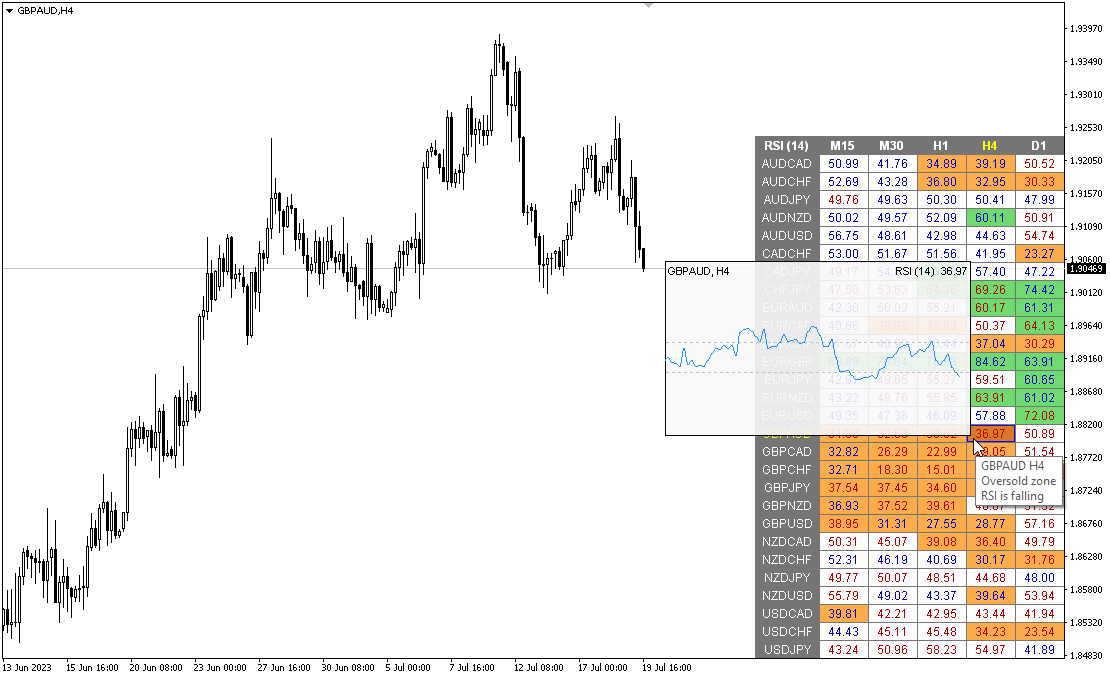
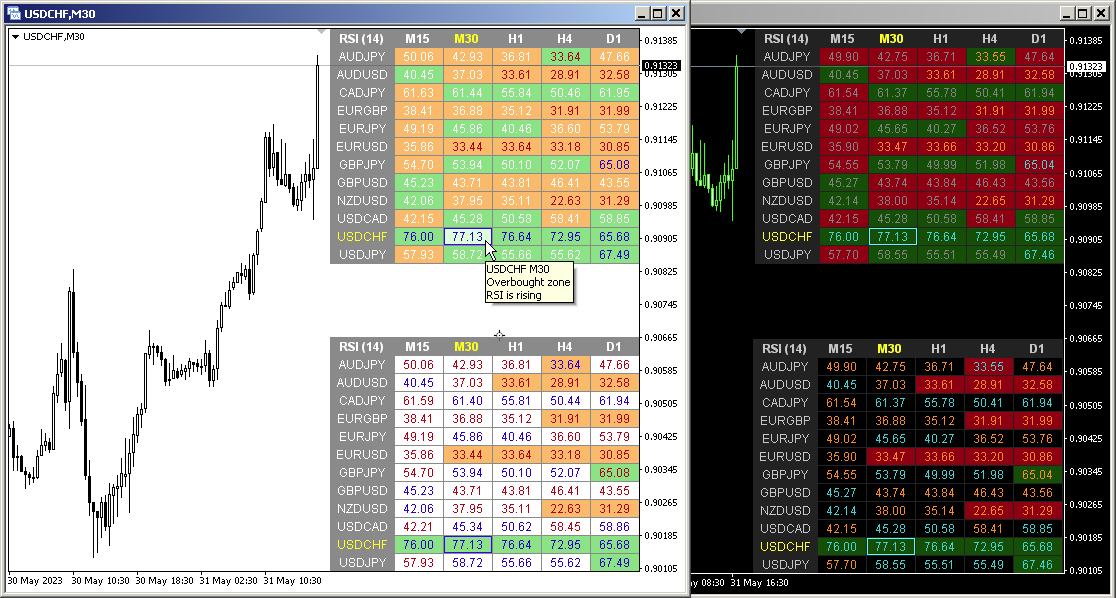
Multicurrency and multi timeframe modification of the Relative Strength Index (RSI) indicator. You can specify any desired currencies and timeframes in the parameters. Also, the panel can send notifications when crossing overbought and oversold levels. By clicking on a cell with a period, this symbol and period will be opened. This is MTF Scanner.
The key to hide the dashboard from the chart is "D" by default.
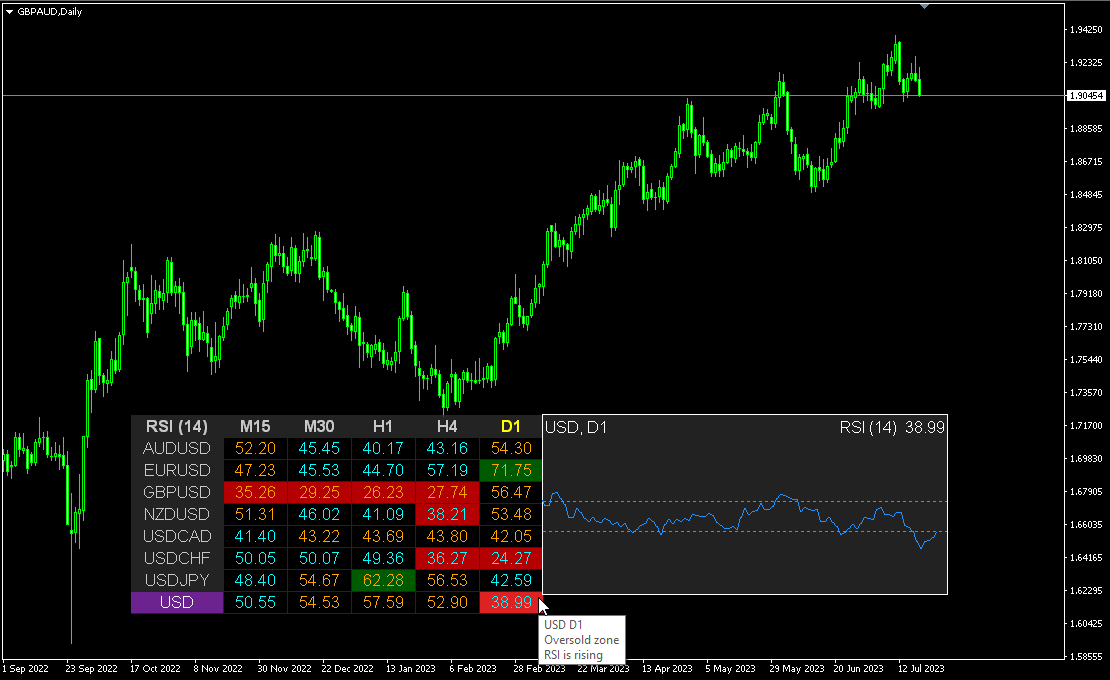
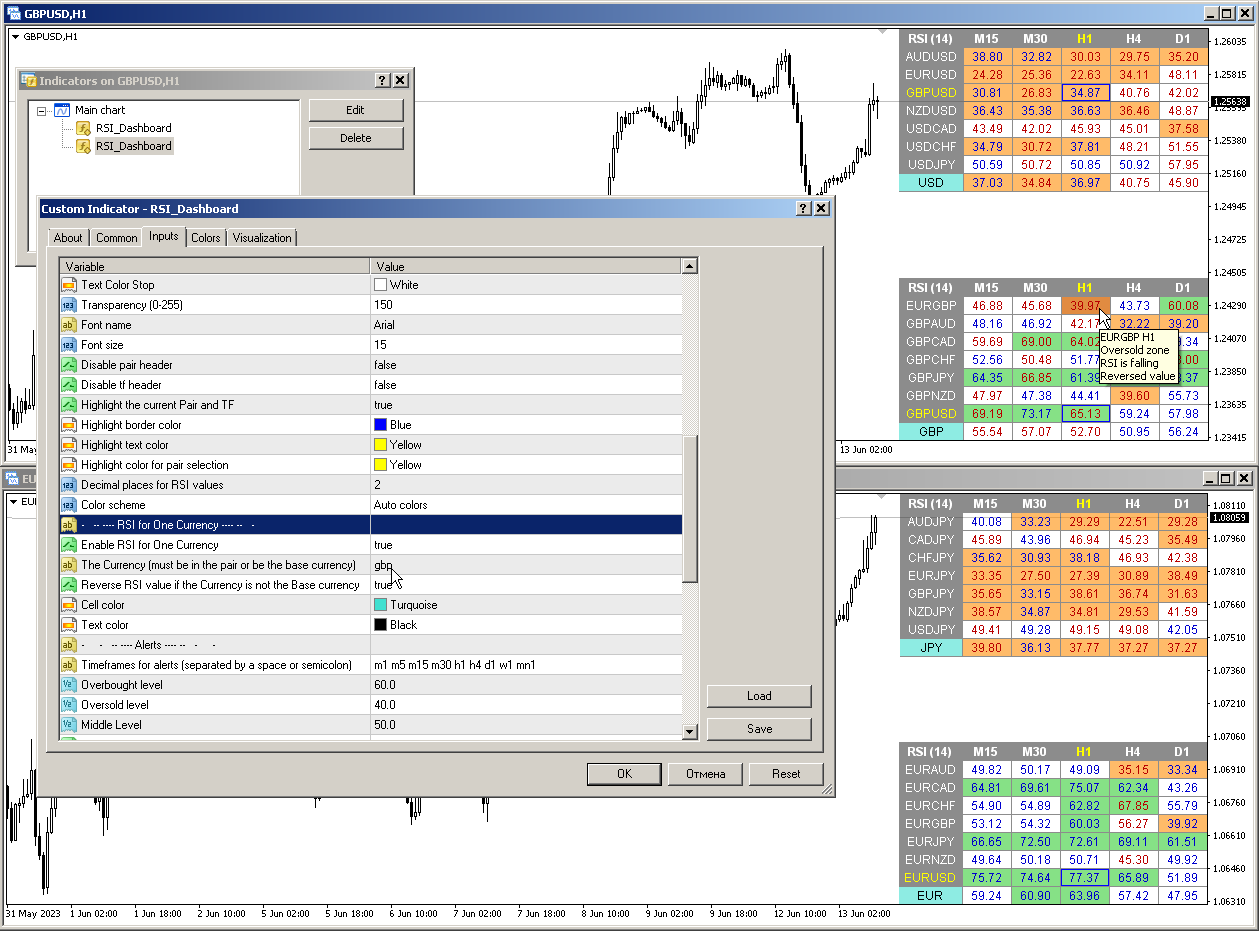
Similar to the Currency Strength Meter, the Dashboard can automatically select pairs containing the specified Currency or those pairs that have this Currency as the base. The indicator will also calculate the RSI for this Currency on a separate line.
Parameters
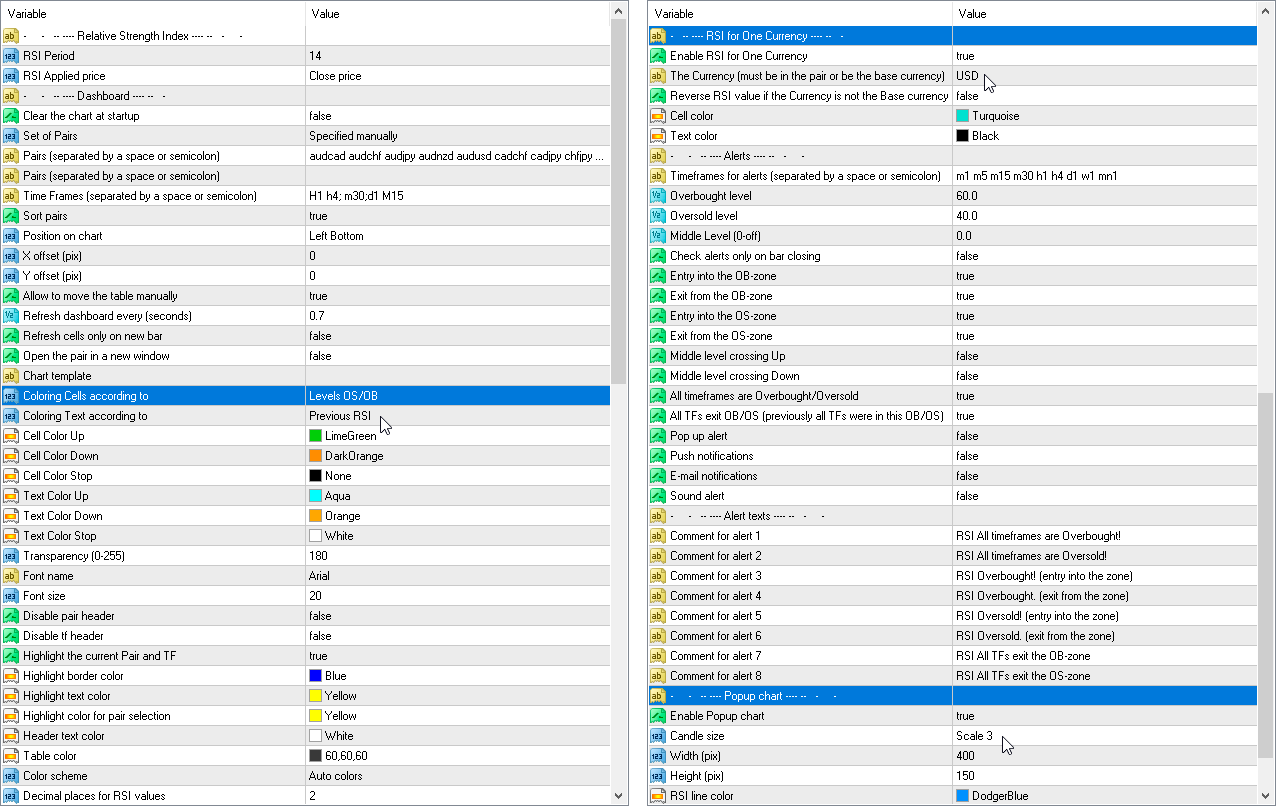
RSI Period — averaging period.RSI Applied price — price type.
Clear the chart at startup — clear the chart at startup.
Set of Pairs — set of symbols
— Market Watch — pairs from the "Market Watch".
— Specified manually — pairs specified manually, in the parameters "Pairs".
— Current pair — show only the current pair.
Time Frames (separated by a space or semicolon) — list of timeframes separated by spaces or semicolons (multi timeframe).
Sort pairs — sorting the list of pairs.
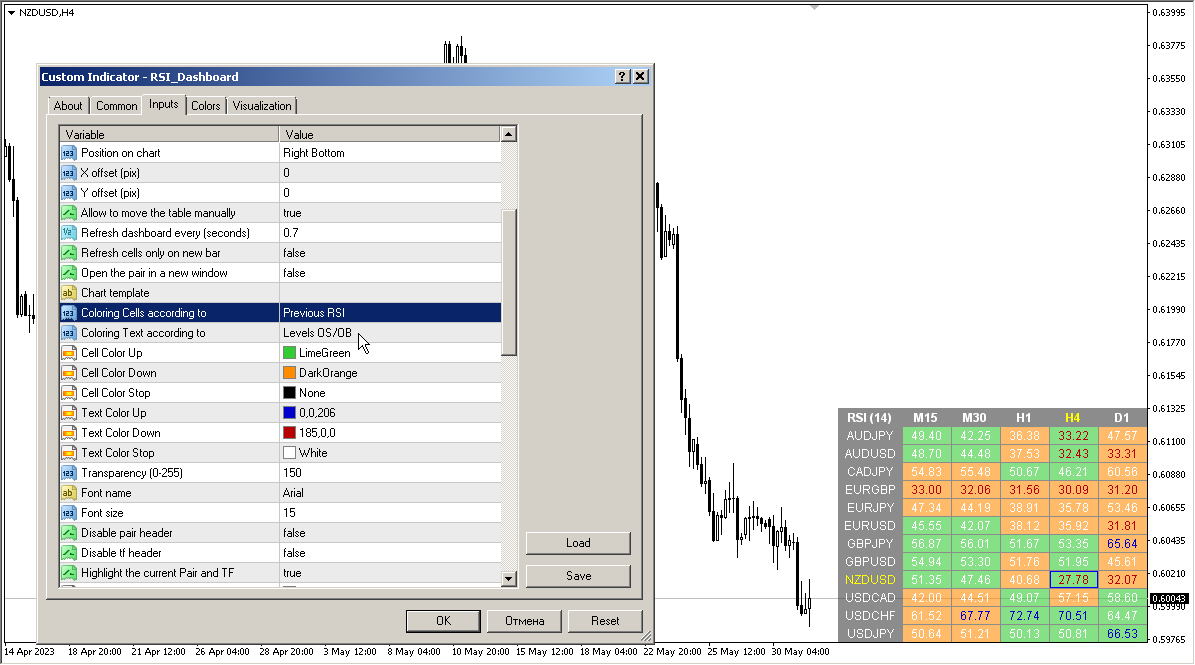
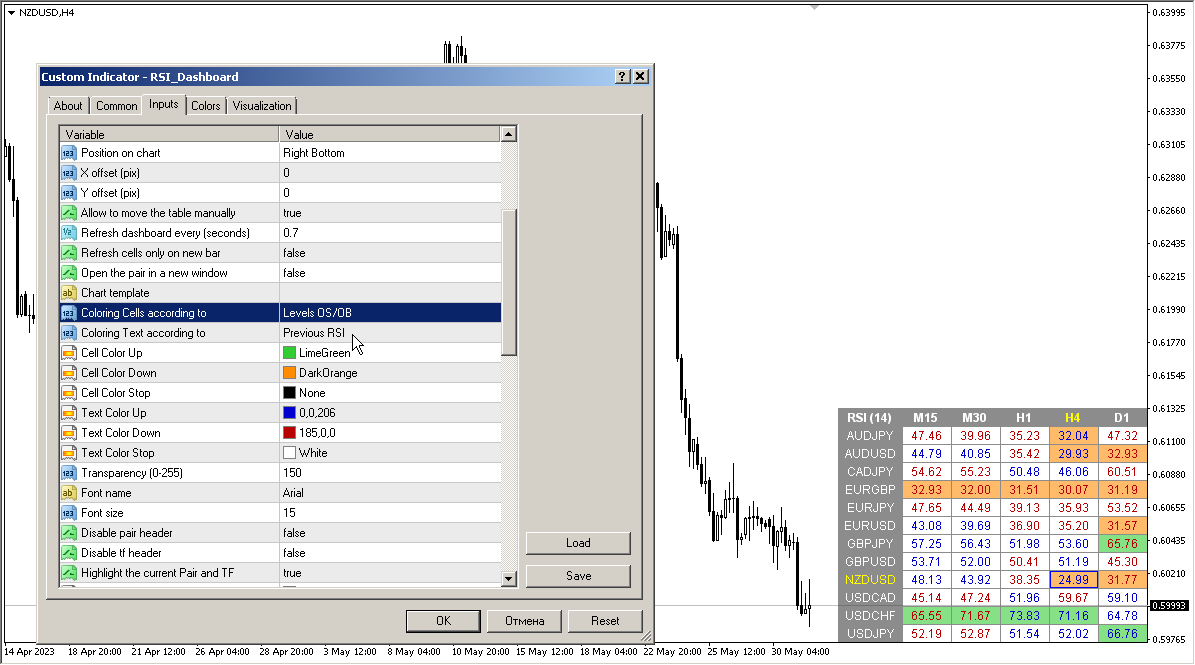
Position on chart — corner to display the panel on the chart.
X offset (pix) — shift the panel along the X axis;
Y offset (pix) — shift the panel along the Y axis;
Refresh dashboard every (seconds) — update period for all pairs and timeframes.
Refresh cells only on new bar — cell updates (and alerts) will only occur when a new bar appears.
Open the pair in a new window — open a symbol in a new chart window by clicking.
Chart template — the name of the template for the chart, if the chart opens in a new window.
Coloring the cells according to the — paint the cells of the table according to the levels of overbought/oversold or according to the direction of the previous candle.
Color Up — cell color if the indicator increases.
Color Down — cell color if the indicator decreases.
Color Stop — cell color if the indicator does not change.
Transparency (0-255) — transparency of the panel.
Font name — font name.
Font size — font size.
Alerts
Timeframes for alerts (separated by a space or semicolon) — list of periods for which the alert will be sent (separated by a space or semicolon).
Overbought level — overbought level for alerts.
Oversold level — oversold level for alerts.
Middle Level
Check alerts only on bar closing — check level crossing only after bar closing.
Push notifications — push notification.
E-mail notifications — e-mail notification.
Sound alert — sound alert.
Timeframes for alerts (separated by a space or semicolon) — list of periods for which the alert will be sent (separated by a space or semicolon).
Overbought level — overbought level for alerts.
Oversold level — oversold level for alerts.
Middle Level
Check alerts only on bar closing — check level crossing only after bar closing.
Entry into the OB-zone
Exit from the OB-zone
Entry into the OS-zone
Exit from the OS-zone
Middle level crossing Up
Middle level crossing Down
Alert when RSI direction changes
All timeframes are Overbought/Oversold
All TFs exit OB/OS (previously all TFs were in this OB/OS)
Pop up alert — pop-up alert.Push notifications — push notification.
E-mail notifications — e-mail notification.
Sound alert — sound alert.


TARAS is the "KING OF THE DASHBOARDS", not even close! Responds promptly and professionally to any inquiries and takes into consideration your request / suggestion if it will improve the indicator. Very clever features with a robust alert system. His Heiken Ashi Dash is equally superb. This cat is not your average Joe! THANKS!