Horizontal Channel Alert with Fibo
- Indicadores
- Yurij Izyumov
- Versão: 1.2
- Atualizado: 26 novembro 2021
- Ativações: 20
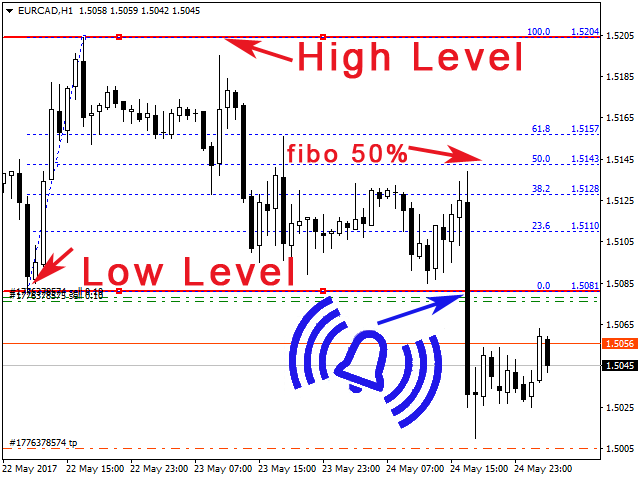
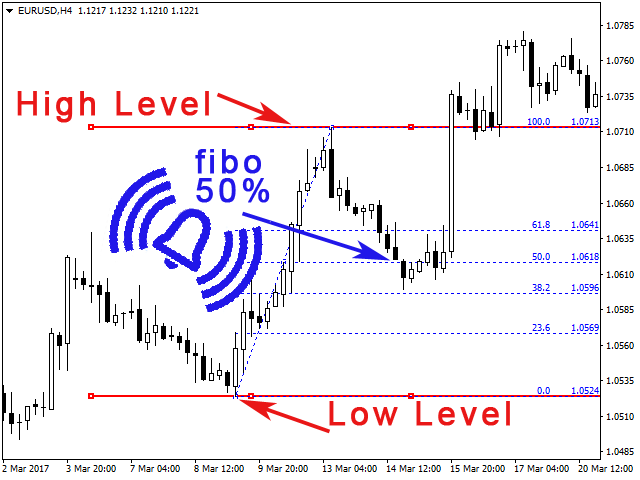
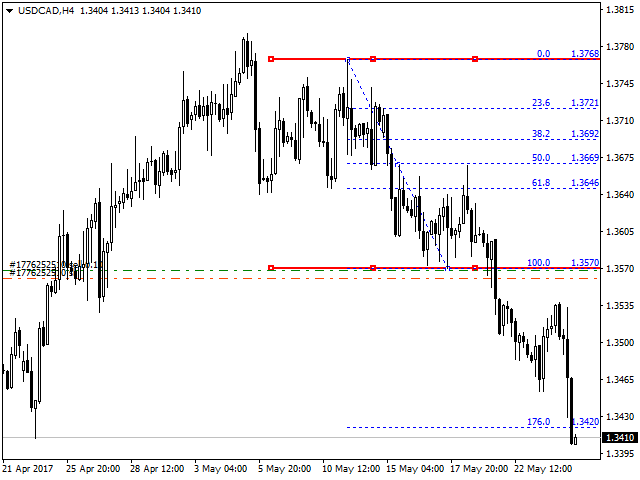
The indicator trades during horizontal channel breakthroughs. It searches for prices exceeding extreme points and defines targets using Fibo levels.
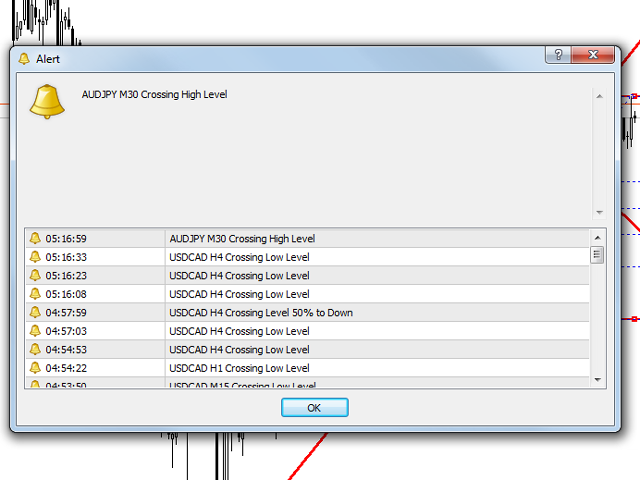
The indicator allows you to create a horizontal channel between the necessary extreme points in visual mode quickly and easily. It automatically applies Fibo levels to these extreme points (if the appropriate option is enabled in the settings). Besides, when one of the extreme points and/or Fibo levels (50%) is exceeded, the indicator activates a sound alert and shows a message or sends a push notification to your mobile terminal (if the appropriate option is enabled in the settings). If you are interested in an indicator with customizable levels and alerts, have a look at Horizontal Channel Alert with Custom Fibo.
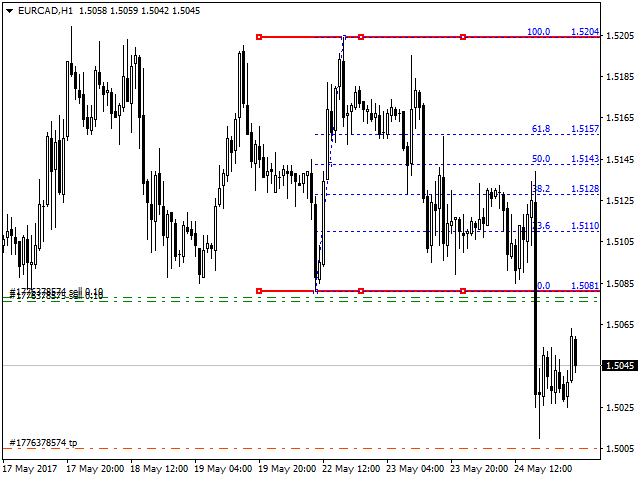
Horizontal Channel Alert with Fibo is able to plot channels both at High/Low and Open/Close prices. The channel is automatically attached to prices. The channel area (Channel Length) can be expanded or reduced directly on a chart. It is also possible to draw horizontal and Fibo levels successively on timeframes that you need without erasing the levels of the previous timeframes.
Attention!
- To move the channel to the left or right without changing its size, drag the central segment of the channel's upper or lower part.
- To lengthen or shorten the channel, drag the left or right edge of its top or bottom part to the desired location and release the line.
- If you drag the channel edge and the line is visually distorted, simply click anywhere on the chart to straighten the channel and the Fibo levels.
Settings
- Color Channel - horizontal channel color;
- Color Fibo lines - color of Fibonacci lines;
- Channel Width - horizontal channel line width;
- Channel Length, bars - channel length (default - in bars);
- Alerts – enable/disable all sound alerts;
- Send Notifications - enable/disable sending push notifications to your mobile terminal. Make sure to configure MetaQuotes ID in the terminal settings (details);
- Alert Crossing High level - enable high extreme point crossing alert;
- Alert Crossing Low level - enable low extreme point crossing alert;
- Alert Fibo 50% - enable Fibo 50% reaching/crossing alert;
- Limit Alerts - limit the number of signals. After reaching the limit, the signals are stopped;
- Channel ray - plot the channel as rays;
- Draw Fibonacci - attach Fibo levels to the channel automatically;
- Price Mode - channel plotting mode: High/Low or Open/Close;
- Delete channels from other TF - delete channels and Fibo levels of the previous timeframe when switching to another one.
If Delete channels from other TF=false, previous channels remain, while the new one is added to a selected timeframe when switching timeframes. If Delete channels from other TF=true (default), previous channels are removed and the new one is plotted on a new timeframe during the timeframes switching.
The indicator is in active development, therefore, let me know if you need alerts for other Fibo levels.


It is very well-crafted, and I like it a lot. I think it is highly effective. I recommend giving it a try. Improvement Request 1: I would like to have an ON/OFF button for recovering when something is accidentally deleted. Improvement Request 2: The logo display is unnecessary and makes it difficult to see. Please keep it within the parameter screen.