• Visão global
  • Comentários
  • Discussão (5)
  • O que há de novo

SmartMA

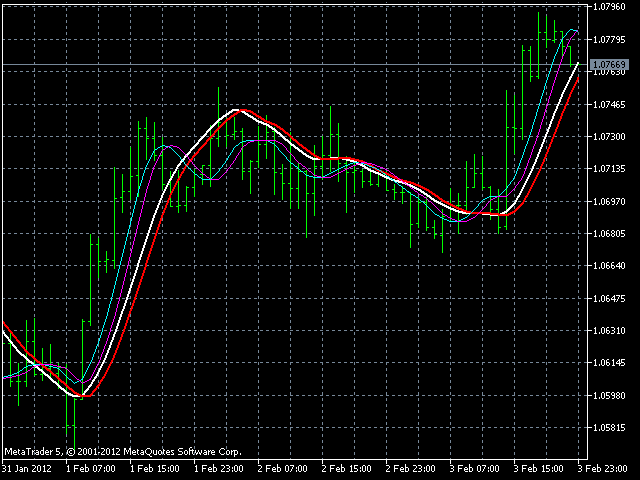
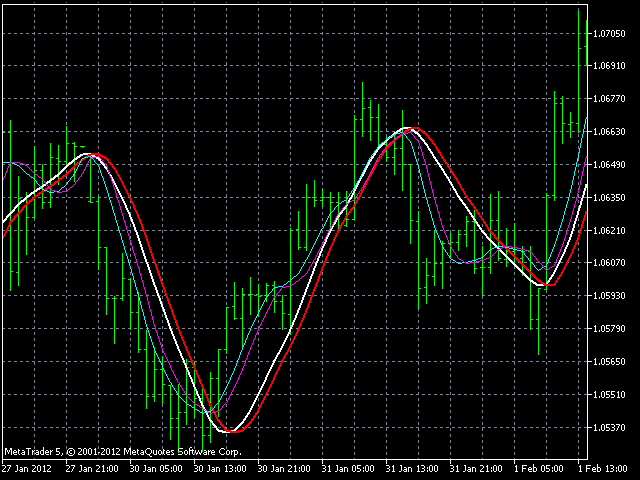
 This is a trend indicator, as you can see here.

When the white line is above the red, it means a bull market.

Conversely, the white line below the red line is a bear market.

This index is suitable for long - term trading and is suitable for most trading varieties.

--------------------------------------------------------------------------------------------


Produtos recomendados
PZ Trend Trading MT5
PZ TRADING SLU
3.67 (3)
O Trend Trading é um indicador projetado para lucrar o máximo possível com as tendências que ocorrem no mercado, cronometrando retrocessos e rupturas. Ele encontra oportunidades de negociação analisando o que o preço está fazendo durante as tendências estabelecidas. [ Guia de instalação | Guia de atualização | Solução de problemas | FAQ | Todos os produtos ] Negocie mercados financeiros com confiança e eficiência Lucre com as tendências estabelecidas sem ser chicoteado Reconhecer retrocesso
This indicator is used to compare the relative strength of the trade on the chart against the other several selected symbols. By comparing the price movement of each traded variety based on the same base day, several trend lines of different directions can be seen, reflecting the strong and weak relationship between the several different traded varieties, so that we can have a clearer understanding of the market trend. For example, you can apply this indicator on a EurUSD chart and compare it
Trade history
Andriy Konovalov
5 (3)
The indicator plots charts of profit taken at the Close of candles for closed (or partially closed) long and short positions individually. The indicator allows to filter deals by the current symbol, specified expert ID (magic number) and the presence (absence) of a substring in a deal comment, to set the start time and the periodicity of profit reset (daily, weekly or monthly) to calculate the profit chart. The indicator also displays the floating (not fixed) profit of the opened positions at th
Gioteen Volatility Index (GVI) - your ultimate solution to overcoming market unpredictability and maximizing trading opportunities. This revolutionary indicator helps you in lowering your losing trades due to choppy market movements. The GVI is designed to measure market volatility, providing you with valuable insights to identify the most favorable trading prospects. Its intuitive interface consists of a dynamic red line representing the volatility index, accompanied by blue line that indicate
Indicador para determinar o plano e a tendência. Se o preço estiver abaixo de qualquer um dos dois histogramas e duas linhas (vermelha e azul), esta é uma zona de venda. Ao adquirir esta versão do indicador, versão MT4 para uma conta real e uma demo - como um presente (para receber, escreva-me uma mensagem privada)! Se o preço estiver acima de qualquer um dos dois histogramas e duas linhas (vermelha e azul), esta é uma zona de compra. Versão MT4: https://www.mql5.com/en/market/product/3793 Se
Was: $249  Now: $99   Market Profile defines a number of day types that can help the trader to determine market behaviour. A key feature is the Value Area, representing the range of price action where 70% of trading took place. Understanding the Value Area can give traders valuable insight into market direction and establish the higher odds trade. It is an excellent addition to any system you may be using. Inspired by Jim Dalton’s book “Mind Over Markets”, this indicator is designed to suit the
Indicator and Expert Adviser  EA Available in the comments section of this product. Download with Indicator must have indicator installed for EA to work. Mt5 indicator alerts for bollinger band and envelope extremes occurring at the same time. Buy signal alerts occur when A bullish candle has formed below both the lower bollinger band and the lower envelope  Bar must open and close below both these indicators. Sell signal occur when A bear bar is formed above the upper bollinger band and upp
HMA Trend Professional MT5
Pavel Zamoshnikov
4.4 (5)
Improved version of the free HMA Trend indicator (for MetaTrader 4) with statistical analysis. HMA Trend is a trend indicator based on the Hull Moving Average (HMA) with two periods. HMA with a slow period identifies the trend, while HMA with a fast period determines the short-term movements and signals in the trend direction. The main differences from the free version: Ability to predict the probability of a trend reversal using analysis of history data. Plotting statistical charts for analyz
Owl Smart Levels MT5
Sergey Ermolov
4.47 (36)
Versão MT4  |  FAQ O Indicador Owl Smart Levels é um sistema de negociação completo dentro de um indicador que inclui ferramentas populares de análise de mercado, como fractais avançados de Bill Williams , Valable ZigZag que constrói a estrutura de onda correta do mercado e níveis de Fibonacci que marcam os níveis exatos de entrada no mercado e lugares para obter lucros. Descrição detalhada da estratégia Instruções para trabalhar com o indicador Consultor de negociação Owl Helper Chat privado d
Antes de tudo, vale ressaltar que esta Ferramenta de Negociação é um Indicador Não Repintante, Não Redesenhante e Não Atrasado, o que a torna ideal para negociação profissional. O Indicador de Conceitos de Ação de Preço Inteligente é uma ferramenta muito poderosa tanto para traders novos quanto experientes. Ele combina mais de 20 indicadores úteis em um único, combinando ideias avançadas de negociação como Análise do Trader do Círculo Interno e Estratégias de Negociação de Conceitos de Dinhei
A machine translation from the English product description was used. We apologize for possible imprecisions. Foi utilizada uma tradução automática da descrição do produto em inglês. Pedimos desculpas por possíveis imprecisões. Um sistema de visualização para padrões de ação de preço de velas favoritas. Uma vez anexado, o indicador marcará automaticamente os próximos padrões no gráfico: Barra Pinóquio  - uma barra de corpo pequeno com um 'nariz' longo, padrão reverso muito conhecido; Barra intern
Provided Trend is a complex signal formation indicator. As a result of the work of internal algorithms, you can see only three types of signals on your chart. The first is a buy signal, the second is a sell signal, and the third is a market exit signal. Options: CalcFlatSlow - The first parameter that controls the main function of splitting the price chart into waves. CalcFlatFast - The second parameter that controls the main function of splitting the price chart into waves. CalcFlatAvg - Par
Indicador único que implementa uma abordagem profissional e quantitativa para significar negociação de reversão. Ele capitaliza o fato de que o preço desvia e retorna à média de maneira previsível e mensurável, o que permite regras claras de entrada e saída que superam amplamente as estratégias de negociação não quantitativas. [ Installation Guide | Update Guide | Troubleshooting | FAQ | All Products ] Sinais de negociação claros Incrivelmente fácil de negociar Cores e tamanhos personalizáveis
Your Trend Friend
Luigi Nunes Labigalini
A tendência é sua amiga! Veja a cor do indicador e faça suas operações nessa direção. Ele não repinta. Ou seja, depois que cada candle se fecha, a cor dele é definitiva e não irá se alterar. Você pode focar em movimentos mais curtos e rápidos ou tendências mais longas, basta testar o que melhor se encaixa no seu operacional de acordo com o ativo e tempo gráfico usado. Altere o parâmetro de entrada "Length" e o indicador irá se adaptar automaticamente (quanto maior ele for, maior a tendência a
Trend Master Chart MT5
Frederic Jacques Collomb
5 (1)
Trend Master Chart é o indicador de tendência que você precisa. Ele se sobrepõe ao gráfico e usa codificação de cores para definir diferentes tendências/movimentos do mercado. Ele usa um algoritmo que combina duas médias móveis e osciladores diferentes. Os períodos desses três elementos são modificáveis. Funciona em qualquer período de tempo e em qualquer par. Num relance você será capaz de identificar uma tendência ascendente ou descendente e os diferentes pontos de entrada nesta tendência.
FREE
O nível Premium é um indicador único com mais de 80% de precisão nas previsões corretas! Este indicador foi testado pelos melhores Especialistas em Negociação por mais de dois meses! O indicador do autor você não encontrará em nenhum outro lugar! A partir das imagens você pode ver por si mesmo a precisão desta ferramenta! 1 é ótimo para negociar opções binárias com um tempo de expiração de 1 vela. 2 funciona em todos os pares de moedas, ações, commodities, criptomoedas Instruções:
TrendDetect
Pavel Gotkevitch
The Trend Detect indicator combines the features of both trend indicators and oscillators. This indicator is a convenient tool for detecting short-term market cycles and identifying overbought and oversold levels. A long position can be opened when the indicator starts leaving the oversold area and breaks the zero level from below. A short position can be opened when the indicator starts leaving the overbought area and breaks the zero level from above. An opposite signal of the indicator can
Volality Index scalper indicator  Meant for Volality pairs such as Volality 10, 25, 50, 75 and 100 The indicator works on all timeframes from the 1 minute to the monthly timeframe the indicator is non repaint the indicator has 3 entry settings 1 color change on zero cross 2 color change on slope change 3 color change on signal line cross Orange line is your sell signal Blue line is your buy signal.
Introduction to Chart Pattern MT Chart Pattern MT is a chart pattern scanner to detect the triangle pattern, falling wedge pattern, rising wedge pattern, channel pattern and so on. Chart Pattern MT uses highly sophisticated chart pattern detection algorithm. However, we have designed it in the easy to use with intuitive user interface. Chart Pattern MT will show all the patterns in your chart in the most efficient format for your trading. You do not have to do tedious manual pattern detection an
US30NinjaMT5
Satyaseelan Shankarananda Moodley
US30 Ninja is a 5 minute scalping indicator that will let know you when there is a trade set up (buy or sell). Once the indicator gives the trade direction, you can open a trade and use a 30 pip stop loss and a 30 pip to 50 pip take profit. Please trade at own own risk. This indicator has been created solely for the US30 market and may not yield positive results on any other pair. 
For a trader, trend is our friend. This is a trend indicator for MT5, can be used on any symbol. just load it to the terminal and you will see the current trend. green color means bullish trend and red means bearlish trend. you can also change the color by yourself when the indicator is loaded to the MT5 terminal the symbol and period is get from the terminal automaticly. How to use: I use this trend indicator on 2 terminals with different period  for the same symbol at same time. for example M5
Este indicador mostra uma combinação de velas com base em dodge, Dodge e pin bar. A lógica do padrão é ficar do lado da força, depois da incerteza. O indicador é universal e útil para negociação de Opções Binárias, Forex, ETF, criptomoeda, ações. O indicador suporta prazos de M5 a MN, incluindo TF não padrão apresentado em MT5.(M5,M6,M10,M12, M15, M20, M30, H1, H2, H3, H4, H6, H8, H12, D1, W1, MN). A capacidade de ativar e desativar o TF foi implementada. Alertas sonoros e Push. МТ4 https://www.
O indicador mostra padrões harmônicos no gráfico   sem repintar   com o mínimo de atraso possível. A busca por topos de indicadores é baseada no princípio de onda de análise de preços. As configurações avançadas permitem que você escolha parâmetros para seu estilo de negociação. Na abertura de uma vela (barra), quando um novo padrão é formado, uma seta da direção provável do movimento do preço é fixada, a qual permanece inalterada. O indicador reconhece os seguintes padrões e suas variedades: AB
Golden Spikes Detector
Batsirayi L Marango
5 (1)
Golden Spikes Detector Este indicador é baseado em uma estratégia avançada principalmente para picos de negociação nos índices Boom e Crash. Algoritmos complexos foram implementados para detectar apenas entradas de alta probabilidade. Ele alerta sobre possíveis entradas de compra e venda. Para negociar picos na corretora Deriv ou Binária, receba apenas os alertas Buy Boom e Sell Cash. Ele foi otimizado para ser carregado em um período de 5 minutos, embora a análise de vários períodos de tempo se
Binary Options Assistant (BOA) Multi Currency Dashboard for Binary Options (MT5) . You can use any of the BOA Signals Indicators with the dashboard. Just change the BOA Signals Indicator Name in the dashboard settings to the indicator you want to get signals from. For example: CHILL. BLAZE:  BOA_BLAZE_Indicator_v1   Strategy :   BLW Online Trading Binary Options Strategy (3 Moving Average) LAVA:  BOA_LAVA_Indicator_v1   Strategy:   Lady Trader Binary Options Strategy (Bollinger Bands & Stoc
AW Candle Patterns
AW Trading Software Limited
O indicador AW Candle Patterns é uma combinação de um indicador de tendência avançado combinado com um poderoso scanner de padrão de vela. É uma ferramenta útil para reconhecer e destacar os trinta padrões de velas mais confiáveis. Além disso, é um analisador de tendências atual baseado em barras coloridas com       plug-in painel de tendência multi-timeframe que pode ser redimensionado e posicionado. Uma capacidade única de ajustar a exibição de padrões dependendo da filtragem de tendências. Va
The best time to trade Using this Indicator is when the time reach exactly hour,half,45 minutes,15 minutes and sometimes 5 minutes.. This indicators is helpful to those who trade boom and crash indecies.How to read this indicator first you'll see Blue allow and Red allow all these allows used to indicate or to detect the spike which will happen so the allow happens soon before the spike happen.This indicator works properly only in boom and crash trading thing which you have to consider when
PipFinite Trend PRO MT5
Karlo Wilson Vendiola
4.87 (664)
Breakthrough Solution For Trend Trading And Filtering With All Important Features Built Inside One Tool! Trend PRO's smart algorithm detects the trend, filters out market noise and gives entry signals with exit levels. The new features with enhanced rules for statistical calculation improved the overall performance of this indicator. Important Information Revealed Maximize the potential of Trend Pro, please visit www.mql5.com/en/blogs/post/713938 The Powerful Expert Advisor Version Automa
This is diamond! Diamond Pattern is based on Read The Market(RTM) concepts. The purpose of this model is to face the big players of the market (financial institutions and banks), As you know in financial markets, big traders try to fool small traders, but RTM prevent traders from getting trapped. This style is formed in terms of price candles and presented according to market supply and demand areas and no price oscillator is used in it. RTM concepts are very suitable for all kinds of inves
Your Pointer is no ordinary Forex channel. This corridor is built on the basis of the analysis of several candles, starting from the last one, as a result of which the extremes of the studied interval are determined. They are the ones who create the channel lines. Like all channels, it has a middle line as well as a high and low line. This channel is worth watching for its unusual behavior. The use of the Your Pointer indicator allows the trader to react in time to the price going beyond the bo
Os compradores deste produto também adquirem
Atomic Analyst MT5
Issam Kassas
4.22 (9)
Primeiramente, vale ressaltar que este Indicador de Negociação não repinta, não redesenha e não apresenta atrasos, tornando-o ideal tanto para negociação manual quanto automatizada. O Analista Atômico é um Indicador de Ação de Preço PA que utiliza a força e o momentum do preço para encontrar uma vantagem melhor no mercado. Equipado com filtros avançados que ajudam a remover ruídos e sinais falsos, e aumentam o potencial de negociação. Utilizando múltiplas camadas de indicadores complexos, o A
Primeiramente, vale ressaltar que este Sistema de Trading é um Indicador Não Repintado, Não Redesenho e Não Atrasado, o que o torna ideal tanto para o trading manual quanto para o automatizado. O "Sistema de Trading Inteligente MT5" é uma solução completa de trading projetada para traders novos e experientes. Ele combina mais de 10 indicadores premium e apresenta mais de 7 estratégias de trading robustas, tornando-o uma escolha versátil para diversas condições de mercado. Estratégia de Seguime
Quantum Trend Sniper
Bogdan Ion Puscasu
5 (36)
Apresentando       Quantum Trend Sniper Indicator   , o inovador Indicador MQL5 que está transformando a maneira como você identifica e negocia as reversões de tendência! Desenvolvido por uma equipe de traders experientes com experiência comercial de mais de 13 anos,       Indicador de Atirador de Tendência Quântica       foi projetado para impulsionar sua jornada de negociação a novos patamares com sua forma inovadora de identificar reversões de tendência com precisão extremamente alta. ***C
Trend Screener Pro MT5
STE S.S.COMPANY
4.88 (60)
Desbloqueie o poder da negociação de tendências com o indicador Trend Screener: sua solução definitiva de negociação de tendências, alimentada por lógica difusa e sistema de múltiplas moedas! Eleve sua negociação de tendências com o Trend Screener, o revolucionário indicador de tendências alimentado por lógica difusa. É um poderoso indicador de acompanhamento de tendências que combina mais de 13 ferramentas e recursos premium e 3 estratégias de negociação, tornando-o uma escolha versátil para to
Advanced Supply Demand MT5
Bernhard Schweigert
4.53 (15)
Atualmente com 33% de desconto! A melhor solução para qualquer Trader Novato ou especialista! Este indicador é uma ferramenta de negociação exclusiva, de alta qualidade e acessível porque incorporamos uma série de recursos proprietários e uma nova fórmula. Com esta atualização, você poderá mostrar fusos horários duplos. Você não só será capaz de mostrar um TF mais alto, mas também mostrar ambos, o TF do gráfico, MAIS o TF mais alto: MOSTRANDO ZONAS ANINHADAS. Todos os traders de Oferta e Demanda
RelicusRoad Pro MT5
Relicus LLC
4.81 (21)
Agora US $ 147 (aumentando para US $ 499 após algumas atualizações) - Contas ilimitadas (PCs ou Macs) Manual do usuário do RelicusRoad + vídeos de treinamento + acesso ao grupo de discórdia privado + status VIP UMA NOVA FORMA DE OLHAR PARA O MERCADO O RelicusRoad é o indicador de negociação mais poderoso do mundo para forex, futuros, criptomoedas, ações e índices, oferecendo aos traders todas as informações e ferramentas necessárias para se manterem rentáveis. Fornecemos análises técnica
FX Power MT5 NG
Daniel Stein
5 (4)
Receba a sua atualização diária do mercado com detalhes e screenshots através do nosso Morning Briefing aqui no mql5 e no Telegram ! O FX Power MT5 NG é a próxima geração do nosso medidor de força de moeda muito popular de longa data, o FX Power. E o que é que este medidor de força da próxima geração oferece? Tudo o que adorou no FX Power original MAIS Análise de força GOLD/XAU Resultados de cálculo ainda mais precisos Períodos de análise configuráveis individualmente Limite de cálculo personal
FX Volume MT5
Daniel Stein
4.94 (17)
Receba a sua atualização diária do mercado com detalhes e screenshots através do nosso Morning Briefing aqui no mql5 e no Telegram ! O Volume FX é o PRIMEIRO e ÚNICO indicador de volume que fornece uma visão REAL do sentimento do mercado do ponto de vista de um corretor. Ele fornece uma visão incrível de como os participantes do mercado institucional, como corretores, estão posicionados no mercado Forex, muito mais rápido do que os relatórios COT. Ver essas informações diretamente no seu gráfi
AW Trend Predictor MT5
AW Trading Software Limited
4.76 (54)
A combinação de níveis de tendência e quebra em um sistema. Um algoritmo de indicador avançado filtra o ruído do mercado, determina a tendência, os pontos de entrada e os possíveis níveis de saída. Os sinais indicadores são registrados em um módulo estatístico, que permite selecionar as ferramentas mais adequadas, mostrando a eficácia do histórico do sinal. O indicador calcula as marcas Take Profit e Stop Loss. Manual e instruções ->   AQUI   / versão MT4 ->   AQUI Como negociar com o indicador
Este é um indicador para MT5 que fornece sinais precisos para entrar em uma negociação sem redesenhar. Ele pode ser aplicado a qualquer ativo financeiro: forex, criptomoedas, metais, ações, índices. Ele fornecerá estimativas bastante precisas e informará quando é melhor abrir e fechar um negócio. Assista o vídeo (6:22) com um exemplo de processamento de apenas um sinal que compensou o indicador! A maioria dos traders melhora seus resultados de negociação durante a primeira semana de negociação c
TPSpro TRENDPRO  - is a trend indicator that automatically analyzes the market and provides information about the trend and each of its changes, as well as giving signals for entering trades without redrawing! The indicator uses each candle, analyzing them separately. referring to different impulses - up or down impulse. Exact entry points into transactions for currencies, crypto, metals, stocks, indices!  -  Version MT4                  DETAILED DESCRIPTION        /       TRADING SETUPS       
Apresentando       Quantum Breakout PRO   , o inovador Indicador MQL5 que está transformando a maneira como você negocia Breakout Zones! Desenvolvido por uma equipe de traders experientes com experiência comercial de mais de 13 anos,       Quantum Breakout PRO       foi projetado para impulsionar sua jornada comercial a novos patamares com sua estratégia de zona de fuga inovadora e dinâmica. O Quantum Breakout Indicator lhe dará setas de sinal em zonas de breakout com 5 zonas-alvo de lucro e
TrendDecoder Premium MT5
Christophe, Pa Trouillas
5 (1)
Identifica os intervalos e os próximos movimentos prováveis  |  Obter os primeiros sinais e a força das tendências  |  Obter saídas claras antes da reversão | Detetar os níveis Fibo que o preço irá testar   |  Indicador não repintável e não atrasado - ideal para trading manual e automatizado - adequado para todos os activos e todas as unidades de tempo $69   no lançamento - depois volta a >>   $149 Após a compra,   por favor contacte-me neste canal  para obter as definições recomendadas Versão
Bill Williams Advanced
Siarhei Vashchylka
5 (3)
Bill Williams Advanced is designed for automatic chart analysis using Bill Williams' "Profitunity" system. The indicator analyzes four timeframes at once. Manual (Be sure to read before purchasing) Advantages 1. Automatically analyzes the chart using the "Profitunity" system of Bill Williams. The found signals are placed in a table in the corner of the screen. 2. Equipped with a trend filter based on the Alligator indicator. Most of the system signals are recommended to be used only accordi
XQ Indicator MetaTrader 5
Marzena Maria Szmit
5 (1)
Step into the realm of Forex trading with confidence and precision using XQ, a cutting-edge Forex indicator designed to elevate your trading game to unprecedented heights. Whether you're a seasoned trader or just stepping into the world of currency exchange, XQ Forex Indicator empowers you with the insights and signals needed to make informed trading decisions. The signal conditions are a combination of three indicators, and XQ Forex Indicator only display  medium and long-term trends . The ind
Torne-se um Negociador Breaker e lucre com as mudanças na estrutura do mercado à medida que o preço reverte. O indicador de quebra de bloco de pedidos identifica quando uma tendência ou movimento de preço está chegando à exaustão e pronto para reverter. Ele o alerta sobre mudanças na estrutura do mercado, que normalmente ocorrem quando uma reversão ou uma grande retração está prestes a ocorrer. O indicador usa um cálculo proprietário que identifica rupturas e momento do preço. Toda vez que
Auto Order Block with break of structure based on ICT and Smart Money Concepts Futures Break of Structure ( BoS )             Order block ( OB )            Higher time frame Order block / Point of Interest ( POI )    shown on current chart           Fair value Gap ( FVG ) / Imbalance   ,  MTF      ( Multi Time Frame )    Volume Imbalance     ,  MTF          vIMB Gap’s Equal High / Low’s     ,  MTF             EQH / EQL Liquidity               Current Day High / Low           HOD /
IX Power MT5
Daniel Stein
5 (1)
O   IX Power   traz finalmente a precisão imbatível do FX Power para símbolos não-Forex. Determina com exatidão a intensidade das tendências a curto, médio e longo prazo nos seus índices, acções, mercadorias, ETFs e até criptomoedas favoritos. Pode   analisar tudo o que   o seu terminal tem para oferecer. Experimente e veja como   o seu timing melhora significativamente   quando negoceia. Características principais do IX Power Resultados de cálculo 100% precisos e sem repintura - para tod
The Volume by Price Indicator for MetaTrader 5 features Volume Profile and Market Profile TPO (Time Price Opportunity). Get valuable insights out of currencies, equities and commodities data. Gain an edge trading financial markets. Volume and TPO histogram bar and line charts. Volume Footprint charts. TPO letter and block marker charts including split structures. Versatile segmentation and compositing methods. Static, dynamic and flexible ranges with relative and/or absolute visualizations. Lay
TrendLine PRO MT5
Evgenii Aksenov
4.78 (49)
The Trend Line PRO indicator is an independent trading strategy. It shows the trend change, the entry point to the transaction, as well as automatically calculates three levels of Take Profit and Stop Loss protection Trend Line PRO is perfect for all Meta Trader symbols: currencies, metals, cryptocurrencies, stocks and indices Advantages of Trend Line PRO Never redraws its signals The possibility of using it as an independent strategy It has three automatic levels Take Profit and Stop Loss lev
ICT, SMC, SMART MONEY CONCEPTS, SMART MONEY, Smart Money Concept, Support and Resistance, Trend Analysis, Price Action, Market Structure, Order Blocks, BOS/CHoCH,   Breaker Blocks ,  Momentum Shift,   Supply&Demand Zone/Order Blocks , Strong Imbalance,   HH/LL/HL/LH,    Fair Value Gap, FVG,  Premium  &   Discount   Zones, Fibonacci Retracement, OTE, Buy Side Liquidity, Sell Side Liquidity, BSL/SSL Taken, Equal Highs & Lows, MTF Dashboard, Multiple Time Frame, BigBar, HTF OB, HTF Market Structure
Quantum Heiken Ashi PRO MT5
Bogdan Ion Puscasu
4.5 (8)
Apresentando o   Quantum Heiken Ashi PRO Projetadas para fornecer informações claras sobre as tendências do mercado, as velas Heiken Ashi são conhecidas por sua capacidade de filtrar o ruído e eliminar sinais falsos. Diga adeus às confusas flutuações de preços e olá para uma representação gráfica mais suave e confiável. O que torna o Quantum Heiken Ashi PRO verdadeiramente único é sua fórmula inovadora, que transforma os dados tradicionais de velas em barras coloridas fáceis de ler. As barras ve
Gartley Hunter Multi
Siarhei Vashchylka
5 (5)
Gartley Hunter Multi - An indicator for searching for harmonic patterns simultaneously on dozens of trading instruments and on all classic timeframes: (m1, m5, m15, m30, H1, H4, D1, Wk, Mn). Manual (Be sure to read before purchasing) | Version for MT4 Advantages 1. Patterns: Gartley, Butterfly, Shark, Crab. Bat, Alternate Bat, Deep Crab, Cypher 2. Simultaneous search for patterns on dozens of trading instruments and on all classic timeframes 3. Search for patterns of all possible sizes. Fr
A key element in trading is zones or levels from which decisions to buy or sell a trading instrument are made. Despite attempts by major players to conceal their presence in the market, they inevitably leave traces. Our task was to learn how to identify these traces and interpret them correctly. Reversal First Impulse levels (RFI)   -  Version MT4                  INSTRUCTIONS                 RUS                 ENG                         R ecommended to use with an indicator   -  TREND PRO  
Swing Scanner MT5
Reza Aghajanpour
5 (5)
**   All Symbols   x   All Time frames   scan just by pressing scanner button ** ***Contact me after the purchase to send you instructions and add you in "Swing scanner group" for sharing or seeing experiences with other users. Introduction: Swing Scanner   is the indicator designed to detect swings in the direction of the trend and possible reversal swings. The indicator studies several price and time vectors to track the aggregate trend direction and detects situations in which the market is o
Dark Power MT5
Marco Solito
4.84 (56)
Dark Power  is an Indicator for intraday trading. This Indicator is based on   Trend Following  strategy, also adopting the use of an histogram to determine the right power . We can enter in good price with this Indicator, in order to follow the   strong trend   on the current instrument. The histogram is calculated based on the size of the bars and two moving averages calculated on the histogram determine the direction of the signal Key benefits Easily visible take profit/stop loss lines Int
Golden Gate Algo MT5
James David Lane
4 (6)
40% DE DESCONTO PARA O NATAL! AUMENTO DE PREÇO PARA $250 EM 1º DE JANEIRO! Apresentando GoldenGate Entries: Uma Solução de Negociação de Ponta! Descubra uma abordagem revolucionária para a negociação com o GoldenGate Entries (GGE), um indicador avançado projetado para elevar sua experiência de negociação. O GGE oferece um conjunto abrangente de recursos para capacitar os usuários com precisão e confiança em suas decisões de negociação. Pares: Qualquer (FX - Commodities - Equities - Ações
PZ Swing Trading MT5
PZ TRADING SLU
5 (4)
Swing Trading é o primeiro indicador projetado para detectar oscilações na direção da tendência e possíveis oscilações de reversão. Ele usa a abordagem de negociação de linha de base, amplamente descrita na literatura de negociação. O indicador estuda vários vetores de preço e tempo para rastrear a direção da tendência agregada e detecta situações nas quais o mercado está sobrevendido ou sobrecomprado em excesso e pronto para corrigir. [ Guia de instalação | Guia de atualização | Solução de prob
Market Structure Patterns
Samuel Manoel De Souza
4.67 (18)
Market Structure Patterns is an indicator based on smart money concepts that displays almost all of the SMC/ICT elements needed to take your trading decisions to the next level. Take advantage of the alerts , push notifications and email messages to keep informed from when an element is formed on the chart, the price crosses a level and/or enters in a box/zone. Developers can access the values of the elements of the indicator using the global variables  what allows the automation of trading deci
Antes de mais nada, vale ressaltar que este Sistema de Negociação é um Indicador Não Repintado, Não Redesenhado e sem Atrasos, o que o torna ideal para negociações profissionais. O "Sistema de Negociação de Suporte e Resistência Inteligente" é um indicador avançado projetado para traders novos e experientes. Empodera os traders com precisão e confiança no mercado forex. Este sistema abrangente combina mais de 7 estratégias, 10 indicadores e vários métodos de negociação, incluindo estratégias
Mais do autor
Reverse TradeCopier for Followers   can copy trades from an account that is running Reverse TradeCopier Source . Features: Copies trades from one source (master) account to multiple following (slave) accounts. Allows investor (read only) password for source (master) account. There are no complicated settings and input parameters, everything is easy. Works with different brokers. Works with different quotes symbols (EURUSD_FX, eurusd_m, etc.). Can copy orders from 4-digit quotes platform to 5-dig
。。。。。。。。。。。。。。。。。。。。。。。。。。。。。。。。。。。。。。。。。。。 This indicator is based on Bollinger Bands indicator. It helps user clearly know the Band is expand or contract. The method of use is the same as the traditional Brin channel index. Users can use different color areas to distribute forest channel indicators in expansion or contraction stage. -------------------------------------------------------------------------------------------
FREE
Reverse TradeCopier for Followers can copy trades from an account that is running   Reverse TradeCopier for Source . Features: Copies trades from one source (master) account to multiple following (slave) accounts. Allow investor (read only) password for source (master) account. There are no complicated settings and input parameters, everything is easy. Works with different brokers. Works with different quotes symbols (EURUSD_FX, eurusd_m, etc.). Can copy orders from 4-digit quotes platform to 5-
FREE
The script shows statistics of trades for the specified period. For example, if you want to know the details of trades of the ATC2010 Winner ( bobsley ): Login with his account using the investor (read-only) password (MetaTrader5); Open the chart of his trading symbol (EURUSD); Run this script on the chart; Specify 2010.10.1 in "date from", and the diagram will be shown.
If you want something as below: Sell FOREX trading signal. Manage multiple accounts. Follow the trading from somebody. "TradeCopier_follow" and   "TradeCopier_source"   can help you! Features: Copying from one source (master) account to multiple follower (slave) accounts. Allow investor (read only) password for the source (master) account. There are no complicated settings and input parameters, everything is easy. Works with different Brokers. Works with different symbols (EURUSD_FX, eurusd_m, e
FREE
The Synchronized Charts script allows comparing bars of different symbols or different periods of the same symbol. Attach the script to a chart and move bars or change the scale, all opened chart will move synchronously with the current one. The bars on different charts aligned to the border according to their open time. Please be sure the relevant history datas have been downloaded before synchronize charts. 。。。。。。。。。。。。。。。。。。。。。。。。。。。。。。。。。。。。。。。。。。。。。。。。。。
This product is used to check the foreign exchange market history datas. Good quality historical datas is important for traders to perform market analysis or back testing. But the quality of historical datas provided by various foreign exchange brokers is uneven. Sometimes we notice missing k-line sequences, but sometimes it is not easy to detect them. This product helps users locate these missing locations.If there are many gaps in a given period of time on a chart, you need to be careful about
Some trading strategies are suitable for the quiet market with less volatility, while others are suitable for the volatile and violent market. Either way, traders should have a clear measure of how hot or cold the market is. This product is convenient for traders to compare the degree of cold heat of different trading varieties, or the trading heat of the same trading variety in different time periods. You can put it on different charts to get the intuition. It's easy to see which is more hot an
This indicator is used to indicate the difference between the highest and lowest prices of the K line, as well as the difference between the closing price and the opening price, so that traders can visually see the length of the K line. The number above is the difference between High and Low, and the number below is the difference between Close and Open. This indicator provides filtering function, and users can only select K lines that meet the criteria, such as positive line or negative
Some traders don't like expose Take Profit/Stop Loss level in their positions, this Expert Advisor can help them. Put it to chart and set Take Profit/Stop Loss pips (0 means ignore), it watch the price of the symbol on chart and close the position if price reach Hidden TP/SL level. It hide user's TP/SL price in effect. Welcome to contact me. 。。。。。。。。。。。。。。。。。。。。。。。。。。。。。
This script allows traders to easily close positions if their profit/loss reaches or exceeds a value specified in pips. The script allows users to easily close positions if their profit/loss reaches or exceeds a value specified in pips. Please set slippage value first. Sometimes some positions do not close due to high volatility of the market. Please set larger slippage or restart the script. ..............................................................................................
Script to Delete Pending Orders Sometimes you placed many Pending Orders and then you want delete certain kind of these orders, this script can help you! Usage: Download and drag and drop this script to the chart. Check "Allow AutoTrading" in "Common" tab and set input parameters in "Inputs" tab. Input Parameters: TypeOfPending: which type Order you would delete. mySymbol: which Symbol you would delete. The input format of the Symbol is such as "EURUSD" or "eurusd".
The script allows to easily watch the date and time of several cities selected by the user from more than 30 important cities all over the world. It also shows GMT, Server time and Local time. The cities on the screen are automatically sorted by the date and time. You can save your setting on the Inputs tab and use them in future. Notice: Daylight saving time is not considered.
Ticks Thermometer
Jinsong Zhang
2 (2)
Some trading strategies are suitable for the quiet market with less volatility, while others are suitable for the volatile and violent market. Either way, traders should have a clear measure of how hot or cold the market is. This product is convenient for traders to compare the degree of cold heat of different trading varieties, or the trading heat of the same trading variety in different time periods. You can put it on different charts to get the intuition. It's easy to see which is more hot an
Painting Deals
Jinsong Zhang
4.67 (3)
Painting Deals on active chart. It allows analyzing trade history on an account to which you have an investor (read only) password. Type of the arrow displayed indicated the deal type: Right Arrow means In and In/Out deals Arrow Left Left means Out deals. Blue arrows are for Buy deals and Red arrows are for Sell deals. The indicator displays deals in the real time mode, it also displays their Stop Loss and Take Profit levels. Put the mouse over the arrows to see the details of deals including op
The Synchronized Charts script allows comparing bars of different symbols or different periods of the same symbol. Attach the script to a chart and move bars or change the scale, all opened charts will move synchronously with the current one. The bars on different charts aligned to the border according to their open time. Please be sure the relevant history datas have been downloaded before synchronize charts.
This script allows traders to easily close positions if their profit/loss reaches or exceeds a value specified in pips. The script allows users to easily close positions if their profit/loss reaches or exceeds a value specified in pips. Please set slippage value first. Sometimes some positions do not close due to high volatility of the market. Please set larger slippage or restart the script. ............................................................................................
This script notifies a user about different events by playing sounds, sending emails and text messages to a mobile device. The following events are supported: New deals (in/in out/out). Expiration of Pending orders. The terminal disconnected. The terminal or the script closed. Please set a notification type for each event separately. If you need notifications via Email, please make sure that the settings on the Email tab are correct. If you need to receive notifications on a mobile device, pleas
This script alerts a user via sounds and alert box at the end of a countdown. It is like an alarm clock. There are 2 ways to start counting down: Set a value of remaining minutes. Example: if you need an alert after 1 hour, set it to 60. Set countdown end time. If you like to use a custom sound for the alert, copy your sound files to "terminal_path\Sounds" folder and set the exact file name in the input parameters. The sound file must be in *.wav format.
This product is used to check the foreign exchange market history datas. Good quality historical datas is important for traders to perform market analysis or back testing. But the quality of historical datas provided by various foreign exchange brokers is uneven. Sometimes we notice missing k-line sequences, but sometimes it is not easy to detect them. This product helps users locate these missing locations.If there are many gaps in a given period of time on a chart, you need to be careful about
This indicator let user clearly see Buy/Sell signals. When a bar is closed and conditions meet, arrow signal will come up at Close Price, up is Buy and down is Sell. It works on all Timeframes. And you can set sound alert when signals come up.
This indicator is used to compare the relative strength of the trade on the chart against the other several selected symbols. By comparing the price movement of each traded variety based on the same base day, several trend lines of different directions can be seen, reflecting the strong and weak relationship between the several different traded varieties, so that we can have a clearer understanding of the market trend. For example, you can apply this indicator on a EurUSD chart and compare it
.................................. This script is intended to help users to get information about ticks and spreads (e.g. ticks count, minimum/maximum/average spread). It can export reports in the CSV format with this information. Traders can see spread statistics in real time in the chart window It is useful for comparing spreads of different brokers. --------------------------------------------------------------------------
This is visualization tool based on the Depth of Market. It works with the symbols that have the Depth of Market available. It's a visual indicator that shows the volume of each Bid/Ask price and ratio of total volume of Bids/Asks. Note: check if your broker supports DOM before purchasing. 。。。。。。。。。。。。。。。。。。。。。。。。。。。。。。。。。。。。。。。。。。。。。。。。。。。 。。。。。。。。。。。。。。。。。。。。。。。。。。。。。。。。。。。。。。。。。。。。。。。。。。。
This indicator is used to compare the relative strength of the trade on the chart against the other two selected symbols. By comparing the price movement of each traded variety based on the same base day, three trend lines of different directions can be seen, reflecting the strong and weak relationship between the three different traded varieties, so that we can have a clearer understanding of the market trend. For example, you can apply this indicator on a EurUSD chart and compare it with curre
Most time the market is in a small oscillation amplitude. The Trade Area indicator helps users to recognize that time. There are 5 lines in this indicator: Area_high, Area_middle, Area_Low, SL_high and SL_low. Recommendations: When price is between Area_high and Area_Low, it's time to trade. Buy at Area_Low level and sell at Area_high level. The SL_high and SL_low lines are the levels for Stop Loss. Change the Deviations parameter to adjust SL_high and SL_low.
This indicator is used to indicate the difference between the highest and lowest prices of the K line, as well as the difference between the closing price and the opening price, so that traders can visually see the length of the K line. The number above is the difference between High and Low, and the number below is the difference between Close and Open. This indicator provides filtering function, and users can only select K lines that meet the criteria, such as positive line or negative line.
This script allows you to compare quotes and spreads from different trading servers or brokers to identify a server/broker that offers the best bid/ask price and the tightest spread. It can be compared with up to six different servers or brokers at a time, and it is easy to find the best quote provider by score. Usage: Open up to 6 MetaTrader client terminals, login to different servers/brokers, and then start the script on each terminal's chart.
Rocket Projectile
Jinsong Zhang
1 (1)
This is a multi-currency paired trading system.I won't go into the details of how it works, but what the user needs to care about is how it actually works. It is highly recommended that you download the product and test it thoroughly, including back testing with the historical data and foward testing in the simulated account. As this EA trades multiple currency pairs, relevant historical data will be automatically downloaded at the first time of its historical review, with data volume around 6GB
This tool is used to generate a K - line reflection chart of a currency pair for foreign exchange transactions. For example, if the currency pair is EURUSD, a custom currency pair named EURUSD_ref is generated and a chart for that currency pair is opened. The price of a custom pair of currency is the inverse of the price of the original pair, which is the equivalent of a new pair of currency, the USDEUR. The usage is simple, put it on any chart, the new chart will open, and then draw the co
Filtro:
Sem comentários
Responder ao comentário
Versão 1.1 2021.11.19
Recompile as required by MQL5.community