PZ Trend Trading
- Indicadores
- PZ TRADING SLU
- Versão: 6.2
- Atualizado: 25 abril 2021
- Ativações: 20
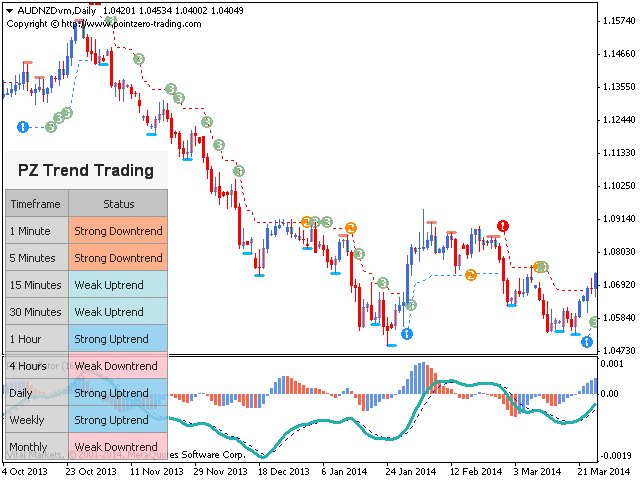
O Trend Trading é um indicador projetado para lucrar o máximo possível com as tendências que ocorrem no mercado, cronometrando retrocessos e rupturas. Ele encontra oportunidades de negociação analisando o que o preço está fazendo durante as tendências estabelecidas.
[ Guia
de instalação | Guia
de atualização | Solução
de problemas | FAQ
| Todos
os produtos ]
- Negocie mercados financeiros com confiança e eficiência
- Lucre com as tendências estabelecidas sem ser chicoteado
- Reconhecer retrocessos lucrativos, interrupções e reversões antecipadas
- O indicador analisa sua própria qualidade e desempenho
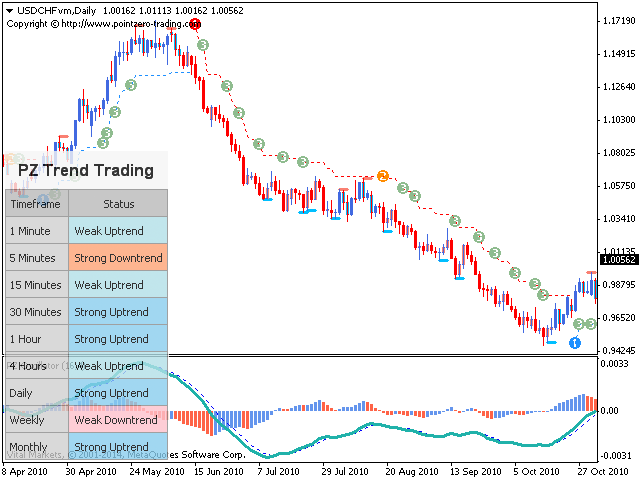
- Implementa um painel de vários períodos de tempo
- O indicador não está repintando
- Implementa alertas de email / som / visuais
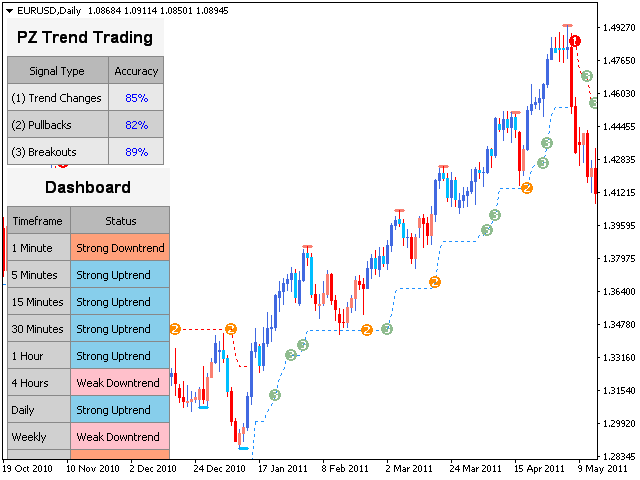
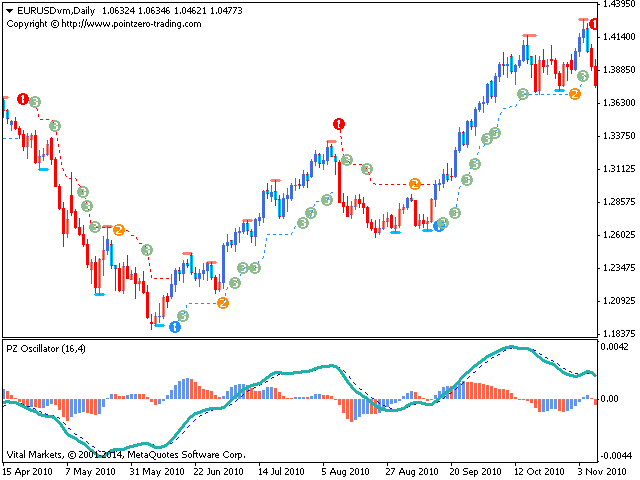
As tendências estabelecidas oferecem dezenas de oportunidades de negociação, mas a maioria dos indicadores de tendência as
negligencia completamente. Interpretar o indicador é bastante fácil:
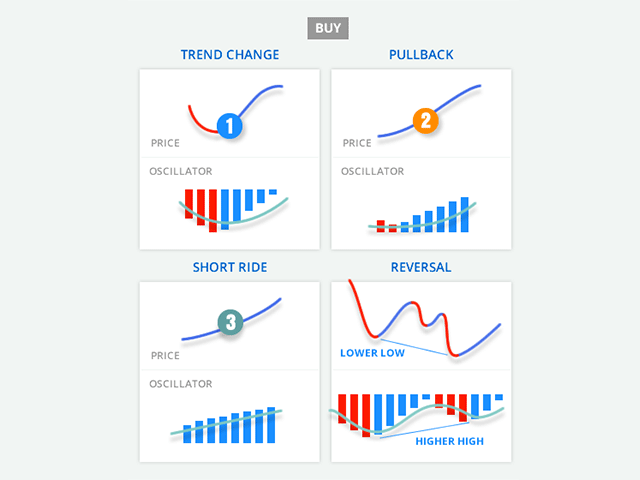
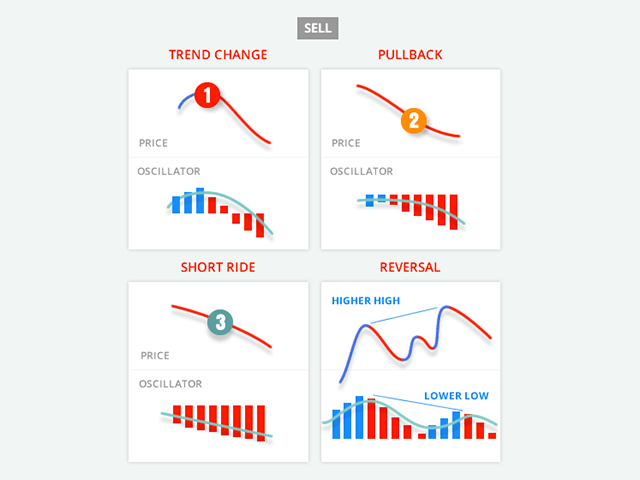
- (1) é uma mudança de tendência
- (2) é uma retração na direção da tendência
- (3) é uma fuga na direção da tendência
- Um traço vermelho é uma correção durante uma tendência de baixa
- Um traço azul é uma correção durante uma tendência de alta
- Barras azuis são uma sub-tendência de alta
- Barras vermelhas são uma sub-tendência de baixa
Parâmetros de entrada
- Período do indicador: Este parâmetro controla a sensibilidade às mudanças de tendência. Um grande período levará à captura de tendências mais longas. Um pequeno período levará à captura de tendências mais curtas, mas um reconhecimento mais rápido das mudanças de tendência.
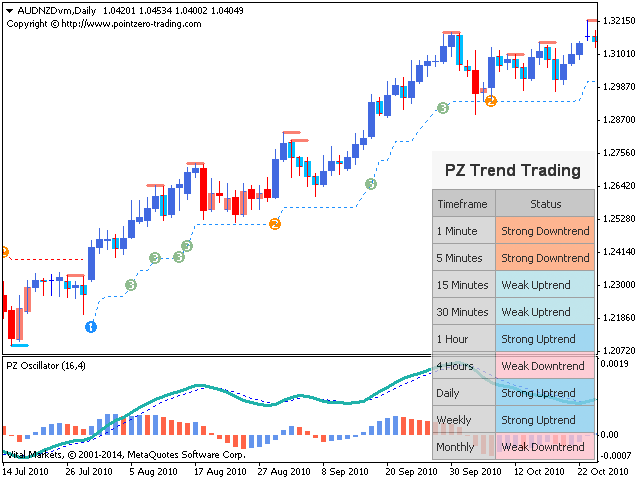
- Exibir sub-tendência: ative esse parâmetro para ver a sub-tendência refletida na cor das barras de preço.
- Exibir recuos: ative esse parâmetro para ver recuos, exibidos como (2) objetos no gráfico.
- Exibir breakouts: ative esse parâmetro para ver as breakouts na direção da tendência, exibidas como (3) objetos.
- Exibir correções: ative esse parâmetro para ver as correções de tendência, exibidas como traços coloridos.
- Máx. Barras do histórico: este parâmetro controla quantas barras anteriores são examinadas ao carregar o indicador.
- Exibir o painel: ative esse parâmetro para ver o painel de vários períodos no gráfico.
- Exibir estatísticas: ative esse parâmetro para exibir o painel de estatísticas no gráfico.
- Configurações de desenho: Escolha a cor e a largura das linhas de correção exibidas no gráfico.
- Alertas: ative alertas de exibição / e-mail / push / som para todas as configurações de negociação ativadas acima.
Suporte e perguntas
Use o suporte técnico para perguntas ou suporte oportuno. Escreva um email para:
help@pointzero-trading.com
Autor
Arturo López Pérez, investidor e especulador privado, engenheiro de software e fundador da Point Zero Trading Solutions.


Great indicator!