Conheça o Mercado MQL5 no YouTube, assista aos vídeos tutoriais
Como comprar um robô de negociação ou indicador?
Execute seu EA na
hospedagem virtual
hospedagem virtual
Teste indicadores/robôs de negociação antes de comprá-los
Quer ganhar dinheiro no Mercado?
Como apresentar um produto para o consumidor final?
Pagamento de Indicadores Técnicos para MetaTrader 4 - 52
Intraday Signals is a visual and effective semi-automatic trading system, that: generates possible entry points to open BUY and SELL trades; displays recommended Take Profit and Stop Loss; displays current profit on open trade; displays current spread. The profitability of the indicator is shown in the screenshot on the example of the GBPUSD pair Does not redraw and works on opening bar. Time frames - M1-H1. Recommended TimeFrame-M5-M15. Signals are produced based on the used of HMA, Laguerre

5 signal in 1 Product TimeFrame Recommend 1m-5m
recommend signal TF 5m
Banks Pro Binary Option is Indicator for binary option Can Use Manaul Trade or Robot on Platform Mt2Trading https://www.mt2trading.com/?ref=104 Time Trading good work EU session Recommend Curency EUR GBP USD careful AUD JPY Recommend Martingale 2-5 Step
Recommend set profit 2%-5%/Day Setting Brake News Event High volatility recommend 15-30 min
Have Problem Contract

Trend indicator with a confirmation signal. A histogram is plotted at the bottom of the chart with a signal strength of 1 to 2 for a buy signal and -1 to -2 for a sell signal. The indicator applies to all periods of the chart and to all currency pairs.
On the main chart, arrows are drawn signaling entry into the transaction. The info panel with at the price of entry into the transaction current price profit in points information on the current signal - purchase or sale. The indicator is set t

This indicator is using two moving average , signal will be crated according to preset points on two Moving Average. In general, First signal is immadiate entrence and second order is limit order. color IndLevelColor=clrYellow; // Indicator Level Color extern int ArrowGap=35; // Close+-Arrow Gap Pips extern int SecondOrderEntryLevelPips=500;// Second Limit Order Entry Level Pips extern int HareketliOrtalamaGiris1=5; // 1. Moving Average extern int HareketliOrtalamaGiris2=35;// 2. Moving

The indicator is designed to trade binary options on small time frames up to m 30 Signals The blue up arrow is a buy signal. The red dn arrow is a sell signal. The signal will appear together with the advent of a new candle and during formation Signals on the current candle Expiration time one candle from the timeframe on which you are trading You can use moving average to filter out false signals. Or escort support levels. This tool is reliable in trading.
MB SR Levels is a simple, albeit strong tools for technical analysis. It depicts Support and Resistance levels and gets them updated candle by candle. By default, there are four (adjustable) levels. You can set their period in the settings. Each level represents the Support or Resistance lasted for n ( Adjustable P1 to P4 periods) previous candle. Breakout of the Support or Resistance levels can be considered as entry signals. Considere the importance of those levels and possibility of price

This indicator is designed to scan all pairs and symbols, for all selected time frames, to find a cross of moving averages. The 4 Moving Average Strategy
The scanner has 4 moving averages: - 2 moving averages to define the trend - 2 moving averages are used to find the right moment to send an alert
If the fast trend MA is above the slow trend MA, than it is considered as a bullish market and it will only provide bullish alerts. If the fast trend MA is lower then the slow trend MA, it is consi

Average Cost Price helps you keep track of your open positions on the chart. In doing so, it provides lines and explanations on the chart. This line is the average price value of Buy or Sell. If you wish, you can see the average cost price by adding SWAP and COMMISSIONS to the average price value. With MAGIC NO you can differentiate position costs on the same symbol. Average Cost The description below the price line gives you: * Average Buy or Sell price, * PIPS difference between average price

Трёхуровневый цифровой фильтр тренда. Индикатор не нуждается в настройке. Просто установите и работайте! Предварительно подберите необходимый рабочий таймфрейм и торговый инструмент, визуально подходящие для торговли. Сигнал не перерисовывается на сформированной свече!
Не забудьте посмотреть другие мой продукты - https://www.mql5.com/ru/users/altiveus/seller . Приобретая мои продукты, вы поддерживаете разработку нового программного обеспечения. Так же купив любой мой продукт вы получаете скидку

Ultimate Scalper Pro checks for Early Entries , the used algorithm is based on CCI, RSI, MA, ATR.
This indicator is a powerful trend one, it shows the ma rket clearly , NO Noise , NO Repaint . you can use it with your own strategy or indicator, personally i use it with CCI, MFI, my own TMA bands non repaint and CSS indicator, it gives entry with the Lowest Drawdown , especially when used with (oversold and overbought) indicators and currency strength indicator.
Basically entries like t

A two-lines crossover oscillator for market entry and exit. Use on M15 and above for better accuracy. Place indicator on a second chart with the same currency pair and expand for a better view. The indicator gives one a good idea of volatility, volume and trend. Works on any currency pair, yet extremely well on currency pairs with good daily PIP volatility such as GBPJPY, GBPNZD and exotic currency pairs. Use during major market sessions such as London and London-New York overlap for best result

You can fins our other products from link : https://www.mql5.com/en/users/drbastem/seller Also, you can ask all your questins from email : haskayafx@gmail.com or mobile : +90 530 867 5076 or @MehmetBastem on telegram application This indicator uses standard Bollinger’s bands and two moving average, it is providing trustable signal based on difference between Top and Bottom limit of Bollinger bands, moving average trend degree within the Bollinger band zone. Signals are shown as arrow
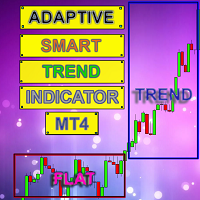
Smart indicator Adaptive Smart Trend Indicator determines the sectors of the Trend and the Flat and also in the form of a histogram shows the breakdown points of the levels (1 - 5).
The indicator performs many mathematical calculations to display more optimal Trend movements on the chart.
The program contains two indicators in one: 1 - draws the Trend and Flat sectors, 2 - the histogram indicator shows the best signals for opening an order. The indicator autonomously calculates the m

The Rise of Sky walker is a trend indicator is a powerful indicator for any par and any timeframe. It doesn't requires any additional indicators for the trading setup.The indicator gives clear signals about opening and closing trades.This Indicator is a unique, high quality and affordable trading tool. Can be used in combination with other indicators Perfect For New Traders And Expert Traders Low risk entries. Never repaints signal. Never backpaints signal. Never recalculates signal. Great F

This indicator is looking for such market models as: head and shoulders, triangles, double tops and bottoms, flags, wedges and three touches.
Options:
barsToProcess - the initial number of bars to calculate;
ArrowSize - arrow size;
AllowablePatternLength - minimum length of the pattern (in bars);
AllowablePatternPriceDiv - the minimum height of the pattern, applicable for all but the 'head and shoulders', 'double top' patterns (for the latter there is another parameter);
AllowablePriceA

Simple indicator for BUY / Sell Zones moving Buy and Sell zones : Closest zone is wide and clear : Red for Sell zone , Green for Buy zone >>> old far zones are in bold lines :::BUY Zones (GREEN) appear only in UP Trend and disappear in DOWN Trend :::SELL Zones (RED) appear only in DOWN Trend and disappear in UP Trend input parameters ::: index bars : bars range for zone calculation levels : number of zones Up move/Down move arrows mail and message Alerts !! used on any symbol used on any timefr
Diverence Dash is a MACD, RSI, OBV, Momentum, Stochastic or Standard Deviaviation Divergence Dashboard. It will scan all symbols and timeframes you want. Also, Divergence Dash can open charts with the divergence found using the template of your choice. Divergences are often used as a leading indicator and, by using Divergence Dash, are easy to spot. The risk/reward ratio in divergence trading is very low. What can Divergence Dash for you: Find MACD, RSI, OBV, Momentum, Stochastic or Standard Dev
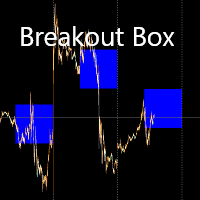
A breakout box that can set for the start of any of the major trading sessions - Hong Kong, London, London-New York overlap. Set the width of the breakout box in points (10 points=1 PIP) Use it to gauge if the currency pair you are trading in is in a channel or not. Trade once price breaks out from the box. Use with a volume and momentum indicator for best results. You may change the colour of the box to suit your individual preference and chart colour scheme.
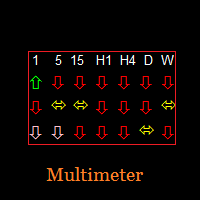

This indicator is producing accurate signal based on distances between crossection point of 571 period moving average with 632 period bollinger band and 17 moving average and 171 moving average. You can also use this signal with expert advisor with below code double v1= 0 ; v1= GlobalVariableGet ( Symbol ()+ string ( Period ())+ "HSKPASHAVO1" ); if (v1== 0 ) return ( 0 ); // No Signals if (v1== 1 ) { //Send BUY Order... GlobalVariableSet ( Symbo

Crazy Dancing moving RES/SUP Levels Automatic redrawing of moving Supports and resistances levels to indicate price breaking supports (signal SELL) or breaking resistance levels (signal BUY) Very simple appearing indicator but very clever and smart too !!!! Main Inputs: # of bars for the support and resistances levels + the initial shift from start + moving average for filter signaling Smaller values for bars /shift inputs when using Higher Time frames (D1-H4) and the reverse higher values for

mql5 version: https://www.mql5.com/en/market/product/44815 Simple indicator to calculate profit on fibonacci retracement levels with fixed lot size, or calculate lot size on fibonacci levels with fixed profit. Add to chart and move trend line to set the fibonacci retracement levels. Works similar as default fibonacci retracement line study in Metatrader. Inputs Fixed - select what value will be fix, lot or profit Fixed value - value that will be fix on all levels Levels - levels for which to ca
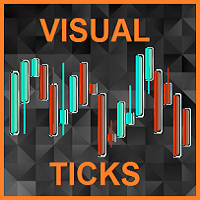
A real rarity for scalpers.
Are you looking for TFs lower than M1 ?
Do you want to see the price dynamics inside the candle?
This is a tool for you.
Visual Ticks is an indicator that shows the tick chart in a separate window.
He does it in real time waiting for changing ticks.
Thanks to Visual Ticks, we can look inside the traditional candle and see the dynamics of the moving price.
By setting "period_of_model" we can shape a chart made of candles.
"period_of_model" defines how many c
This tool has proven itself well when tested on the Forex market on the EUR/USD currency pair. We also tested this tool for Binary Options and was able to show good quality signals on the EUR/USD currency exchange. SIGNALS DO NOT RENDERY MOVE THE ARROW BY 1 CANDLE MAXIMUM THIS IS EXTREMELY RARE TO ENCOUNTER
The signals of this instrument are formed during the candlestick. It is worth entering the trade after closing the candle on which the signal was generated. The green arrow indicates the p

You can fins our other products from link : https://www.mql5.com/en/users/drbastem/seller Also, you can ask all your questins from email : haskayafx@gmail.com or mobile : +90 530 867 5076 or @MehmetBastem on telegram application This system created by using Corrected MACD, Different time zone support and resistant points, Parabolic Sars, Bollinger band, 4 moving average, stochastic oscillator and ADX.
In this system, Using parabolic Sars reverse bar count, Pips difference between clo

This indicator prepared by using 57 days moving averagr and least square method. It can only work for 1 hr time interval. Once a signal created. It is creating order and 2 limit orders. It works in CFD pairs as well as in Forex pairs. You can fins our other products from link : https://www.mql5.com/en/users/drbastem/seller Also, you can ask all your questins from email : haskayafx@gmail.com or mobile : +90 530 867 5076 or @MehmetBastem on telegram application This system is for Long term and pr
Pair Spread Indicator with recovery of missed bars. This indicator will automatically restore missed bars in the history at average prices of neighboring bars. A histogram chart shows the price difference between the two instruments in a separate window. Ideal for related instruments, for example: BRN - WTI, GOLD - 50 * Silver, DJ - 14 * S & P500, etc .; Calculation method: the difference in closing prices (opening / maximum / minimum) between two current bars and sequentially N-bars back; Hist

KT Power Pennant finds and marks the famous pennant pattern on the chart. A pennant is a trend continuation pattern with a significant price movement in one direction, followed by a period of consolidation with converging trend-lines.
Once a pennant pattern is formed, a buy/sell signal is provided using a bullish or bearish breakout after the pattern formation.
MT5 Version is available here https://www.mql5.com/en/market/product/44714
Features
Pennant patterns provide a low-risk entry af

This system created by using Corrected MACD,ADX, Different time zone support and resistant points, Parabolic Sars, Bollinger band, 9 moving average, stochastic oscillator and ADX.
In this system, Using parabolic Sars reverse bar count, Pips difference between closing price and last parabolic Sars in the direction of signal and Trend strength. Note that this system is not martingale, this system is creating limit order. Best result for the orders are 25 Pips in USD, 50 Pips in GBP. Best

This system created by using Corrected MACD,ADX, Different time zone support and resistant points,
tree Parabolic Sars,two Bollinger band, 3 moving average, stochastic oscillator and ADX.
In this system, Using parabolic Sars reverse bar count,
Pips difference between closing price and last parabolic Sars in the direction of signal and Trend strength.
Note that this system is not martingale, this system is creating limit order.
Best result for the orders are 45 Pips in USD, 75 Pip

Special Offer, The Prices For Limit Time Golden Sign is an indicator that signals entry into buying or selling positions that works best on GBPs pairs and a 4-hour frame. It can make 20 to 200 Pips at every signal. Its success rate is over 80%. It contains two types of signal for each direction, one is slow and the second is faster. You can use any of them, but when the two combine together they are the strongest signal. Or you can add it to your strategy. Note: (Make sure to download the clear
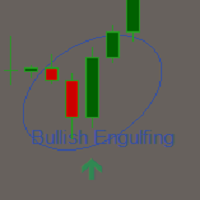
Candlestick patterns are certainly among the most loved and trusted technical tools. In the same time, they are very easy to spot for a trained eye, yet having an indicator plot them all on the chart is a great time saver to any full time trader. Our candlestick pattern detector is able to accurately identify the most common candlestick patterns, such as the Hammer, Inverted Hammer, Shooting Star, Bullish and Bearish Engulfing Candles (and their 3-candle equivalent the Three Inside Up and Three

This system created by using Stochastic oscillator and moving average. Entrance value and take profit values can be seen by system. This is system for Long term and profitable. this system can be used for 15 minutes time frame. This system is not repaints. This system is for Long term and profitable. Signals are shown as arrows. as an optional, you can set a voice alarm or email notification You can fins our other products from link : https://www.mql5.com/en/users/drbastem/seller

The indicator combines several types of calculation: calculation of price channels and determining the direction of the trend. The green line is a buy signal ; The magenta line is a signal for sales . Two yellow lines of the "small" channel above the middle green line - getting ready for sales; Two yellow lines below the magenta line - getting ready to shop. Blue channel lines - the higher the distance between the lines, the closer the price rollback or trend reversal. The indicator can be used

I present to your attention a comprehensive indicator based on mathematical, historical and price calculations. The indicator will be very useful in building your own trading strategies and systems. What the indicator is capable of: 1. Builds channels based on price levels. It determines the strength of the channel and reflects it visually (the thicker the line, the more significant the channel. The dashed line is the weakest channel) 2. Builds waves based on the channels (the red line i

Extreme TMA System with Arrows Indicator And Buy/Sell Boxes with Take Profit & Stop Loss
This is a Non-Repainting Arrows Indicator based on the Extreme TMA System. It shows TMA cross signals and the best BUY/SELL signals. Along with the most predicted TakeProfit. And StopLoss based on TakeProfit ratio.
Please note: This is an Arrows only Indicator. Dashboard is sold separately here: https://www.mql5.com/en/market/product/44825
About Indicator: This indicator shows BUY/SELL Signal Arrows a

This indicator prepared by using 311,1298 days moving average and Calculates the Envelopes. This system can be used for 5M time frame. This system is for Long term and profitable. Signals are shown as arrows. as an optional, you can set a voice alarm or email notification You can fins our other products from link : https://www.mql5.com/en/users/drbastem/seller Also, you can ask all your questins from email : haskayafx@gmail.com or mobile : +90 530 867 5076 or @MehmetBastem
O indicador técnico RSI Multi Timeframe Alert é uma ferramenta poderosa projetada para fornecer uma visão abrangente do RSI (Índice de Força Relativa) em vários prazos simultaneamente. Com este indicador, os traders podem identificar facilmente as condições de sobrevenda e sobrecompra em diferentes prazos sem a necessidade de alternar entre os gráficos. Ele também inclui um sistema de alerta rápido que envia notificações móveis e pop-up quando o RSI atinge níveis predefinidos de sobrevenda o

Condors TMA ( Triangular Moving Average ) is a channel indicator without redrawing, built on the basis of moving averages. The key difference between the Condor TMA indicator and other channel indicators (for example, from the same Bollinger indicator) is that Condor TMA takes into account not simple moving averages, but twice smoothed ones, which allows one to more clearly determine the market movement, and on the other hand makes the indicator less sensitive.

Cancer indicator is great for trend trading! An intelligent indicator algorithm with high probability shows the points of potential market reversal. If you are trading in a trend, then a trading strategy built on the basis of this indicator is perfect for you. The indicator filters out market noise, almost everything and all the necessary functions for working with a thread are built into one tool. It works on all currency pairs and on all timeframes, indicator setting - according to your desire


This indicator prepared by using 1311,2840 days moving average and Calculates the Envelopes. This system can be used for 15M time frame. This system is for Long term and profitable. Signals are shown as arrows. as an optional, you can set a voice alarm or email notification You can fins our other products from link : https://www.mql5.com/en/users/drbastem/seller Also, you can ask all your questins from email : haskayafx@gmail.com or mobile : +90 530 867 5076 or @MehmetBastem

This indicator prepared by using 311,1298 days Haskaya Trend Bandse and Calculates the strand ADX. This system can be used for 5M time frame. This system is for Long term and profitable. Signals are shown as arrows. as an optional, you can set a voice alarm or email notification You can fins our other products from link : https://www.mql5.com/en/users/drbastem/seller Also, you can ask all your questins from email : haskayafx@gmail.com or mobile : +90 530 867 5076 or @Meh
A real rarity for scalpers.
Are you looking for TFs lower than M1 ?
Do you want to see the price dynamics inside the candle?
This is a tool for you.
Visual Ticks is an indicator that shows the tick chart in a separate window.
He does it in real time waiting for changing ticks.
Thanks to Visual Ticks, we can look inside the traditional candle and see the dynamics of the moving price.
By setting "period_of_model" we can shape a chart made of candles.
"period_of_model" defines how many c

A very simple and convenient trend indicator based on price divergence. He showed himself well in scalping. Help in finding entry points for analysis. It can be used as a filter in trade. It has two parameters: Period and Level. The Level parameter helps to filter out excess signals. For example, for EURUSD, the Level parameter may be 0.0001. The indicator can work both for entry points and as a filter. The indicator reflects information in a visual form. We must not forget that the approach to

This indicator prepared by using 3 EMA,3 Bollinger Bands and Calculates the Volumes. This system can be used for 5M time frame. This system is for Long term and profitable. Signals are shown as arrows. as an optional, you can set a voice alarm or email notification You can fins our other products from link : https://www.mql5.com/en/users/drbastem/seller Also, you can ask all your questins from email : haskayafx@gmail.com or mobile : +90 530 867 5076 or @MehmetBastem on t

This indicator prepared by using Envelopes, Bollingers Bands, ADX and RSI . This system can be used for 5M time frame. This system is for Long term and profitable. Signals are shown as arrows. as an optional, you can set a voice alarm or email notification You can fins our other products from link : https://www.mql5.com/en/users/drbastem/seller Also, you can ask all your questins from email : haskayafx@gmail.com or mobile : +90 530 867 5076 or @MehmetBastem on telegram

This indicator is created by considering volume divergence with price that is outcome of Bollinger band and Envolpes indicators crossing. It won’t repaint. It is providing 1 market and three pending orders. If it is followed with patient, it is providing remarkable profit at the end. This indicator will be on sale soon on expert advisor. Target is calculated for buy orders as follow 1. 50 pips standard 2. Top Bollinger band 3. Sell Signal Target is calculated for buy orders as follow 1. 50

Select from up to 6 Strategies solo or Combine different strategies for signal generation (Combining more than 2 strategies may LIMIT a lot the number of signals)! ALL From Chart !!! Also Inputs editing from Chart !!! Push your strategy bottom (one strategy) OR Combine signal from as may strategies (up to 6) : Selected and enabled strategies will be in GREEN !!! 1- BUY SELL areas 2- Support resistance break signal 3- Elliot wave continuation /reversal signal 4- Advanced Moving averages 5- Tren
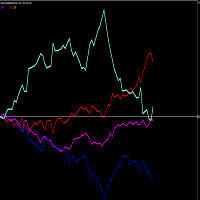
PLEASE NOTE THAT LIKE MANY SUCH INDICATORS ON THIS MARKET, THIS INDICATOR WILL NOT WORK AS A DEMO DOWNLOAD FOR STRATEGY TESTER. Therefore the 1 month option at the lowest cost allowed of $10 is available for you to test. One of the better ways to trade is to analyse individual currencies rather than currency pairs. This is impossible with standard chart indicators on MT4. This currency strength meter allows one to trade the USDZAR, EURZAR, GBPZAR. Each currency (not pair) is measured const
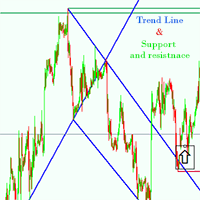
Support and resistance Strategy is one of the most widely used concepts in forex trading.
Strangely enough, everyone seems to have their own idea on how you should measure forex support and resistance. no more wasting time This Indicator is made to do it automatically for you, Features of support and resitance indicator * Automatically detection of the trend line and support & resistance * Works on any pair any time frame any time * Works on offline Chart Inputs : TrendLinePeriod=900 CycleSi
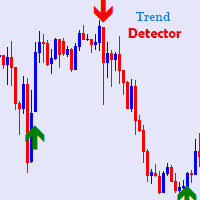
Trend Detector Trading Indicator is a trend following trading system based on the MT4 Platform that Detects the start of the Trend. Very simple and power indicator showing buy / sell arrows direction for trading currencies and commodities as well. one scan is done which generates certain trades, long and Short which takes 1 second to generate the entry/exit points,
Currency pair : EUR/CHF, EUR/GBP, EUR/JPY, EUR/USD, GBP/CAD, GBP/JPY, GBP/USD, NZD/USD, USD/CAD, USD/CHF . and All the Pairs yo

SMOOTH DEVIATION line indicator for 2 symbols It compares the power/strength lines of two user input symbols and create a SMOOTHED line that indicates the degree of deviation of the 2 symbols Strategy#1- FOLLOW THE INDICATOR THICK LINE when CROSSING O LEVEL DOWN --- TRADE ON INDICATOR THICK LINE (TREND FRIENDLY) !! Strategy#2- TRADE INDICATOR PEAKS (Follow indicator Reversal PEAKS Levels)!! you input - the index of calculation ( 10/20/30....) - the indicator Drawing start point
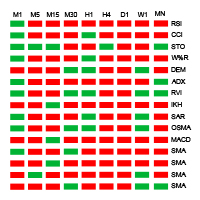
Indicator principle: Display all cycle trends of 15 indicators in one chart Oscillation indicator shows the current value of each cycle at the same time (RSI, CCI, STOCHI, W% R, DEM, ADX, RVI, IKH, SAR, OSAM, MACD, moving average, moving average crossing) RSI (Relative Strength Index) Trend level above red below green CCI (Commodity Channel Index) Trend level above red below green STOCH (Stochastic Oscillator) Gold fork red death fork green W% R (WilliamsPercent Range) Trend level above red bel

Simple 3 Moving supports and resistance levels (Your Review /comment and feedback is important !! Thanks) Signal UP and Down possibilities created on crossing the multi supports/resistance levels supports all time frames Adjusted inputs for area covered for generating the levels and the shifts needed to cover 3 areas supports /resistances levels for example you may use main parameters in M30 time frames: extern int ShiftFromStart=20; extern int barsCount=20; extern int sequenceShifts=50; in
X Trendline X Trendline-indicator for determining the direction of the trend movement
The X Trendline indicator has its own unique formula for calculating the direction of price movement.
This indicator is suitable for both beginners and experienced traders.
The indicator can be used as an excellent filter for your trading system. You can also define where to enter and exit a position.
For those who want to use this indicator in their expert Advisor, there are three buffers from which
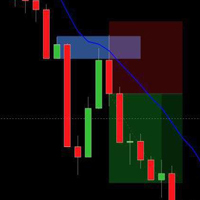
I spent two and a half months checking charts, looking for best variations for FTB trades and adjusting this indicator to get this final version. I think these are best rules to get as many FTB setups as you can. My aim was to make trading more comfortable as I cant imagine myself going through at least 36 tabs and search for FTRs and then again checking FTBs. FTB setup is pretty straight forward and easy to make indicator for so I said to myself why should I bother when I can have indicator to
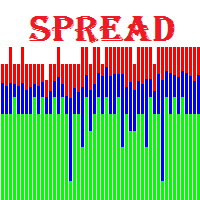
Spreads Monitoring MT4 - мощный инструмент для сбора значений спреда и записи их в файл. Позволяет "ловить" минимальные и максимальные значения спреда, рассчитывает реальное среднее значение спреда у брокера . Преимущества индикатора: Работает на всех таймфреймах; Восстанавливает ранее записанные данные для отображения на графике; Умеет запускать себя на графиках других символов по шаблону текущего графика; Имеет инструменты для удобной работы с данными; Не нагружает терминал. Параметры индикато

The indicator of stop hunting shows the level zone of Day marketing. Zones are displayed as background rectangles. The length of the rectangle corresponds to the duration of the active trading, and the height to the trading range. For the current trading day, there is still the opportunity to show the extreme prices of each zone. The following parameters can be configured in the indicator: NumberOfDays = 200 - The number of days displayed.
MultiCharts - indicador multimoedas para análise visual de vários instrumentos de negociação. cem uma janela separada plota os símbolos selecionados; mostra os níveis de quaisquer ordens estabelecidas; mostra lucros/prejuízos, número e tipo de posições abertas; constrói indicadores técnicos Moving Average, SDL, Trend filter e Heiken Ashi charts; mostra o spread, preços OHLC da barra atual; mostra a mudança de preço relativo para o dia atual*; * - para períodos até Diária, inclusive, a alteração
Unique trend trading algorithm with advanced filtering and many features which should become a part of your trading arsenal. This indicator can give you also trading advisors (with take profit target), success rate scanner and much more.
Important information
For additional detailed information you can visit the 747Developments website.
Features Easy to use (just drag and drop to the chart) Possible to use with any trading instrument Possible to use on any time-frame Take profit advisors S

BeST_Profit Taker Exits is a Metatrader Indicator based on the corresponding vital part of Jim Berg's Trading System.It timely locates the most likely points/bars of significant Profit Taking and can be easily used as an add-on to any Trading System/Method . The Indicator consists of 2 Take Profit lines deriving as (MA ± times the ATR) usually the upper one above the prices (for Long Trades) and the lower one below prices (for Short Trades). When the Close (or High by choice) of a bar is above

Calculated trend indicator, can be used with an optimal risk to profit ratio, shows successful signals. Uses two options for settings. Shows favorable moments for entering the market with arrows. The probability of a successful trend is not very bad! The indicator can be used both for pipsing on small periods, and for long-term trading. The indicator does not redraw and does not lag. It works on all currency pairs and on all timeframes.

Eurosmart Pro is a smart indicator of detecting trends, contains two intelligences. first is intelligence detects trends, and filter on the indicator can function to eliminate false signals. This indicator allows you to open trading easily and accurately. all indicator features are easy to use and easy to understand. Trading Rule: Pair : EURUSD, EURJPY Trading Sesion : London and New York Sesion Time Frame : M30/H1 Stop Trading : Sideway Market and High news impact (NFP, ECB) Open BUY : Ca
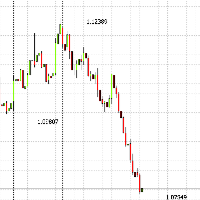
Em zigue-zague com a assinatura dos três últimos extremos, 1º, 2º e 3º, o próprio indicador em zigue-zague deve ser adicionado ao gráfico adicionalmente, se necessário, pois você pode ficar sem ele. Ele funciona em todos os instrumentos e prazos, é especialmente útil em grandes TFs ver imediatamente os últimos três preços e não bagunçar o gráfico com indicadores e linhas desnecessários. Você pode alterar - Cor, Tamanho da fonte e Localização em relação ao anexo do preço do gráfico Para que o últ
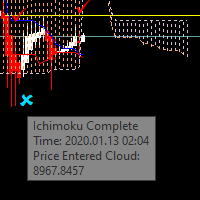
Have you ever tried to trade with the Ichimoku indicator only to wonder whether to stay in or close the trade? You will now know precisely what price is doing so you can choose your strategy. There are many different ways to trade Ichimoku and I'm confident you will find your strategies much easier to implement with the Ichimoku Complete. A bonus is that the parameters are fully adjustable for those trainers who ask you to change the values of the indicator. In this way you can use one strat

На рисунке ниже показан принцип работы индикатора. Это поиск паттерна Price Action.
Свечная модель состоит из двух показателей доминирования быков или медведей. В построении сигнала также участвуют тиковые объемы и объемная дельта.
Индикатор ищет возможные развороты на участке, длина которого задается в параметрах Calculation High/Low
По умолчанию параметр задан, как 50 баров.
Входные параметры Calculation High/low - определение high/low по количеству баров

Este indicador mostra os últimos 4 extremos em zigue-zague, denotando-os como 0, A, B, C com a assinatura do preço. Funciona em qualquer instrumento comercial. Você pode alterar o tamanho, a cor do texto, a localização do texto em relação aos preços de pico, também pode alterar as configurações em zigue-zague. O próprio ZIgZag para desenhar linhas deve ser conectado adicionalmente ao gráfico. Para que o último valor sempre exiba o último máximo / min do zigue-zague, defina ShiftBars = 0 Adicio

Ska ZigZag BuySell indicator determines the overbought and oversold regions within a trend. The indicator determines the overbought region by the candlestick high and the oversold region by the candlestick low. This indicator only gives signals with arrow and audible alerts each and every time when a new candlestick appear. To utilize the full strategy i recommend using "Ska ZigZag BuySell" together with "Ska ZigZag Line". The Ska ZigZag Line indicator is available for free. NOTE: Indicator is h
In finance , volatility (symbol σ) is the degree of variation of a trading price series over time as measured by the standard deviation of logarithmic returns . Historic volatility measures a time series of past market prices. Implied volatility looks forward in time, being derived from the market price of a market-traded derivative (in particular, an option). In 2000 Yang-Zhang created a volatility measure that handles both opening jumps and drift. It is the sum of the overnight volatilit
O Mercado MetaTrader é o melhor lugar para vender robôs de negociação e indicadores técnicos.
Você apenas precisa desenvolver um aplicativo para a plataforma MetaTrader com um design atraente e uma boa descrição. Nós vamos explicar como publicar o seu produto no Mercado e oferecer a milhões de usuários MetaTrader.
Você está perdendo oportunidades de negociação:
- Aplicativos de negociação gratuitos
- 8 000+ sinais para cópia
- Notícias econômicas para análise dos mercados financeiros
Registro
Login
Se você não tem uma conta, por favor registre-se
Para login e uso do site MQL5.com, você deve ativar o uso de cookies.
Ative esta opção no seu navegador, caso contrário você não poderá fazer login.