Lahcene Ouled Moussa / 프로필
- 정보
|
8+ 년도
경험
|
0
제품
|
0
데몬 버전
|
|
0
작업
|
0
거래 신호
|
0
구독자
|
Dear freind
iam very happy to join this site ifind it great iam Lahcene from Algeria iam partner and trader withe fxclub.bie this is my link below
http://www.forexclub.biz/reg_real_account/?partner_code=DZA001IPB
since 2 years ago iam very happy withe my job and iam maried withe four children ihave learned withe the MOOC in yale university finacial markets my professor was Mer Robert
Best Regards
Lahcene
Lahcene Ouled Moussa
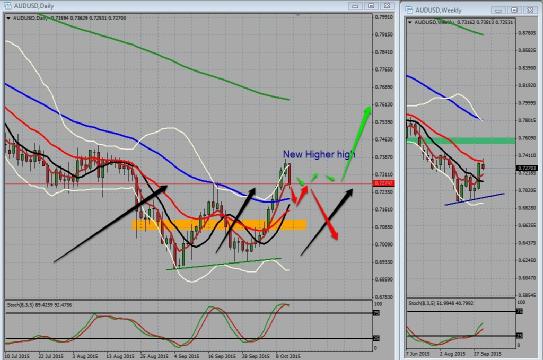
AUD/USD Retesting Old Resistance level @ 0.7280 on my daily chart. Now support after making a New Higher High breaking the 18th Sep 2015 High. ON my weekly chart you can see price touch 21 EMA (red line) which is acting has resistance… show more

소셜 네트워크에 공유 · 3
Lahcene Ouled Moussa
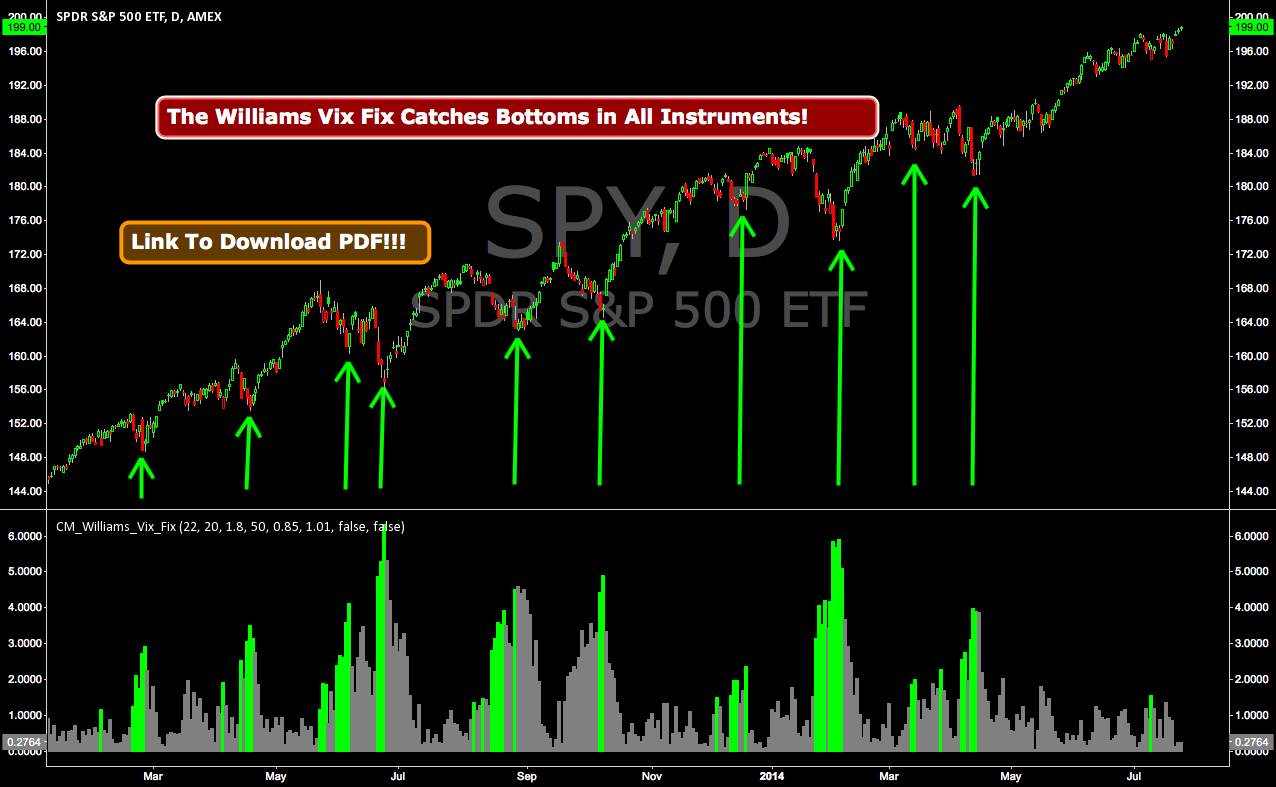
It Gives The Same Readings The VIX does for Stock Index’s…But This Indicator Works on All Asset Classes. I Customized The Settings Slightly To Create “Percentile” Based Highlight Bars…So You May Need To Adjust Slightly For Your Asset Class. These Are The Standard Settings Shown Here. Designed For Daily Charts…But Works GREAT On Intra-Day Charts!!! Download the PDF and

소셜 네트워크에 공유 · 1
Lahcene Ouled Moussa
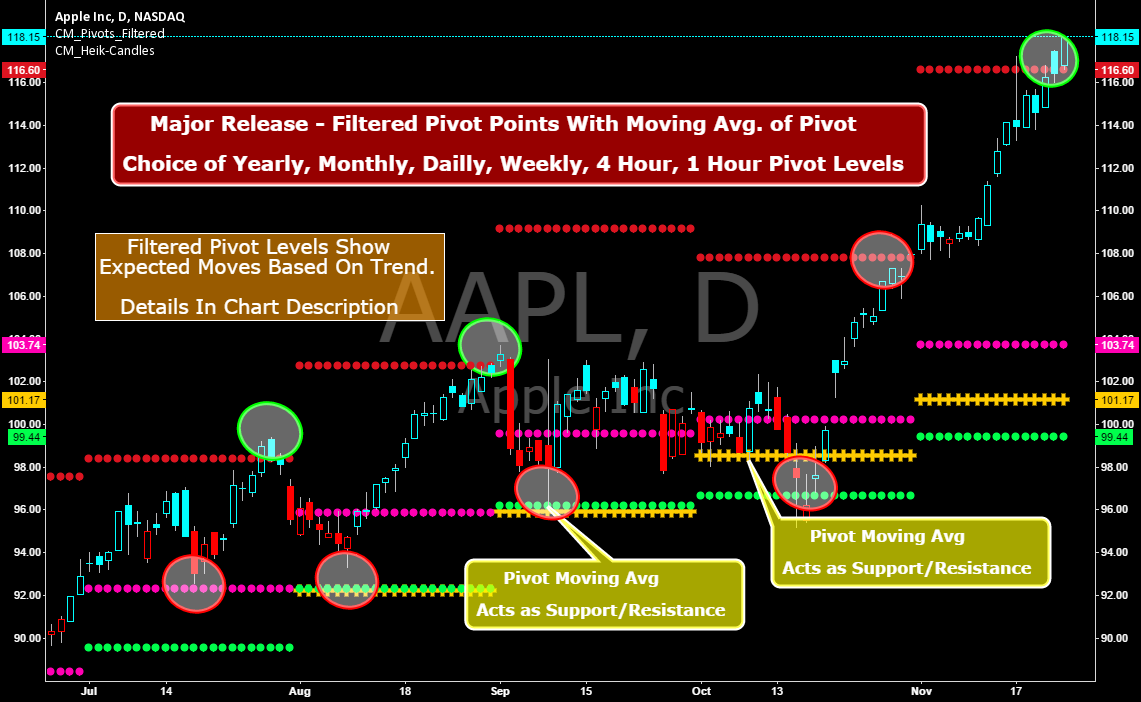
Famous Filtered Pivots Indicator -Many TimeFrames Available CM_Pivot Points_M-W-D-4H-1H_Filtered ***Special Thanks to TheLark...AKA...The Coding Genius For Providing His Expertise... ***New Feature - Ability to turn On/Off Pivot Moving Average ***New Feature - Ability to turn On/Off Filtered Pivots (Explained Below) Available Timeframes (Change In Inputs Tab): 1 Hour 4 Hour Daily Weekly Monthly Yearly ***All Features Available in Inputs Tab -Ability to Plot just 1, or all Pivot Timeframes -Defaults to Monthly Pivots -Ability to turn On/Off Pivot Moving Average -Ability to turn On/Off Filtered Pivots -Ability to Plot S3 and R3 on 1 Hour and 4 Hour

소셜 네트워크에 공유 · 1
Lahcene Ouled Moussa

Sling Shot System + Even Better System. I get this email about a Trend Following System that sells for $1000 but I could get it that day for only $500!!! I watch the video showing this Amazing System which may have taken me an entire minute to figure out the code. I code it up. And Hey…It’s not a bad system. It’s good for people who may need a Entry Signal to get them in a Trending Move, and KEEP them in a Trending Move while providing a defined Stop. So I thought I would save the community the Very Fair price of Only $500 for a system that consists of a couple of EMA’s and a few Rules…and give it to you for free. See Link Below for Main Chart Showing 2nd System!!!

Lahcene Ouled Moussa
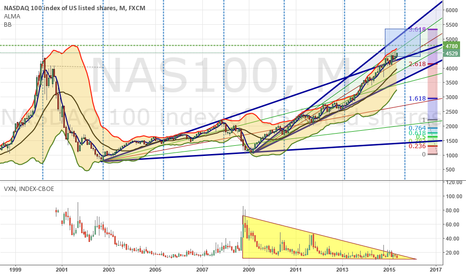
Using as a starting point the previous low points at 2002 and 2009, relevant pitch-fans were drawn. Of course the strength of NAS100 drove index values above the 2002 fan and if it continues at such a rate the previous high at about 4,780 will be reached. The extended 3.618 Fibonacci target (1.618 & 2.618 already covered) based…

Lahcene Ouled Moussa
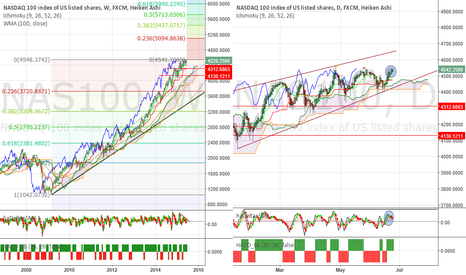
Weekly: More or less it is same as SP500 chart (pls see details in the other post), except that the "parabolic-supersonic" move was even more extreme in NAS100. - I just drew a Fibonacci retracement from the 2009 low to the recent top. We can see something very interesting now with this setup. If you check the retracement le…

Lahcene Ouled Moussa

Yet another index that is showing it's true colors. We're are very close to another financial turmoil here in the states. Be prepared to capitalize on this drop and do not be blindsided. Please do not listen to Kramer when he tells you to "Buy Buy Buy!!!" Thank you for your time and God bless you all!

Lahcene Ouled Moussa

Sling Shot System + Even Better System. I get this email about a Trend Following System that sells for $1000 but I could get it that day for only $500!!! I watch the video showing this Amazing System which may have taken me an entire minute to figure out the code. I code it up. And Hey…It’s not a bad system. It’s good for people who may need a Entry Signal to get them in a Trending Move, and KEEP them in a Trending Move while providing a defined Stop. So I thought I would save the community the Very Fair price of Only $500 for a system that consists of a couple of EMA’s and a few Rules…and give it to you for free. See Link Below for Main Chart Showing 2nd System!!!

Lahcene Ouled Moussa
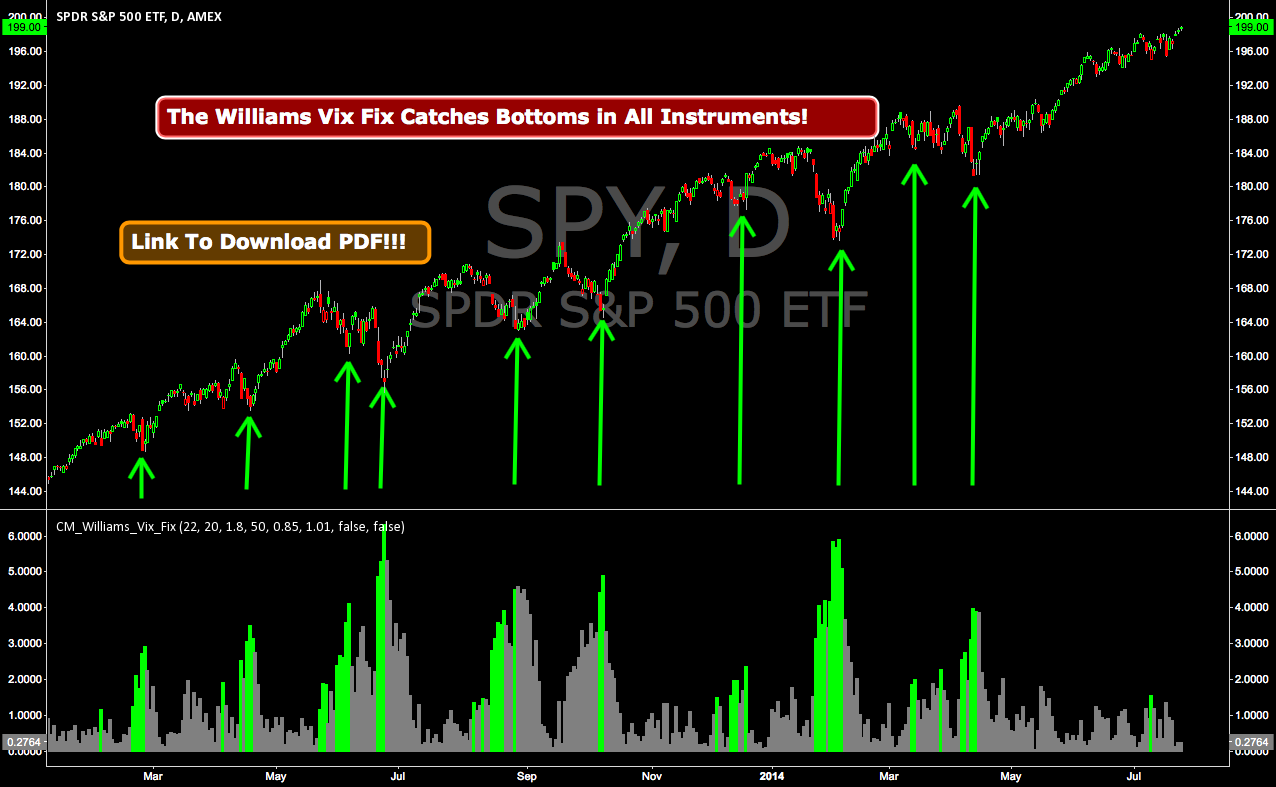
Larry Williams Developed This Incredible Indicator. It Gives The Same Readings The VIX does for Stock Index’s…But This Indicator Works on All Asset Classes. I Customized The Settings Slightly To Create “Percentile” Based Highlight Bars

소셜 네트워크에 공유 · 1
Lahcene Ouled Moussa


The Bahamas consists of over 700 exquisite islands, stretching over 100,000 square miles into the Western Atlantic. The clear emerald and turquoise waters lap along breathtaking beaches edged with miles of pale pink sand. Sun, sand, and sea are simply perimeters of the Islands of the Bahamas. At the core of the islands, you will find friendly people and a way of living that is both timeless and new. Whether it is the rich pirate heritage of bustling Nassau, the international glamour and dazzling hotels of Paradise Island or the sprawling resorts and secluded coves of Grand Bahama Island, travel to the Bahamas promises everything your heart desires. Explore historical sites, enjoy duty free shopping, swim with friendly dolphins, partake in glamorous nightlife or lie on one of hundreds of pristine beaches. Whatever you desire is here in the Bahamas.

소셜 네트워크에 공유 · 4
Lahcene Ouled Moussa
This script is the second version of the Moving average Ribbon Bar, a companion study of the MA Ribbon. In this version the display is changed, instead of lines, it display the results in stacked bars, making it more user friendly and allowing it to be expanded or contracted without loosing visual continuity.

소셜 네트워크에 공유 · 2
Lahcene Ouled Moussa
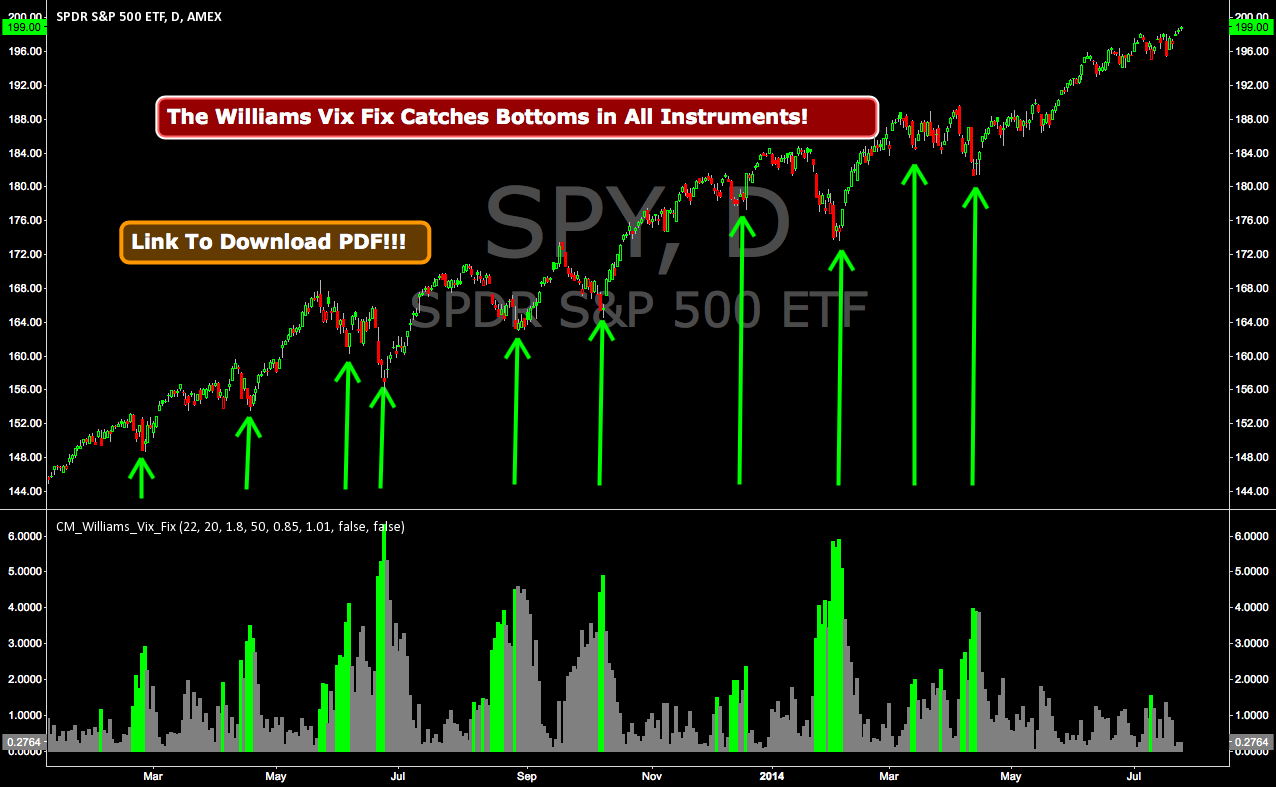
Larry Williams Developed This Incredible Indicator. It Gives The Same Readings The VIX does for Stock Index’s…But This Indicator Works on All Asset Classes. I Customized The Settings Slightly To Create “Percentile” Based Highlight Bars…So You May Need To Adjust Slightly For Your Asset Class. These Are The Standard Settings Shown Here. Designed For Daily Charts…But Works GREAT On Intra-Day Charts!!! Download the PDF and Read To Learn Larry’s

Lahcene Ouled Moussa

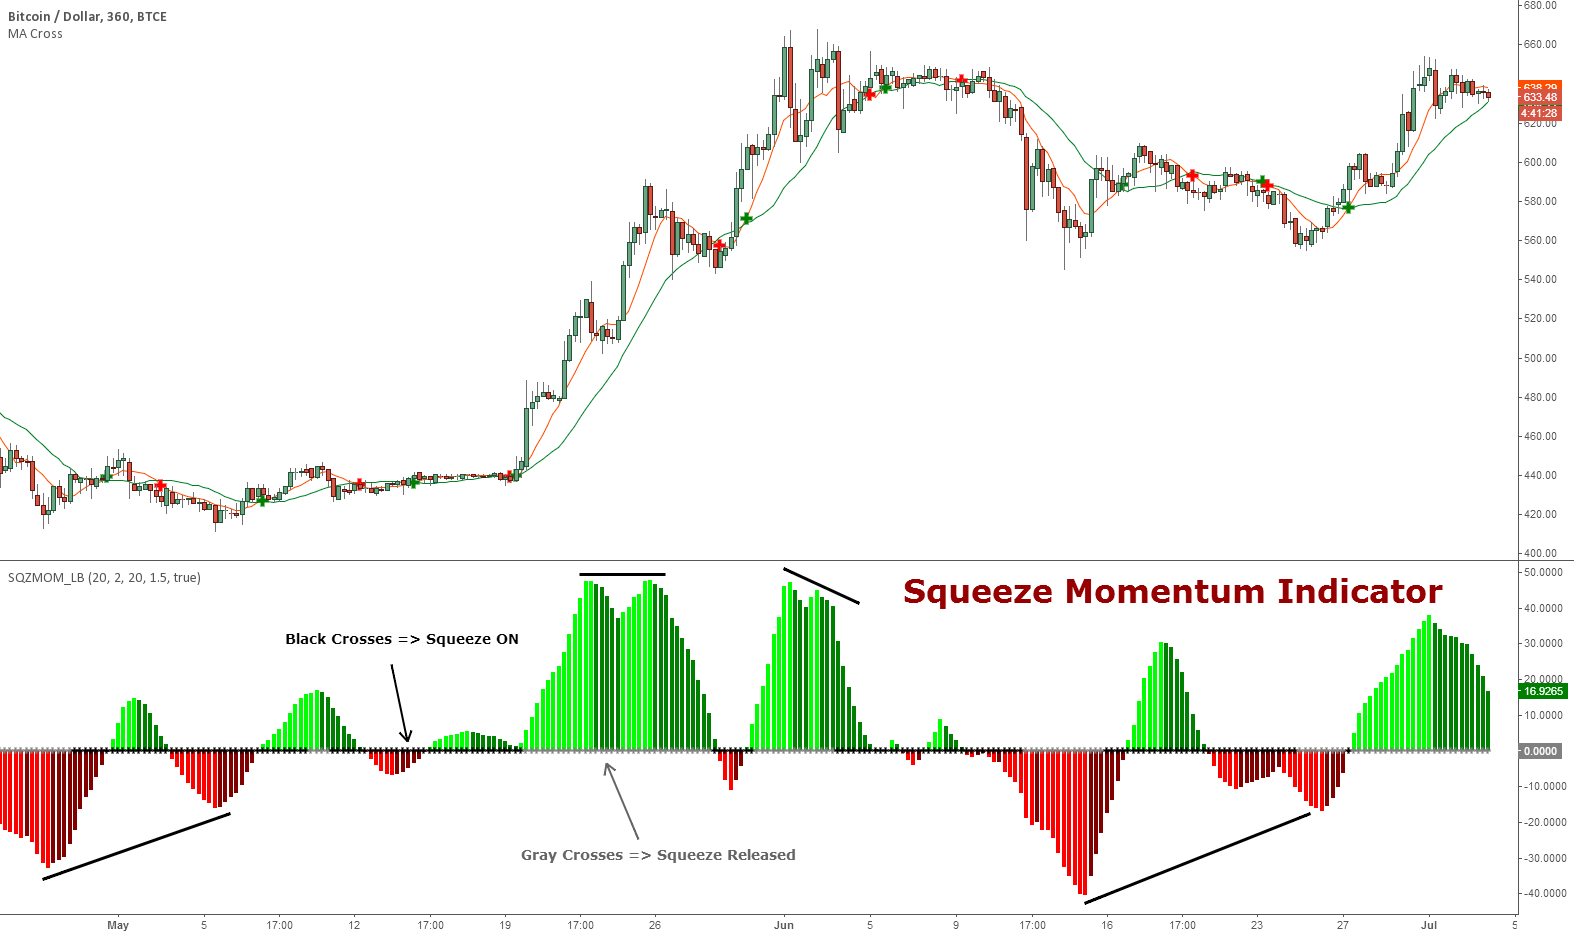
Fixed a typo in the code where BB multiplier was stuck at 1.5. Thanks @ucsgears for bringing it to my notice. Updated source: http://pastebin.com/UCpcX8d7 Use the updated source instead of the what TV shows below. This is a derivative of John Carter's "TTM Squeeze" volatility indicator, as discussed in his book "Mastering the Trade" (chapter 11). Black crosses on the midline show that the market just entered a squeeze (Bollinger Bands are with in Keltner Channel). This signifies low volatility, market preparing itself for an explosive move (up or down). Gray crosses signify "Squeeze release". Mr.Carter suggests waiting till the first gray after a black cross, and taking a position in the direction of the …

Lahcene Ouled Moussa
This script is the second version of the Moving average Ribbon Bar, a companion study of the MA Ribbon. In this version the display is changed, instead of lines, it display the results in stacked bars, making it more user friendly and allowing it to be expanded or contracted without loosing visual continuity.

Lahcene Ouled Moussa
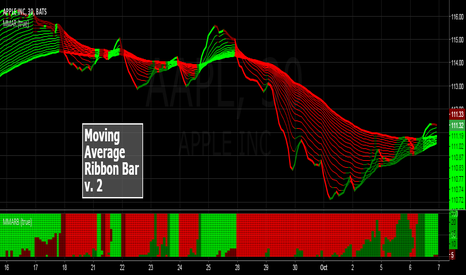
This script is the second version of the Moving average Ribbon Bar, a companion study of the MA Ribbon. In this version the display is changed, instead of lines, it display the results in stacked bars, making it more user friendly and allowing it to be expanded or contracted without loosing visual continuity.

소셜 네트워크에 공유 · 1
:

