Market Reality
- 지표
- Soghra Dejampisheh
- 버전: 1.0
- 활성화: 5
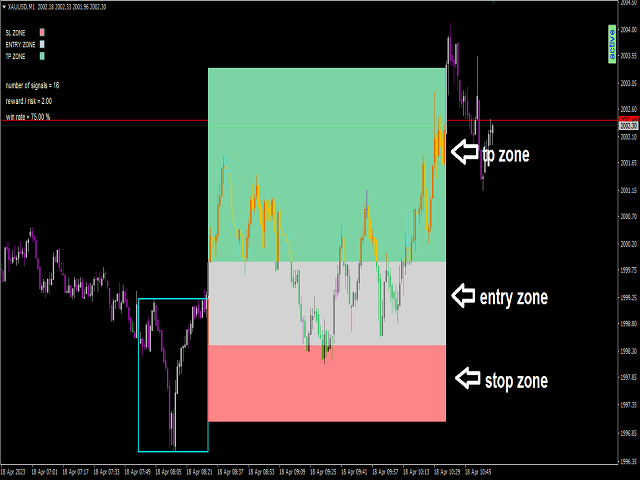
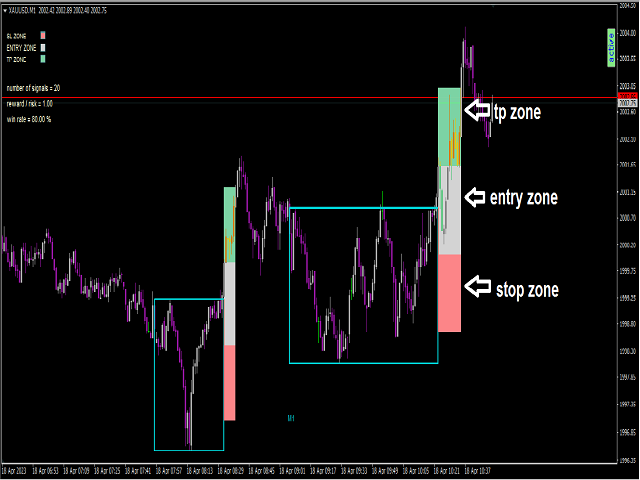
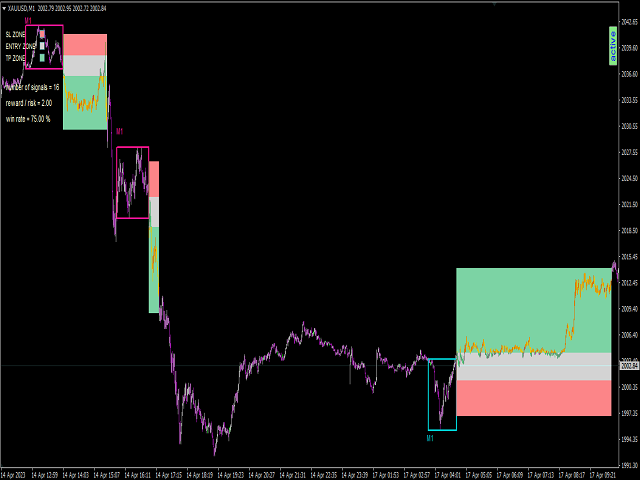
Hello, As you know more than 90% of people in the financial markets are losers, the most important reason is the lack of a proper fixed system and risk management. I want to introduce you to an indicator that is the result of my 8 years of experience, which shows you the reality of the market. My human dignity does not allow me to guarantee the future, but the table below shows the past statistics of this indicator and its performance which really the market past is the only way to find out the efficiency of the system. If you don't know anything about analysis and the market, you can act according to the signals of this indicator.
The results of the 2000 previous signals - time frame M1 - Risk/Reward = 1
XAUUSD
Around 71% win
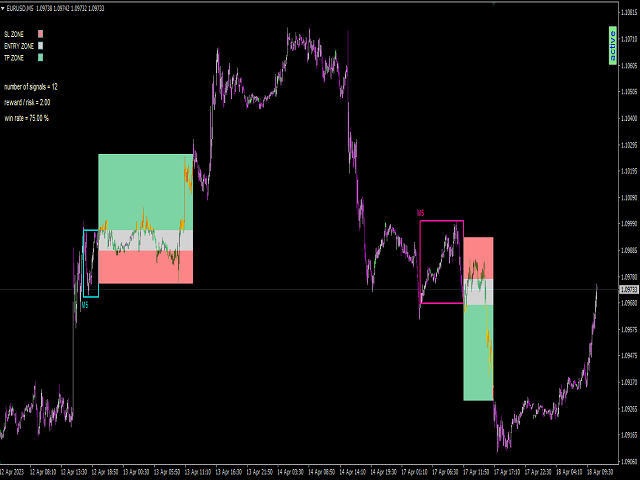
EURUSD
Around 69% win
GBPUSD
Around 67% win
NZDUSD
Around 67% win
USDJPY
Around 66% win
GBPJPY
Around 66% win
EURJPY
Around 65% win
Recommendations:
- currencies : XAUUSD - EURUSD - GBPUSD - NZDUSD - USDJPY - GBPJPY - EURJPY , but you can test all currencies.
- time farame : M1 but you can use other time frames.
Settings:
- Number of candles to calculate : X previous candles to calculate the indicator.
- Active indicator :you can active or deactive this indicator.
First, click on the active green button on the chart and then from the input settings of the indicator:active indicator--->NO.

This is a goo indicator currently testing it. it can detect some great entries works on all TF Recommended