• 미리보기
  • 리뷰
  • 코멘트
  • 새 소식

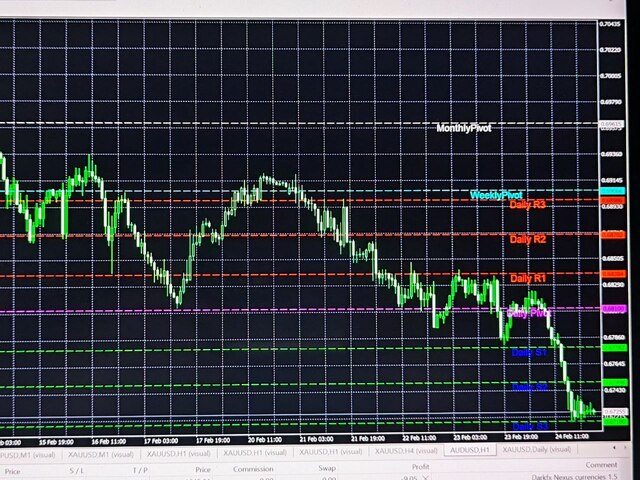
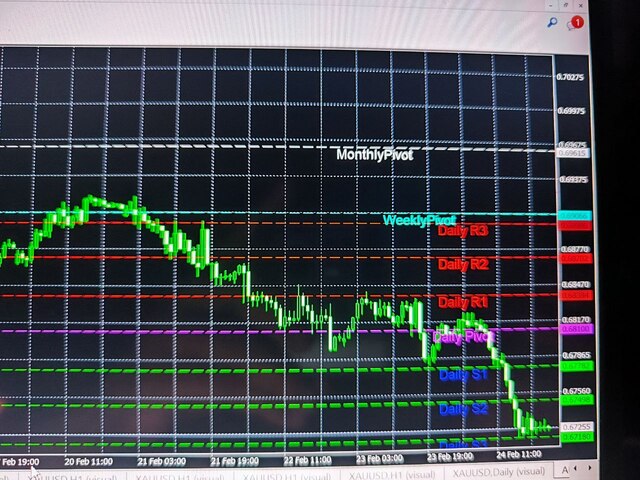
Darkfx Nexus Pivot Pro

This indictor is developed to help traders identify pivot levels in market . Some people also call it support and resistance levels or zones. We have finally publishing the most advanced pivot indicator in mql5 market because it is developed using accurate pivot zones only  . Remember always use bigger timeframes to get strong pivot levels. It will help you reversal trading. Visit our website from here
추천 제품
KT Horizontal Lines MT4
KEENBASE SOFTWARE SOLUTIONS
In MetaTrader, plotting multiple   horizontal lines   and then tracking their respective price levels can be a hassle. This indicator automatically plots multiple horizontal lines at equal intervals for setting price alerts, plotting support and resistance levels, and other manual purposes. This indicator is suitable for Forex traders who are new and looking for chances to make quick profits from buying and selling. Horizontal lines can help traders find possible areas to start trading when the
피봇 포인트 Fibo RSJ는 피보나치 비율을 사용하여 당일의 지지선과 저항선을 추적하는 지표입니다. 이 멋진 지표는 피보나치 비율을 사용하여 피벗 포인트를 통해 최대 7단계의 지지와 저항을 생성합니다. 가격이 작업의 가능한 진입/종료 지점을 인식할 수 있는 이 지원 및 저항의 각 수준을 어떻게 존중하는지 환상적입니다. 특징 최대 7단계 지원 및 7단계 저항 레벨의 색상을 개별적으로 설정 입력 피벗 유형 피벗 피보 RSJ1 = 피보 비율 1 계산 피벗 피보 RSJ2 = 피보 비율 2 계산 피벗 Fibo RSJ3 = Fibo 비율 3 계산 피벗 피보 클래식 = 클래식 피벗 계산 최소 피벗 수준 피벗 3 레벨 피벗 4 레벨 피벗 5 레벨 6단계 피벗 피벗 7 레벨 여전히 질문이 있는 경우 다이렉트 메시지로 저에게 연락하십시오: https://www.mql5.com/ko/users/robsjunqueira/
FREE
MP Demark Pivot Levels
Pierre Ksachikian
5 (1)
This indicator is stand alone version from  MP Pivot Levels  (All in one) containing Demark's Pivots. Calculations:     PP = X / 4     R1 = X / 2 - LOWprev     S1 = X / 2 - HIGHprev Uses: When the pair currency price may change the direction of movement. Possible constraints of support and resistance that creates plateaus for the currency pair prices. Tendency identification by comparing the present prices according to current day's pivot point and also the prior day's pivot points. ___________
FREE
MegaTrends
Sivakumar Subbaiya
1 (1)
Megatrends  Indicator   Time Frame: Suitable for any time frame.  Purpose: Trend Prediction. Blue and red color indicate the buy and sell call respectively. Buy: When the blue line is originating it is opened buy call. Sell: When the Red line is origination it is opened sell call Happy trade!! this indicator is suitable for all time frame, but our recommended time frame to use 1hour and 4 hours, suitable for any chart.
FREE
Trend Ray
Andriy Sydoruk
The indicator shows the potential trend direction by cyclical-wave dependence. Thus, all the rays of the intersection will be optimal rays, in the direction of which the price is expected to move, taking into account the indicator period. Rays can be used as a direction for potential market movement. But we must not forget that the approach must be comprehensive, the indicator signals require additional information to enter the market.
MQLTA Support Resistance Lines is an indicator that calculates the historical levels of Support and Resistance and display them as Lines on chart. It will also Alert you if the price is in a Safe or Dangerous zone to trade and show you the distance to the next level. The indicator is ideal to be used in other Expert Advisor through the iCustom function. This DEMO only works with AUDNZD, the full product can be found at https://www.mql5.com/en/market/product/26328 How does it work? The indicato
FREE
This indicator shows the latest untouched support and resistance as horizontal lines. The indicator can show support/resistance from higher timeframes. With this indicator you can e.g. easily see the support/resistance of the timeframes H4, D1 and W1 on a H1 chart, which can be a big advantage while time your entry on H1. This is the FREE version of the indicator: Support Resistance Multi Time Frame The free version works only on EURUSD and GBPUSD! Parameters referenceTF: the timeframe from wh
FREE
Support and Resistance Barry Indicator - Your Path to Precision Trading Explore the world of precision trading with the "Support and Resistance Barry Indicator" for MetaTrader 4. This robust tool is designed to help you identify key support and resistance levels with exceptional accuracy, enhancing your ability to make well-informed trading decisions. Basic Details : Indicator Type : Support and Resistance Barry Indicator Key Metrics : Real-time identification of crucial support and resistance l
TrendPlus
Sivakumar Subbaiya
4.38 (13)
Trend Plus   Trendplus  Indicator   Time Frame: Suitable for any time frame.  Purpose: Trend Prediction. Blue and red candle indicate the buy and sell call respectively. Buy: When the blue candle is formed buy call is initiated. close the buy trades when the next red candle will formed.   Sell: When the Red candle is formed Sell call is initiated. close the Sell trades when the next blue candle will formed.   Happy trade!!
FREE
이 표시기는 시장 분석을 위한 가장 효과적인 도구 중 하나인 피보나치 지원 및 저항 수준을 자동으로 계산하고 표시합니다. 계산은 선택한 기간 및 기간 동안의 평균 가격 데이터를 사용합니다. 이 기간의 최소값과 최대값은 이동의 시작과 끝으로 간주됩니다. 피보나치 수준을 사용하면 가격 움직임이 느려지거나 역전될 수 있는 잠재적인 기준점을 볼 수 있습니다. 즉, 추가 움직임을 예측하고 정지 및 지정가 주문을 하는 데 사용됩니다. 매개변수: PartsShow - 현재 막대에서 표시된 과거 레벨의 수 CalcPeriod - 가격 평균화 기간 SmoothingMethod - 가격 평균화 방법(26개 옵션) TF - 계산에 사용되는 기간 LevelColor - 레벨 라인의 색상 ZeroLevelColor - 제로 레벨 색상 ShowVerticalLine - 레벨 사이의 수직선 표시 활성화/비활성화 VLineStyle - 수직선의 스타일 VLineColor - 수직선의 색상 ShowInfo - 레
Trend arrow Indicator
NGUYEN NGHIEM DUY
3.23 (13)
Trend arrow Indicator is an arrow Indicator used as an assistant tool for your trading strategy. The indicator analyzes the standard deviation of bar close for a given period and generates a buy or sell signals if the deviation increases. It good to combo with Martingale EA to follow Trend and Sellect Buy Only/Sell Only for EA work Semi-Automatic. You can use this  Indicator with any EAs in my Products.
FREE
Pivot Points MT4
KEENBASE SOFTWARE SOLUTIONS
KT Pivot Points automatically plots the daily, weekly, and monthly pivot levels on a chart with the precise calculation based on the latest data. Pivot points is a widely used indicator in technical analysis, particularly in the Forex market. Features Send alerts when the price touches the pivot level.  It offers complete customization for each kind of pivot level.   Shows daily, weekly, and monthly pivot levels without any fuss. It uses minimum CPU resources for faster calculation. Compati
Make It Horizontal
JUAN LUIS CIENFUEGOS RUIZ
1 (1)
"Make it Horizontal" will convert any trendline to horizontal by just selecting it and then pressing the H key. This tool must be included in your charts as an indicator. It has no inputs, just drag it to your charts and that's it! I created this tool because the MT4 doesn't have any built-in feature like this. How many times have you drawn a line and you need to double click it in order to configure the start and end price level so you can make it horizontal? Well, that's not an issue anymore!
Wicks UpDown Target GJ Wicks UpDown Target GJ is specialized in GJ forex pairs. Choppy movement up and down on the opening range every day.  Trading breakouts on London session and New York session is recommended. Guideline Entry Strategy Idea: Step 1 - Breakout Forming (Warning! Trade on London Session and New York Session) Step 2 - Breakout Starting (Take Action on your trading plan) Step 3 - Partial Close your order & set breakeven (no-risk) Step 4 - Target complete Step 5 - Don't tr
FREE
Are you tired of drawing trendlines every time you're analyzing charts? Or perhaps you would like more consistency in your technical analysis. Then this is for you. This indicator will draw trend lines automatically when dropped on a chart. How it works Works similar to standard deviation channel found on mt4 and mt5. It has 2 parameters: 1. Starting Bar 2. Number of bars for calculation The   starting bar   is the bar which drawing of the trend lines will begin, while the   number of bars for c
FREE
NOTE: PRICE WILL RISE VERY SOON. DON'T SKIP THIS OFFER! Dear traders I am glad to introduce the " Market Swing Scanner Board" indicator to you. This indicator was made mainly to be used in combination with the Market Swing Index Indicator. You use the  "Market Swing Scanner Board"  indicator to scan for trading opportunities on the  Market Swing Index Indicator . This tool is designed for serious traders who have decided to make a difference through trading. Be the next person to witness this st
The indicator,   Support and Resistance Detect Signal   automatically detects support and resistance levels and trend lines, emitting a signal whenever the condition is met, as configured. It reads support and resistance drawn manually or automatically built into the chart by other external indicators. Note:   Support and Resistance Detect Signal   is compatible with almost all external indicators that draw on the chart, support and resistance levels, in addition to trend lines. Discover
Reversal Area Indicator
Shiffolika Kapila
5 (2)
REVERSAL AREA INDICATOR  This Indicator will generate signals on top and bottom of the swings . It will check for some support and resistance found and generate the signals at such areas. There is high probability of the price moving in favorable directions as they are signals when there is support and resistance . The advantage is that the entries will have small stop loss and high risk to reward ratios as they are near tops and bottoms. 1.       This is an indicator that will provid
Are you tired of drawing Support & Resistance levels for all charts of the same Symbol while doing Multi-Timeframe analysis? Well, if you are a Price Action trader then this indicator will solve your problem. Draw on 1 Timeframe and it will auto-sync with other charts of the same Symbol. You can draw rectangles, lines, and eclipse. It will give an alert when touched/break on line. It work's on all Timeframes. Major Update Added:: 1}triangle 2}Fibonacci Retracement 3}Text Lable 4}Up/Down Arrow
Level Scanner
Thushara Dissanayake
레벨 스캐너   지표는 모든   지원 및 저항 수준   과 함께 차트에서   상위   및   하위   영역 식별을 자동화하도록 설계된 강력한 도구입니다.   Hull 이동 평균   의 사용을 통합하여 실제 추세를 보다 명확하고 매끄럽게 표현합니다. 이 지표는 놀라운 속도로 작동하여 트레이더가 주요 관심 영역을 신속하게 식별하고 정보에 입각한 거래 결정을 내릴 수 있도록 합니다. 레벨 스캐너의 뛰어난 기능 중 하나는 다용도성입니다. 모든 종목 및 시간대에 적용할 수 있어 다양한 거래 전략에 적합합니다. 이 지표는 신호를 효율적으로 생성하여 트레이더가 잠재적인 거래 설정을 신속하게 식별할 수 있도록 합니다. 또한 개별 거래 전략 및 선호도에 맞게 완전히 맞춤화할 수 있는 사용자 친화적 매개변수를 제공합니다. 거래자는 자신의 기간, CCI, RSI 및 스토캐스틱 지표를 통해 신호를 필터링하여 신호를 더욱 세분화할 수 있습니다. 이 기능을 통해 트레이더는 지표의 출력을 특정 요구 사항 및
Camarilla Pivot Points is a math-based price action analysis tool that generates potential   intraday support and resistance levels.  Pivot price values are stored in output buffers within this indicator, enabling any Expert Advisor to utilize this indicator's data for trading purposes. This indicator offers the potential for developing numerous strategies. To explore some of these strategies, please visit the following websites:  https://www.babypips.com/forexpedia/camarilla-pivot-points https:
Resistance and support zones indicator
Jose Daniel Stromberg Martinez
This is a very complex indicator that calculates resistance and supportlevels. When the calculation is done, it merges levels that are close to eachother. It support different timeframes, simply by changing timeframe. Features: See support and resistance levels Alarm can be set off when price enters a support/resistance zone Different timeframes See screenshots for visual.
This indicator is based on Mr. Mark Fisher's ACD strategy, based on the book "The Logical Trader." - OR lines - A lines - C lines - Daily pivot range - N days pivot range - Customizable trading session - Drawing OR with the desired time Drawing levels A and C based on daily ATR or constant number - Possibility to display daily and last day pivots in color zone - Displaying the status of daily PMAs (layer 4) in the corner of the chart - Show the order of daily pivot placement with multi-day
FREE
Two Period RSI
Libertas LLC
4.5 (8)
Two Period RSI compares long-term and short-term RSI lines, and plots a fill between them for improved visualization. Fill is colored differently according to an uptrend (short period RSI above long period RSI) or a downtrend (short period RSI below long period RSI). Short-term RSI crossing long-term RSI adds a more robust trend confirmation signal than using single period RSI alone. This is a small tool to help visualize and confirm RSI trends. We hope you enjoy! Looking for RSI alerts? You can
FREE
Free automatic fibonacci
Tonny Obare
4.63 (59)
Free automatic Fibonacci is an indicator that automatically plots a Fibonacci retracement based on the number of bars you select on the BarsToScan setting in the indicator. The Fibonacci is automatically updated in real time as new highest and lowest values appears amongst the selected bars. You can select which level values to be displayed in the indicator settings. You can also select the color of the levels thus enabling the trader to be able to attach the indicator several times with differe
FREE
This indicator scans for you up to 30 trading instruments and up to 8 timeframes for occurrences of the high probability reversal patterns: Double Tops/Bottoms with fake breakouts . Please read also the blog post " Professional Trading With Double Tops/Bottoms And Divergences! " which explains the concepts behind the ULTIMATE Double Top/Bottom indicator and how you can use a professional top-down approach. This FREE Version of the Scanner scans only EURUSD and GBPUSD. The full version of the sca
FREE
"Adjustable Fractals" - 프랙탈 표시기의 고급 버전으로 매우 유용한 거래 도구입니다! 우리가 알고 있듯이 표준 프랙탈 mt4 표시기에는 설정이 전혀 없습니다. 이는 거래자에게 매우 불편합니다. 조정 가능한 프랙탈(Adjustable Fractals)이 해당 문제를 해결했습니다. 필요한 모든 설정이 포함되어 있습니다. 조정 가능한 표시 기간(권장 값 - 7 이상) 고점/저점과의 거리 조절 가능 프랙탈 화살표에 따라 조정 가능한 디자인 // 더 훌륭한 전문가 자문 및 지표는 여기에서 확인할 수 있습니다: https://www.mql5.com/en/users/def1380/seller // 또한 수익성 있고 안정적이며 신뢰할 수 있는 신호 https://www.mql5.com/en/signals/1887493에 참여하실 수 있습니다. 본 MQL5 홈페이지에서만 제공되는 오리지널 제품입니다.
MT4에 대한 외환 지표 "지원 저항 수준" 지표 "지원 저항 수준"은 거래에 매우 유용한 보조 지표입니다. '지지'와 '저항'은 차트에서 가격으로 존중되는 중요한 영역입니다. 지지 수준은 가격이 정기적으로 하락을 멈추고 다시 반등하는 수준입니다. 저항 수준은 일반적으로 가격이 상승을 멈추고 다시 하락하는 지점입니다. 표시기 "지원 저항 수준"은 최근 수준을 보여줍니다. 저항 수준 - 빨간색 선. 지원 수준 - 파란색 선 계산에 사용되는 막대 수, 선 유형 및 색상은 설정에서 조정할 수 있습니다. 지표 "지원 저항 수준"은 가격 조치 패턴을 통해 이익실현 목표, 가격 반전 및 재테스트를 계획하는 데 유용합니다. // 더 훌륭한 전문가 자문 및 지표는 여기에서 확인할 수 있습니다: https://www.mql5.com/en/users/def1380/seller // 또한 수익성 있고 안정적이며 신뢰할 수 있는 신호 https://www.mql5.com/en/signals/18
Super Auto Fibonacci
Muhammed Emin Ugur
Discover the power of precision and efficiency in your trading with the " Super Auto Fibonacci " MT4 indicator. This cutting-edge tool is meticulously designed to enhance your technical analysis, providing you with invaluable insights to make informed trading decisions. Key Features: Automated Fibonacci Analysis: Say goodbye to the hassle of manual Fibonacci retracement and extension drawing. "Super Auto Fibonacci" instantly identifies and plots Fibonacci levels on your MT4 chart, saving you tim
FREE
PZ Trendlines
PZ TRADING SLU
4.6 (10)
Tired of plotting trendlines? The PZ TrendLines indicator applies a mechanical approach to the construction of trend lines for you!  [ Installation Guide | Update Guide | Troubleshooting | FAQ | All Products ] It can draw up to 18 trendlines Trendlines can be optionally based on fractals Each line represents a breakout level Each trendline can be broken or rejected Configurable amount of lines Configurable colors Support I am happy to provide free products but given my limited time, they come
FREE
이 제품의 구매자들이 또한 구매함
Gann Made Easy
Oleg Rodin
4.95 (44)
Gann Made Easy 는 mr.의 이론을 사용하여 최고의 거래 원칙을 기반으로 하는 전문적이고 사용하기 쉬운 Forex 거래 시스템입니다. W.D. 간. 이 표시기는 Stop Loss 및 Take Profit Levels를 포함하여 정확한 BUY 및 SELL 신호를 제공합니다. PUSH 알림을 사용하여 이동 중에도 거래할 수 있습니다. 구매 후 연락주세요! 내 거래 팁과 훌륭한 보너스 지표를 무료로 공유하겠습니다! 아마도 Gann 거래 방법에 대해 이미 여러 번 들었을 것입니다. 일반적으로 Gann의 이론은 초보자 거래자뿐만 아니라 이미 거래 경험이 있는 사람들에게도 매우 복잡한 것입니다. Gann의 거래 방식은 이론적으로 적용하기 쉽지 않기 때문입니다. 나는 그 지식을 연마하고 Forex 지표에 최고의 원칙을 적용하기 위해 몇 년을 보냈습니다. 표시기는 적용하기가 매우 쉽습니다. 차트에 첨부하고 간단한 거래 권장 사항을 따르기만 하면 됩니다. 지표는 지속적으로 시장 분석 작업
기적적인 외환 지표 소개: 정확한 트레이딩의 힘을 발휘하세요 모든 시간대에서 뛰어난 결과를 제공하는 최고의 외환 지표를 찾는데 지친 적이 있나요? 더 이상 찾을 필요가 없습니다! 기적적인 외환 지표가 도래하여 귀하의 트레이딩 경험을 혁신하고 수익을 새로운 고도로 끌어올립니다. 최첨단 기술과 수년간의 정성스런 개발을 토대로 기적적인 외환 지표는 외환 시장에서의 힘과 정확성의 정점으로 떠오릅니다. 이 탁월한 도구는 모든 수준의 트레이더의 요구를 충족시키고 지속적인 수익을 추구하는 데에서 비길 데 없는 우위를 제공하기 위해 설계되었습니다. 기적적인 외환 지표의 가장 큰 장점은 그 뛰어난 적응성에 있습니다. 당신이 데이 트레이더, 스윙 트레이더이든 장기 포지션을 선호하든, 이 지표는 모든 시간대에서 뛰어난 결과를 제공하기 위해 최적화되었습니다. 그러나 그 정확성과 시장의 복잡한 움직임을 포착하는 능력이 참으로 빛을 발하는 것은 1시간 기간대에서 사용할 때입니다. 기적적인 외환 지표의 정확성
현재 20% 할인 ! 초보자 또는 전문가 트레이더를 위한 최고의 솔루션! 이 대시보드 소프트웨어는 28개의 통화 쌍에서 작동합니다. 2가지 주요 지표(Advanced Currency Strength 28 및 Advanced Currency Impulse)를 기반으로 합니다. 전체 Forex 시장에 대한 훌륭한 개요를 제공합니다. 고급 통화 강도 값, 통화 이동 속도 및 모든(9) 시간대의 28 Forex 쌍에 대한 신호를 보여줍니다. 추세 및/또는 스캘핑 기회를 정확히 파악하기 위해 차트의 단일 지표를 사용하여 전체 시장을 볼 수 있을 때 거래가 어떻게 개선될지 상상해 보십시오! 잠재적인 거래를 식별하고 확인하면서 강력한 통화와 약한 통화를 더욱 쉽게 식별할 수 있도록 이 지표에 기능을 내장했습니다. 이 표시기는 통화의 강세 또는 약세가 증가 또는 감소하는지 여부와 모든 시간대에서 수행되는 방식을 그래픽으로 보여줍니다. 추가된 새로운 기능은 현재 시장 조건 변화에 적
TPSpro RFI Levels
Roman Podpora
5 (13)
A key element in trading is zones or levels from which decisions to buy or sell a trading instrument are made. Despite attempts by major players to conceal their presence in the market, they inevitably leave traces. Our task was to learn how to identify these traces and interpret them correctly. Reversal First Impulse levels (RFI)   -  Version MT5                INSTRUCTIONS                 RUS                 ENG                                       R ecommended to use with an indicator   -  
TPSproTREND PrO
Roman Podpora
5 (15)
TPSpro TRENDPRO  - is a trend indicator that automatically analyzes the market and provides information about the trend and each of its changes, as well as giving signals for entering trades without redrawing! The indicator uses each candle, analyzing them separately. referring to different impulses - up or down impulse. Exact entry points into transactions for currencies, crypto, metals, stocks, indices!  -  Version MT5               DETAILED DESCRIPTION        /       TRADING SETUPS           
Atomic Analyst
Issam Kassas
5 (1)
우선적으로 언급할 점은이 거래 지표가 다시 그리지 않고 지연되지 않으며 이를 통해 수동 및 로봇 거래 모두에 이상적이라는 점입니다. Atomic Analyst는 가격의 강도와 모멘텀을 활용하여 시장에서 더 나은 이점을 찾는 PA Price Action Indicator입니다. 고급 필터를 장착하여 잡음과 거짓 신호를 제거하고 거래 잠재력을 높이는 데 도움이 됩니다. 복잡한 지표의 다중 레이어를 사용하여 Atomic Analyst는 차트를 스캔하고 복잡한 수학적 계산을 간단한 신호와 색상으로 변환하여 초보 트레이더가 이해하고 일관된 거래 결정을 내릴 수 있도록합니다. "Atomic Analyst"는 새로운 및 경험이 풍부한 트레이더를위한 종합적인 거래 솔루션입니다. 프리미엄 지표와 최고 수준의 기능을 하나의 거래 전략에 결합하여 모든 종류의 트레이더에 대한 다재다능한 선택지가되었습니다. 인트라데이 거래 및 스캘핑 전략 : 빠르고 정확한 일일 거래 및 단기 거래를 위해 설계
Advanced Currency Strength28 Indicator
Bernhard Schweigert
4.9 (662)
현재 26% 할인 초보자 또는 전문가 트레이더를 위한 최고의 솔루션! 이 지표는 우리가 독점 기능과 새로운 공식을 통합했기 때문에 독특하고 고품질이며 저렴한 거래 도구입니다. 단 하나의 차트로 28 Forex 쌍의 통화 강도를 읽을 수 있습니다! 새로운 추세 또는 스캘핑 기회의 정확한 트리거 포인트를 정확히 찾아낼 수 있기 때문에 거래가 어떻게 개선될지 상상해 보십시오. 사용 설명서: 여기를 클릭  https://www.mql5.com/en/blogs/post/697384 그것이 첫 번째, 원본입니다! 쓸모없는 지망생 클론을 사지 마십시오. 더 스페셜  강력한 통화 모멘텀을 보여주는 하위 창의 화살표 GAP가 거래를 안내합니다! 기본 또는 호가 통화가 과매도/과매도 영역(외부 시장 피보나치 수준)에 있을 때 개별 차트의 기본 창에 경고 표시가 나타납니다. 통화 강도가 외부 범위에서 떨어질 때 풀백/반전 경고. 교차 패턴의 특별 경고 추세를 빠르게 볼 수 있는
Scalper Inside PRO
Alexey Minkov
4.75 (55)
An exclusive indicator that utilizes an innovative algorithm to swiftly and accurately determine the market trend. The indicator automatically calculates opening, closing, and profit levels, providing detailed trading statistics. With these features, you can choose the most appropriate trading instrument for the current market conditions. Additionally, you can easily integrate your own arrow indicators into Scalper Inside Pro to quickly evaluate their statistics and profitability. Scalper Inside
Trend Screener
STE S.S.COMPANY
4.83 (86)
트렌드 표시기, 트렌드 트레이딩 및 필터링을 위한 획기적인 고유 솔루션, 하나의 도구 안에 내장된 모든 중요한 트렌드 기능! Forex, 상품, 암호 화폐, 지수 및 주식과 같은 모든 기호/도구에 사용할 수 있는 100% 다시 칠하지 않는 다중 시간 프레임 및 다중 통화 표시기입니다. Trend Screener는 차트에 점이 있는 화살표 추세 신호를 제공하는 효율적인 지표 추세 추종 지표입니다. 추세 분석기 표시기에서 사용할 수 있는 기능: 1. 트렌드 스캐너. 2. 최대 이익 분석이 있는 추세선. 3. 추세 통화 강도 측정기. 4. 경고가 있는 추세 반전 점. 5. 경고가 있는 강력한 추세 점. 6. 추세 화살표 Trend Screener Indicator가 있는 일일 분석 예, 일일 신호 성능...등은 여기에서 찾을 수 있습니다.   여기를 클릭하십시오. LIMITED TIME OFFER : Trend Screener Indicator는 50 $ 및 평생 동안만 사용할 수 있
Quantum Trend Sniper Indicator MT4
Bogdan Ion Puscasu
4.59 (39)
소개       Quantum Trend Sniper Indicator는   추세 반전을 식별하고 거래하는 방식을 변화시키는 획기적인 MQL5 지표입니다! 13년 이상의 거래 경험을 가진 숙련된 트레이더 팀이 개발한       Quantum Trend Sniper 표시기       매우 높은 정확도로 추세 반전을 식별하는 혁신적인 방법으로 거래 여정을 새로운 차원으로 끌어올리도록 설계되었습니다. ***Quantum Trend Sniper Indicator를 구입하면 Quantum Breakout Indicator를 무료로 받을 수 있습니다!*** Quantum Trend Sniper Indicator는 추세 반전을 식별하고 세 가지 이익실현 수준을 제안할 때 경고, 신호 화살표를 제공합니다. 초보자 거래자와 전문 거래자 모두에게 적합합니다. Quantum EA 채널:       여기를 클릭하세요 MT5 버전:       여기를 클릭하세요
TrendMaestro
Stefano Frisetti
5 (2)
note: this indicator is for METATRADER4, if you want the version for METATRADER5 this is the link: TRENDMAESTRO recognizes a new TREND in the bud, he never makes mistakes. The certainty of identifying a new TREND is priceless. DESCRIPTION TRENDMAESTRO identifies a new TREND in the bud, this indicator examines the volatility, volumes and momentum to identify the moment in which there is an explosion of one or more of these data and therefore the moment in which prices have strong probability of f
우선적으로, 이 거래 도구는 전문적인 거래에 이상적인 비-다시 그리기 및 지연되지 않는 지표입니다.  스마트 가격 액션 컨셉트 인디케이터는 신규 및 경험 많은 트레이더 모두에게 매우 강력한 도구입니다. Inner Circle Trader Analysis 및 Smart Money Concepts Trading Strategies와 같은 고급 거래 아이디어를 결합하여 20가지 이상의 유용한 지표를 하나로 결합합니다. 이 인디케이터는 스마트 머니 컨셉트에 중점을 두어 대형 기관의 거래 방식을 제공하고 이동을 예측하는 데 도움을 줍니다.  특히 유동성 분석에 뛰어나 기관이 어떻게 거래하는지 이해하는 데 도움을 줍니다. 시장 트렌드를 예측하고 가격 변동을 신중하게 분석하는 데 탁월합니다. 귀하의 거래를 기관 전략에 맞추어 시장의 동향에 대해 더 정확한 예측을 할 수 있습니다. 이 인디케이터는 시장 구조를 분석하고 중요한 주문 블록을 식별하고 다양한 패턴을 인식하는 데 뛰어납니다. 
Currency Strength Wizard
Oleg Rodin
4.91 (44)
통화 강도 마법사는 성공적인 거래를 위한 올인원 솔루션을 제공하는 매우 강력한 지표입니다. 표시기는 여러 시간 프레임의 모든 통화 데이터를 사용하여 이 또는 해당 외환 쌍의 힘을 계산합니다. 이 데이터는 특정 통화의 힘을 확인하는 데 사용할 수 있는 사용하기 쉬운 통화 지수 및 통화 전력선의 형태로 표시됩니다. 필요한 것은 거래하려는 차트에 표시기를 부착하는 것뿐입니다. 표시기는 거래하는 통화의 실제 강세를 보여줍니다. 지표는 또한 추세와 거래할 때 유리하게 사용할 수 있는 구매 및 판매 거래량 압력의 극한값을 보여줍니다. 지표는 또한 피보나치에 기반한 가능한 대상을 보여줍니다. 표시기는 PUSH 알림을 포함한 모든 유형의 알림을 제공합니다. 구매 후 연락주세요. 나는 당신과 거래 팁을 공유하고 당신에게 무료로 훌륭한 보너스 지표를 줄 것입니다! 나는 당신에게 행복하고 유익한 거래를 기원합니다!
XQ Indicator MetaTrader 4
Marzena Maria Szmit
3 (2)
Step into the realm of Forex trading with confidence and precision using XQ, a cutting-edge Forex indicator designed to elevate your trading game to unprecedented heights. Whether you're a seasoned trader or just stepping into the world of currency exchange,   XQ Forex Indicator   empowers you with the insights and signals needed to make informed trading decisions. The signal conditions are a combination of three indicators, and XQ Forex Indicator only display  medium and long-term trends . The
맞춤형 MT4 지표로 성공적인 외환 거래에 대한 비밀을 발견하십시오! 외환 시장에서 성공을 달성하고 위험을 최소화하면서 일관되게 이익을 얻는 방법을 궁금해 한 적이 있습니까? 여기에 당신이 찾고 있던 답이 있습니다! 거래에 대한 귀하의 접근 방식을 혁신 할 독점적 MT4 지표를 소개 할 수 있습니다. 독특한 다양성 우리의 지표는 Renko 및 Rangebar Candle Formations를 선호하는 사용자를 위해 특별히 설계되었습니다. 우리는 이러한 차트 유형이 많은 숙련 된 거래자들이 선호한다는 것을 이해하기 때문에 우리의 지표가 그들과 완벽하게 통합되어 비교할 수없는 시장 분석을 제공합니다. 명확한 추세 신호 복잡한 분석을 잊어 버리십시오! 우리의 지표는 생생한 색상과 명확한 점 구조를 사용하여 시장 동향을 명확하게 나타냅니다. 빨간색과 파란색 점은 가격 이동 방향에 대해 의심의 여지가 없어 거래에서 빠른 의사 결정을 할 수 있습니다. HH/HL HL/LL
Advanced Supply Demand
Bernhard Schweigert
4.92 (310)
현재 33% 할인! 초보자나 전문 트레이더를 위한 최고의 솔루션! 이 보조지표는 우리가 다수의 독창적 기능과 새로운 공식을 통합한 독특하고 고품질이며 저렴한 거래 도구입니다. 이 업데이트를 통해 이중 시간대를 표시할 수 있습니다. 더 높은 TF를 표시할 수 있을 뿐만 아니라 차트 TF와 더 높은 TF 모두를 표시할 수 있습니다: 중첩 영역 표시. 모든 Supply Demand 트레이더들이 좋아할 것입니다. :) 중요한 정보 공개 Advanced Supply Demand의 잠재력을 극대화하려면 다음을 방문하십시오. https://www.mql5.com/ko/blogs/post/720245   진입 또는 목표의 명확한 트리거 포인트를 정확히 찾아냄으로 해서 거래가 어떻게 개선될지 상상해 보십시오. 새로운 알고리즘을 기반으로 매수자와 매도자 간의 잠재적인 불균형을 훨씬 더 쉽게 분간할 수 있습니다. 왜냐하면 가장 강한 공급영역과 가장 강한 수요 영역과 과거에 어떻게 진행 되었는지를(이
Quantum Breakout Indicator PRO
Bogdan Ion Puscasu
4.96 (26)
소개       Quantum Breakout PRO   , 브레이크아웃 존 거래 방식을 변화시키는 획기적인 MQL5 지표! 13년 이상의 거래 경험을 가진 숙련된 트레이더 팀이 개발한   Quantum Breakout PRO는   혁신적이고 역동적인 브레이크아웃 영역 전략으로 거래 여정을 새로운 차원으로 끌어올리도록 설계되었습니다. Quantum Breakout Indicator는 5개의 이익 목표 영역이 있는 브레이크아웃 영역의 신호 화살표와 브레이크아웃 상자를 기반으로 한 손절 제안을 제공합니다. 초보자 거래자와 전문 거래자 모두에게 적합합니다. Quantum EA 채널:       여기를 클릭하세요 MT5 버전 :   여기를 클릭하세요 중요한! 구매 후 설치 매뉴얼을 받으려면 개인 메시지를 보내주십시오. 추천: 기간: M15 통화쌍: GBPJPY, EURJPY, USDJPY,NZDUSD, XAUUSD 계정 유형: 스프레드가 매우 낮은 ECN, Ra
Scalper Vault
Oleg Rodin
5 (27)
Scalper Vault 는 성공적인 스캘핑에 필요한 모든 것을 제공하는 전문 스캘핑 시스템입니다. 이 표시기는 외환 및 바이너리 옵션 거래자가 사용할 수 있는 완전한 거래 시스템입니다. 권장 시간 프레임은 M5입니다. 시스템은 추세 방향으로 정확한 화살표 신호를 제공합니다. 또한 상단 및 하단 신호와 Gann 시장 수준을 제공합니다.  이 시스템은 사용하기가 매우 쉽습니다. 원하는 시장 지역의 화살표만 따라가면 됩니다. 엑시트는 가격이 적정 수준에 도달하거나 시장의 고점 또는 저점 신호가 나타날 때 수행됩니다.  표시기는 PUSH 알림을 포함한 모든 유형의 경고를 제공합니다. 인디케이터 구매 후 연락주세요. 내 개인 거래 권장 사항과 훌륭한 보너스 지표를 무료로 공유합니다! 나는 당신에게 행복하고 유익한 거래를 기원합니다!
FX Power MT4 NG
Daniel Stein
5 (8)
모닝 브리핑 여기 mql5 와 텔레그램에서 FX Power MT4 NG 는 오랫동안 인기 있는 통화 강도 측정기인 FX Power의 차세대 버전입니다. 이 차세대 강도 측정기는 무엇을 제공합니까? 기존 FX Power에서 좋아했던 모든 것 PLUS GOLD/XAU 강도 분석 더욱 정밀한 계산 결과 개별 구성 가능한 분석 기간 더 나은 성능을 위한 사용자 정의 가능한 계산 한도 특별 멀티더 많은 것을보고 싶은 사람들을위한 특별한 다중 인스턴스 설정 모든 차트에서 좋아하는 색상을위한 끝없는 그래픽 설정 수많은 알림 옵션, 중요한 것을 다시는 놓치지 않도록 Windows 11 및 macOS 스타일의 둥근 모서리가 있는 새로운 디자인 마법처럼 움직이는 인디케이터 패널 FX 파워 키 특징 모든 주요 통화의 완전한 강세 이력 모든 시간대에 걸친 통화 강세 이력 모든 브로커 및 차트에서 고유 계산 결과 100% 신뢰할 수있는 실시간100 % 신뢰할 수있는 실시간 계산-> 다시 칠하지 않음
ON Trade Waves Patterns Harmonic Elliot Wolfe를 소개합니다. 이는 수동 및 자동 방법을 사용하여 다양한 시장 패턴을 감지하기 위해 개발된 고급 지표입니다. 다음은 그 작동 방식입니다: 조화적 패턴: 이 지표는 차트에 나타나는 조화적 패턴을 식별할 수 있습니다. 이러한 패턴은 Scott Carney의 "Harmonic Trading vol 1 및 2"에서 설명한 것처럼 조화적 거래 이론을 연습하는 트레이더에게 중요합니다. 수동으로 그리든 자동 감지를 사용하든 ON Trade Waves Patterns가 도움을 줄 것입니다. 컨트롤 패널: 이 지표에는 사용자 친화적인 컨트롤 패널이 있습니다. 차트 및 시간 프레임 설정을 저장하여 다양한 구성 간에 쉽게 전환할 수 있습니다. 차트 공간을 최대화하려면 최소화할 수도 있습니다. 다른 분석 도구를 사용하는 것을 선호하는 경우 닫기 버튼을 클릭하여 모든 지표 데이터를 숨길 수 있습니다. 템플릿 저장: 설정을 사
PRO Renko System
Oleg Rodin
5 (24)
PRO Renko System 은 RENKO 차트 거래를 위해 특별히 고안된 매우 정확한 거래 시스템입니다. 이것은 다양한 거래 상품에 적용될 수있는 보편적 인 시스템입니다. 체계는 효과적으로 당신에게 정확한 반전 신호에 접근을 주는 소위 시장 소음을 중화합니다. 이 표시기는 사용하기가 매우 쉽고 신호 생성을 담당하는 매개 변수가 하나만 있습니다. 당신은 쉽게 당신의 선택의 어떤 무역 계기에 공구를 적응시킬 수 있고 renko 막대기의 크기. 나는 항상 당신이 내 소프트웨어로 수익성있게 거래 할 수 있도록 추가 지원을 제공 할 준비가되어 있습니다! 나는 당신에게 행복하고 수익성있는 거래를 기원합니다! 구매 후 저에게 연락하십시오! 내 렌코 차트 생성기를 보내드립니다. 또한 내 개인 권장 사항 및 시스템의 다른 모듈을 무료로 공유 할 것입니다!
Entry Points Pro
Yury Orlov
4.7 (224)
다시 색을 칠하지 않고 거래에 진입할 수 있는 정확한 신호를 제공하는 MT4용 지표입니다. 외환, 암호화폐, 금속, 주식, 지수 등 모든 금융 자산에 적용할 수 있습니다. 매우 정확한 추정값을 제공하고 매수와 매도의 가장 좋은 시점을 알려줍니다. 하나의 시그널로 수익을 내는 지표의 예와 함께 비디오 (6:22)시청하십시오! 대부분의 거래자는 Entry Points Pro 지표의 도움으로 첫 거래 주 동안 트레이딩 결과를 개선합니다. 저희의   Telegram Group 을 구독하세요! Entry Points Pro 지표의 좋은점. 재도색이 없는 진입 신호 신호가 나타나고 확인되면(시그널 캔들이 완성된 경우) 신호는 더 이상 사라지지 않습니다. 여타 보조지표의 경우 신호를 표시한 다음 제거되기 때문에 큰 재정적 손실로 이어집니다. 오류 없는 거래 게시 알고리즘을 통해 트레이드(진입 또는 청산)를 할 이상적인 순간을 찾을 수 있으며, 이를 통해 이를 사용하는 모든 거래자의
Advanced Currency IMPULSE with ALERT
Bernhard Schweigert
4.91 (493)
현재 31% 할인!! 초보자 또는 전문가 트레이더를 위한 최고의 솔루션! 이 지표는 우리가 독점 기능과 비밀 공식을 통합했기 때문에 독특하고 고품질이며 저렴한 거래 도구입니다. 단 하나의 차트로 28개 통화 쌍 모두에 대한 경고를 제공합니다. 새로운 추세 또는 스캘핑 기회의 정확한 트리거 포인트를 정확히 찾아낼 수 있기 때문에 거래가 어떻게 개선될지 상상해 보십시오! 새로운 기본 알고리즘을 기반으로 구축되어 잠재적인 거래를 훨씬 더 쉽게 식별하고 확인할 수 있습니다. 이는 통화의 강세 또는 약세가 가속되는지 여부를 그래픽으로 표시하고 가속 속도를 측정하기 때문입니다. 자동차의 속도계처럼 생각하면 됩니다. 가속화할 때 Forex 시장에서 동일한 일이 분명히 더 빠르게 발생합니다. 즉, 반대 방향으로 가속화되는 통화를 페어링하면 잠재적으로 수익성 있는 거래를 식별한 것입니다. 통화 모멘텀의 수직선과 화살표가 거래를 안내합니다! 역동적인 Market Fibonacci 23
우선적으로 이 거래 시스템은 다시 그리지 않고, 다시 그리지 않으며, 지연되지 않는 것을 강조할 가치가 있습니다. 이는 전문적인 거래에 이상적입니다. "스마트 서포트 앤 레지스턴스 트레이딩 시스템"은 새로운 및 경험 많은 트레이더를 위해 개발된 고급 지표입니다. 이 시스템은 외환 시장에서 정밀도와 신뢰감을 제공합니다. 이 포괄적인 시스템은 일일 거래 전략, 스윙 거래 전략, 지원 및 저항 전략, 캔들스틱 패턴 전략, VWAP 전략, 다중 시간대 추세 전략 등을 포함한 7개 이상의 전략, 10개의 지표 및 다양한 거래 방식을 결합합니다. 이 시스템은 화살표 신호, 진입 및 출구 지점, 거래 경보, 높은 시간대 추세 분석, 실시간 거래 모니터링 및 트렌드 및 볼륨 캔들 색상 제공합니다. 자동 지원 및 저항 감지로 다양한 시장 상황에서 신중한 결정을 돕는 다면적 인 지표입니다. 스마트 서포트 앤 레지스턴스 트레이딩 시스템은 프리미엄 및 강력한 지표 및 도구 모음을 통합한 견고한
TrendDecoder Premium
Christophe, Pa Trouillas
5 (2)
범위 및 다음 가능한 움직임 식별   |  추세의 초기 신호와 강도를 확인하세요   |  반전 전 명확한 출구 확보   |  가격이 테스트 할 피보 레벨 파악 비추적, 비지연 지표 - 수동 및 자동 거래에 이상적 - 모든 자산 및 모든 시간 단위에 적합 기간 한정 혜택 >>   50% 할인 구매 후 이 채널로 문의 하여 권장 설정을 확인하세요. MT5   버전:   여기를 클릭하세요 BladeSCALPER   및   PowerZONES   로 전체 방법을 확인하세요. 어떤 서비스인가요? 트렌드디코더는 추세 모니터링을 간단하고 쉽게 하기 위한 여러 혁신 기술의 집약체입니다. 투영 추세선(투영 추세선) - 다가오는 추세의 속도 기준 실시간 추세선과 투영 추세선 비교 - 시장이 이전과 같은 방향으로 움직이고 있는지, 아니면 둔화되고 있는지? 실시간 추세선 교차 - 추세가 궤도를 이탈하고 있습니다. 그레이박스 - 시장이 더 이상 추세가 아니며 새로운 전환기에 들어섰습
TakePropips Donchian Trend Pro
Eric John Pajarillaga Aldana
4.82 (17)
TakePropips Donchian Trend Pro   (MT4)는 Donchian 채널을 사용하여 추세의 방향을 자동으로 감지하고 진입 및 퇴장 거래 신호를 제공하는 강력하고 효과적인 도구입니다! 이 다기능 지표에는 추세 스캐너, 거래 신호, 통계 패널, 스크리너, 거래 세션 및 경고 내역 대시보드가 포함됩니다. 거래 신호를 제공하고 차트 분석 시간을 절약하도록 설계되었습니다! 다음 블로그 게시물에서 사용자 설명서 및 설치 가이드를 다운로드할 수 있습니다.   https://www.mql5.com/en/blogs/post/751368 오늘 50% 할인을 받으세요! 가격이 $98에서 $49로 인하되었습니다! 전략 테스터에서 이 지표를 테스트할 수 있습니다(비주얼 모드 활성화). 실시간 차트에서 테스트하고 싶다면 저에게 메시지를 보내 7일 평가판을 받을 수도 있습니다. 자세한 내용은 설명 아래에 비디오 자습서도 제공됩니다. 질문이 있거나 도움이 필요하면 저에게 연락하십시오.
제우스 지표 소개: 귀하의 궁극적인 이윤 돌파 거래 도구. 이 지표는 폭발 전략과 심층 분석 필요성을 제거하여 거래를 단순화합니다. 귀하의 설정된 시간 프레임을 기반으로 자동으로 존을 그리고, 스탑 로스 (SL), 테이크 프로핏 (TP) 및 트레일링 스탑 수준을 제안합니다. 제우스 지표는 가격이 매수 또는 매도 진입점에 다가갈 때 즉각 알림을 제공하고 시그널 화살표를 표시합니다. 또한 네 가지 다른 테이크 프로핏 레벨과 다양한 트레일링 스탑 옵션을 권장합니다. 이 도구는 초보자와 숙련된 트레이더 모두에게 적합합니다. 채널 지원: [ 여기를 클릭 ](채널 지원 링크) 상점: 여기를 클릭하세요. MT5 버전: [ 여기를 클릭 ](MT5 버전 링크) 권장 사항: 시간 프레임: M5 또는 M15 통화 쌍: 모든 통화 쌍과 호환 가능 계정 유형: 모든 계정 유형과 호환 가능 권장 스탑 로스: 제우스 지표에서 제공하는 SL 제안 사용 권장 테이크 프로핏 레벨: 제우스 지표에서 제안하는 TP
FX Volume
Daniel Stein
4.6 (35)
모닝 브리핑을 통해 세부 정보와 스크린샷으로 매일 시장 업데이트를 받으세요 여기 mql5 및 텔레그램에서 FX 거래량은 브로커의 관점에서 시장 심리에 대한 실제 통찰력을 제공하는 최초이자 유일한 거래량 지표입니다. 브로커와 같은 기관 시장 참여자가 외환 시장에서 어떤 포지션을 취하고 있는지에 대한 훌륭한 통찰력을 COT 보고서보다 훨씬 빠르게 제공합니다. 차트에서 이 정보를 직접 확인하는 것은 트레이딩의 진정한 판도를 바꾸고 획기적인 솔루션입니다. 다음과 같은 고유한 시장 데이터 인사이트의 이점 비율 는 통화의 매수/매도 포지션 비율을 백분율로 표시 비율 변화 는 선택한 기간 내 매수 비율과 비율 변화를 표시 총 거래량 는 해당 통화의 총 거래량(롱 및 숏)을 로트 단위로 보여줍니다 Volumes Long 는 해당 통화의 모든 롱 포지션의 거래량을 보여줍니다 Volumes Short 는 해당 통화의 모든 숏 포지션의 거래량을 보여줍니다 Net Long 는 순 롱 포지션의 거래량
Quantum Heiken Ashi PRO MT4
Bogdan Ion Puscasu
4.43 (7)
소개       Quantum Heiken Ashi PRO   차트 시장 동향에 대한 명확한 통찰력을 제공하도록 설계된 Heiken Ashi 양초는 노이즈를 필터링하고 잘못된 신호를 제거하는 기능으로 유명합니다. 혼란스러운 가격 변동에 작별을 고하고 더 매끄럽고 신뢰할 수 있는 차트 표현을 만나보세요. Quantum Heiken Ashi PRO를 정말 독특하게 만드는 것은 전통적인 촛대 데이터를 읽기 쉬운 색상 막대로 변환하는 혁신적인 공식입니다. 빨간색과 녹색 막대는 각각 약세와 강세 추세를 우아하게 강조하여 잠재적 진입점과 퇴장점을 매우 정확하게 파악할 수 있습니다. Quantum EA 채널:       여기를 클릭하세요 MT5 버전:       여기를 클릭하세요 이 놀라운 지표는 다음과 같은 몇 가지 주요 이점을 제공합니다. 선명도 향상: Heiken Ashi 바는 가격 변동을 완화하여 시장 추세를 보다 명확하게 나타내므로 유리한 거래 기회를 쉽게 식별할 수 있
Cycle Sniper
Elmira Memish
4.41 (34)
NEW YEAR SALE PRICE FOR LIMITED TIME!!! Please contact us after your purchase and we will send you the complimentary indicators to complete the system Cycle Sniper is not a holy grail but when you use it in a system which is explained in the videos, you will feel the difference. If you are not willing to focus on the charts designed with Cycle Sniper and other free tools we provide, we recommend not buying this indicator. We recommend watching the videos about the indiactor and system before pu
제작자의 제품 더 보기
Introducing A Game-changing Strategy  Super Frequency Neural Network algorithm. Use with low spread broker. Like IC-Market raw is very suitable. Reach my email to receive the set file . My email business@darkfxsignals.com . Use 5-10 min everyday during NY Session on this broker on us30 pair because of no commission  you will generate strong profit . Install 'Sessions' indicator on Tradingview.com it will help you to see NY session exact time.Visit our website from Here Join our mql5  channel h
Darkfx Nexus Buttons is an utility which will help you to very quickly open any chart any timeframe. Acts like quick buttons. I hope it will help you trading making it easier and more convenient. You can change the pair names from input of the indicator while placing it on chart. Finally making everything more simpler.  Email us at business@darkfxsignals.com for any help. 
Classical Divergence , Hidden Divergence both available . Enter a trade with the arrow on lower indicator. Nexus Divergence Pro is the best Divergence tool one can imagine with trade signals you will experience the super functionality. Needless to say how accurate divergence trading can be . Do your research on google you will understand its a standalone super accurate strategy.
Position Tool Pro utility is your best friend when it comes to calculating ATR stoploss , ATR takeprofit on a certain timeframe .  Change the front size and colour. You can drag the each line on the indicator and set where you wanna set on your chart window otherwise they remain quite inter-twingled atfirst . Next time when you need to put ATR stop loss on your trade just watch what indicator is saying and set it on trade , its that simple now. Visit my website from here 
This indicator shows the Pennant and Flag pattern hidden inside your chart. Accuracy has maintained , unlike other indicators it acts way accurately because of the code we applied . Feel free to take a trade on higher timeframe breakout of this patterns. Using naked eye its often difficult to  find out these price action build ups. Now you have access to worlds best Flag and Pennant indicator.
Local time session indicator . No more go here and there to check the London , Newyork , Asian session time . All will be available in front of your chart . Graphical interface available. Tokyo and Sydney session available which as you know in combination forms the Asian session. We are trying our best to provide the best solutions a trader can imagine thus making trading easy and hasslefree.
필터:
리뷰 없음
리뷰 답변
버전 1.5 2023.02.26
Added some extra features.