Harmonic Patterns Scanner MT4
- 지표
- Mihails Babuskins
- 버전: 1.1
- 업데이트됨: 8 3월 2023
- 활성화: 11
- Contact me after payment to send you the User-Manual PDF File.
Harmonic Trading
The secret is the Fibonacci.
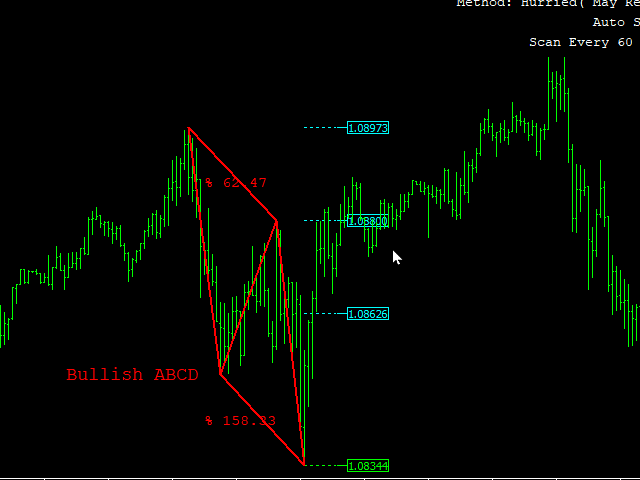
It has been proven in the markets that price always reacts to Fibonacci levels. Fibonacci levels are one of the most important indicators of price changes. Sometimes the sequence of reactions to these levels in the chart make geometric shapes, which are called harmonic patterns.
The price creates harmonic patterns with its fluctuation and reaction to Fibonacci levels. Harmonic patterns can be called a domino of Fibonacci levels.
Recognizing and trading based on these patterns is always one of the main plans of many traders, accuracy and high win rate are the characteristics of harmonic patterns.
Everything is clear when you work with harmonic patterns, entry point, SLs and TPs, in fact trading based on harmonic patterns is a complete strategy by itself.
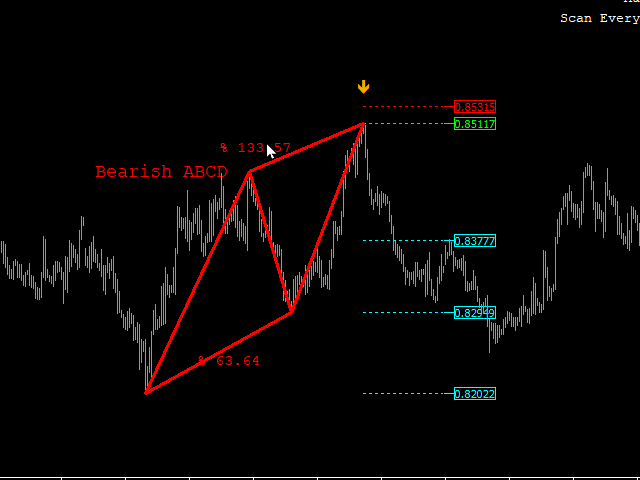
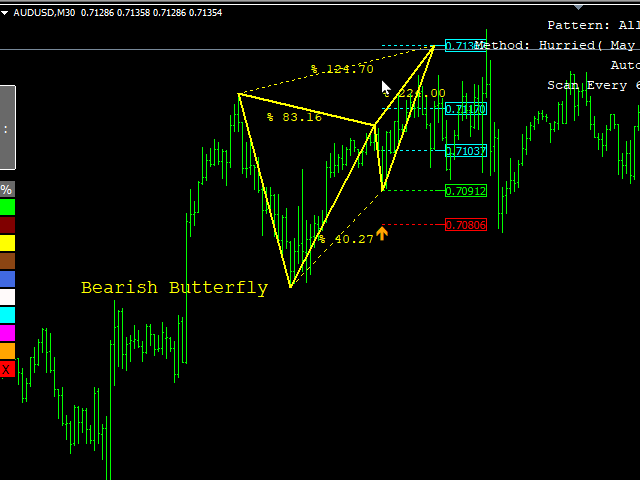
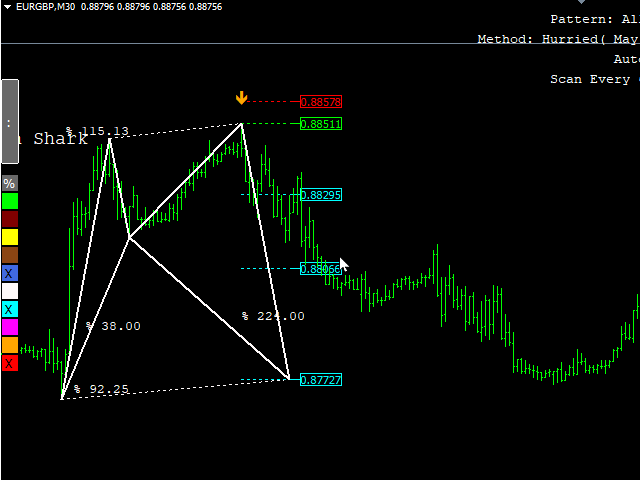
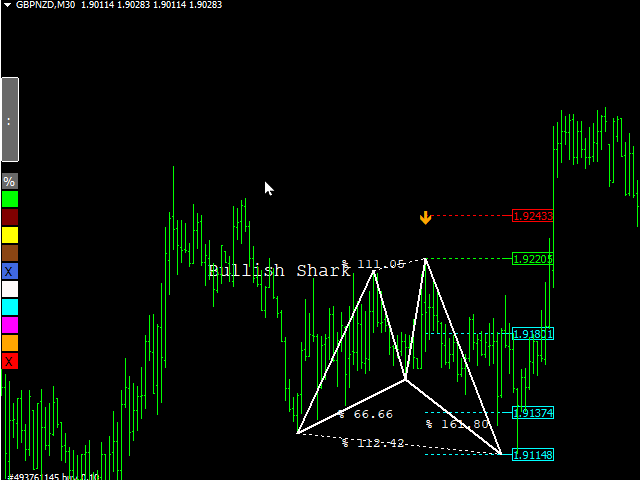
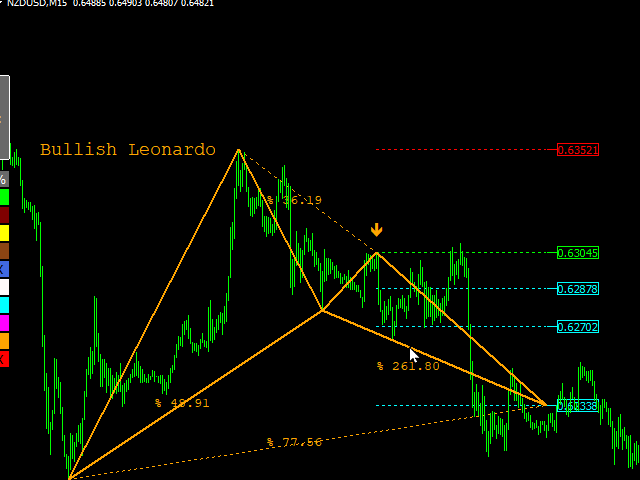
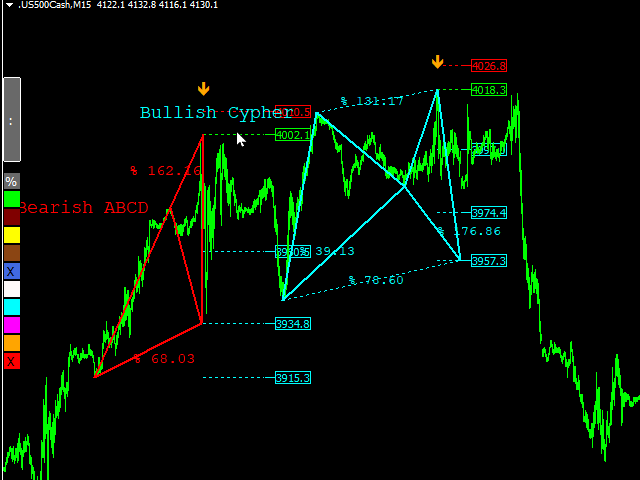
Harmonic Patterns Scanner
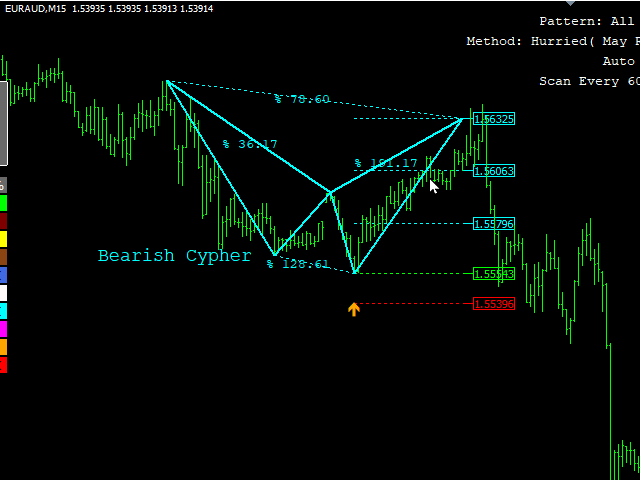
These patterns are relatively difficult to identify and require advanced knowledge in other tools like the Fibonacci retracement.
This advanced indicator checks all charts and time frames for detecting harmonic patterns, the trader does not need to draw Fibonacci levels and calculate them.
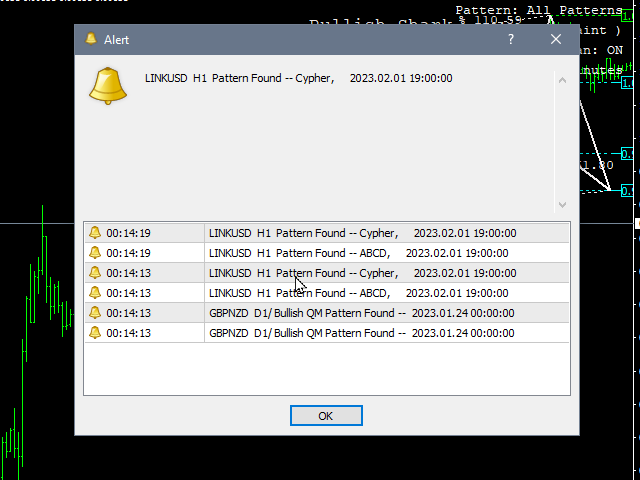
Auto Scan and Notifications
The trader can run this indicator on a VPS and enable the automatic scanning mode, in this case the indicator will automatically scan all symbols and time-frames that chosen by the trader and send the result with a notification.
Advantages of the indicator
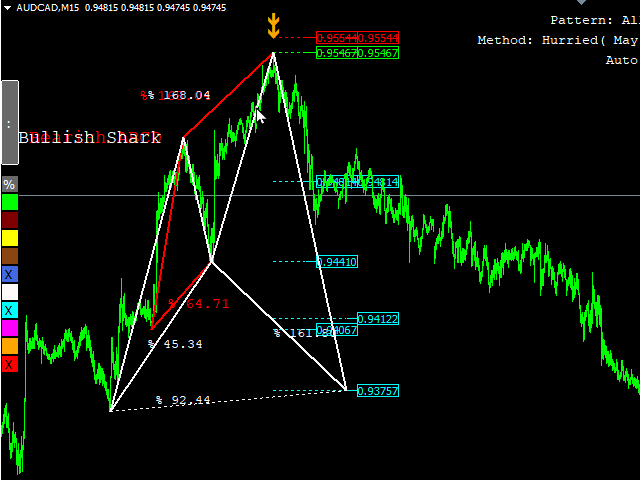
- Very fast scanning (the fastest in the market).
- Advanced algorithm for searching in the depths and micro waves.
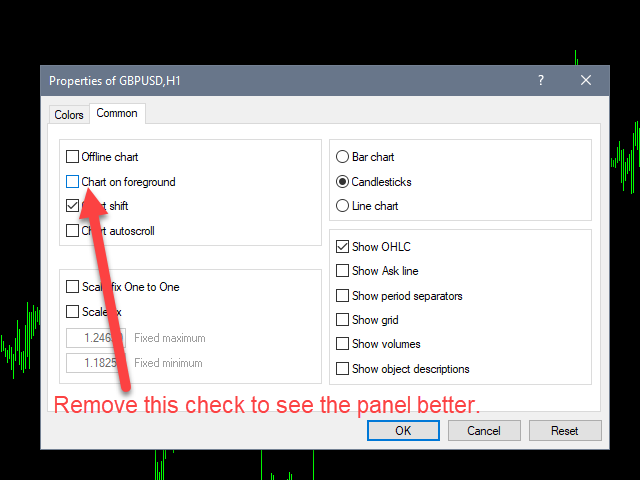
- Beautiful and simple user interface.
- Automatic scanning and sending notifications.
- Ordering guide.
- Ability to predict mode (before the pattern is completed).


Hi, I have just purchased the Harmonic Scanner. Please send me the manual file. Thank you.