• 미리보기
  • 리뷰 (3)
  • 코멘트
  • 새 소식

KFX Symbol Changer

4.67
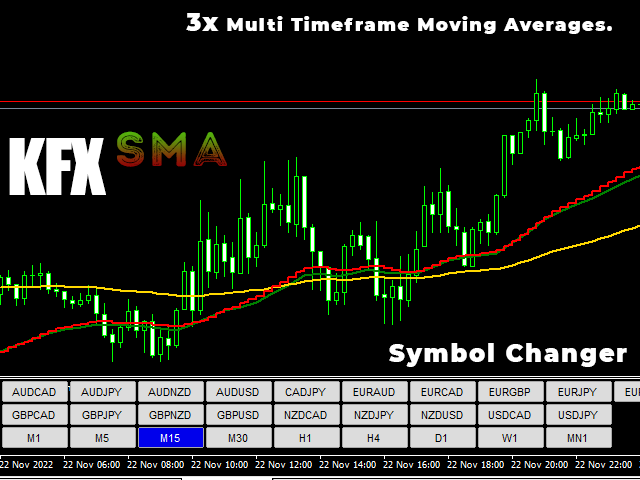
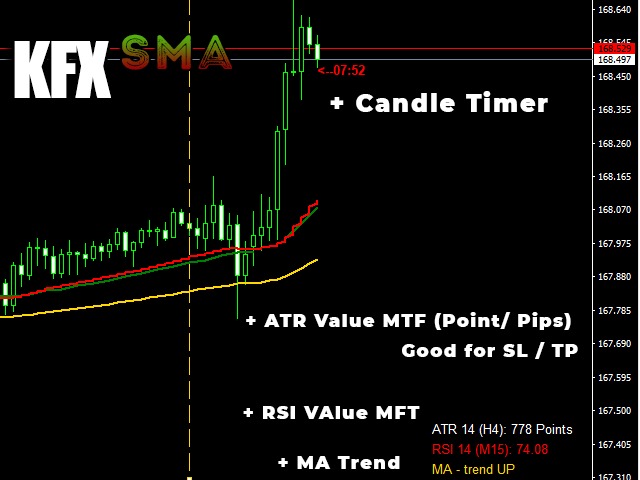
KFX SMA: Symbol Changer + Moving Average (3x) + ATR + RSI + Candle Timer.

This indicator allows you to create a Symbol list and change between symbols of the current chart or Timeframe by selecting the appropriate button. On Chart there are three(3) multi timeframe Moving Averages shown (selected by you), ATR Value MTF ( selected by you - helps with setting SL and TP), RSI Value MTF (selected by you) and a Candle Timer.  

Features:

- Symbol Changer: Change Symbol and Timeframe of Chart.  (selected by you) 
- Moving Averages MTF 3x.  (selected by you) 
- ATR Value MTF (Points/Pips) on Chart.  (selected by you) 
- RSI Value MTF on Chart.  (selected by you) 

- Candle Timer (Current Timeframe).

* KFX Dashboard: Price Action + Strength + Trade Monitoring. *

https://www.mql5.com/en/market/product/89625

* KFX Dashboard EA: Add to Profitable Trades + Auto set TP/SL ATR/Points + Price Action + Strength + Trade Monitoring +++ *

https://www.mql5.com/en/market/product/90428


리뷰 3
leo1618
74
leo1618 2022.12.09 10:16 
 

A useful tool that works well, thanks for the indicator.

carterluk3
24
carterluk3 2022.11.27 07:55 
 

Good.

Jason Carson
442
Jason Carson 2023.08.07 20:08 
 

I only use it for the symbol changer. Really need a version that doesn't include all the other stuff that gets in the way. I set all the colors to none. But when hovering over the chart, the popup for this KFX changer shows up everywhere which is annoying. Would be 5 stars if it was just the changer.

추천 제품
UPD1 Pivot Levels
Vitaliy Kuznetsov
5 (3)
지표는 전날을 기준으로 계산된 클래식 피벗 수준을 차트에 표시합니다. 수식을 계산할 시간을 선택할 수 있습니다. 반전을 위해 플랫에서 거래하십시오. 트렌드 시장에서 이들을 타깃으로 삼으세요. 성공적인 거래를 위한 전략과 결합하십시오. 레벨은 버퍼를 사용하여 작성되고 사용 가능한 전체 견적 내역에 표시됩니다. 입력 매개변수. Start Hour - 몇 시부터 하루의 시작을 계산합니다. 00 - 기본값. Show Mid Pivots - 중간 수준 표시. Visual Button - 버튼 표시(활성화/비활성화). Corner - 버튼 앵커 각도. X indent - 픽셀의 수평 패딩. Y indent - 픽셀의 수직 패딩. Label Visual - 디스플레이 레벨 레이블. Label Font Size   - 글꼴 크기. Label Shift Bars   - 비문의 들여쓰기(촛불의 수). Label Tooltip   - 레벨 위의 커서 아래에 텍스트 표시. Levels
FREE
RedeeCash AROON
Patrick Odonnell Ingle
Version History Date Version Changes 07/08/2022 1.00 Initial Release Description The Aroon indicator is a technical indicator   that is used to identify trend changes in the price of an asset, as well as the strength of that trend. In essence, the indicator measures the time between highs and the time between lows over a time period. The idea is that strong uptrends will regularly see new highs, and strong downtrends will regularly see new lows. The indicator signals when this is happening, and
FREE
Oscillator helps determine the direction of the market Shows the direction of the price movement and is painted in the appropriate color. Allows you to conduct trend and counter trend trading It works on all timeframes, on any currency pairs, metals and cryptocurrency Can be used when working with binary options Distinctive features Does not redraw; Simple and clear settings; It works on all timeframes and on all symbols; Suitable for trading currencies, metals, options and cryptocurrency (Bitco
FREE
Grid MATR
Abraham Correa
X-axis lines prevail in grid manner, ruled by Average True Range. There’s an evitable change in specific periods of time! MATR means “multiplying average true range” in order to find the boundaries of the Grid expansion. It’ll stretch, shrink, and evolve with 4 timely choices of grid states! This origin code recognizes the participation on a chart, noticing the development in volume! If you were to click on the gifs attached, you'd see it in action!              |This is an indicator | Mat
FREE
Fibo Linear Channel
Igor Semyonov
4 (1)
Colored indicator of the linear channel based on the Fibonacci sequence. It is used for making trading decisions and analyzing market sentiment. The channel boundaries represent strong support/resistance levels, as they are the Fibonacci proportion levels. Users can select the number of displayed lines of channel boundaries on the chart by means of the input parameters. Attaching multiple instances of the indicator to the chart with different calculation periods leads to displaying a system of c
The UNIVERSAL DASHBOARD indicator will eliminate the need of using dozens of indicators on dozens of charts. From one place you can monitor all the pairs and all the timeframes for each of the following indicators: MACD STOCHASTIC WPR RSI CCI You can also use any Custom indicator in the dashboard as long as it has a readable buffer. With a single click you can quickly navigate between charts, pairs and timeframes. Alerts will provide clear indication about what happens for your favorite pairs on
FREE
MQLTA Candle Timer
MQL4 Trading Automation
5 (1)
MQLTA Candle Timer is an indicator that can show you the details about a symbol/pair and alert you before the close of a candle. Used in swing trading and not only, it can help your strategies knowing and be ready before the close of a candle. How does it work Simply add the indicator to the chart and set the notifications options. You can load a minimalistic interface or a full interface. The alert will be sent once per candle. Parameters All the parameters, that you can see in the picture,
FREE
NAM Divergences
NAM TECH GROUP, CORP.
5 (1)
MT4 Multi-timeframe Divergence and Overbougt/Oversold detection indicator. Features - Fully customizable on chart control panel, provides complete interaction. - Hide and show control panel wherever you want. - Real time information about non-capitalized divergences. - Real time information about overbougt / oversold situations. - Real time information about regular divergences. - Real time information about hidden divergences. - Oscillators available for divergences detection: AO, RSI, CCI, M
Truly ScreenShot Indicator
Roman Starostin
5 (3)
The indicator takes screenshots of the active terminal chart. Available image saving options: At the opening of a new bar (candlestick) depending on the currently selected timeframe; After a certain time interval, e.g. every 10 minutes after indicator launch on a chart; When trade orders are opened/closed both by an Expert Advisor and manually; Each time when a user clicks the "Screeshot" button. Indicator Parameters Settings Screenshot time Start Time (hh:mm) - sets the start time of indicato
Heikin-Ashi-Sniper is a perfect addition to your portfolio. It is meant to be traded on EURUSD on H1 Timeframe. It uses Heikin-Ashi High and Low/High of Monthly timeframe to determine optimal entry signals while having a reasonably low drawdown More EA´s will be published shortly to complete the Portfolio. The EA Trades not very frequently it waits for the right chance and places the order. The rest of the time, your capital is free to be traded on other strategies Please see backtest results
FREE
!!! [CodeBase]에서 Mql4 표시기 코드를 게시했습니다. 코드를 무료로 다운로드하세요!!! (터미널을 업데이트할 때 코드를 수정해야 합니다.) 이 지표는 거래자의 도구입니다. 모든 기간 및 기호에 대한 확률론의 움직임을 보여줍니다: М1, М5, М15, М30, Н1, Н4 매분(현재에서 -240분까지의 시간 척도, 즉 지난 4시간 동안). Step_Stoch는 확률 지표의 단점인 지연을 극복합니다. 예를 들어, H1(또는 M30)에서 하락 후 상승은 H1에서 60분 후 또는 M30에서 30분 후 일반적인 스토캐스틱에서 볼 수 있습니다. 이 표시기는 이 정보를 1분 안에 표시하므로 더 나은 결과를 얻을 수 있습니다. 모든 스토캐스틱이 결합된 것을 확인하고 그 움직임을 분석하여 지연 없이 최적의 거래 결정을 내릴 수 있습니다. 이는 조기에 거래를 마감할 때 이익의 손실을 초래할 수 있거나 이익의 가능성(많은 부분)이 이미 상실된 경우 늦은 개시로 이어질 수
FREE
Rsi Aligator
Dmitriy Konogorov
The indicator do have inside two a tehnical its "RSI" and "Aligator" indicators with histogram for technical analysis of the market, currencies, currency pairs, precious metals and oil, and you can also analyze various cryptocurrencies such as Bitcoin and Ethereum. The indicator analyzes quotes and, based on their data, displays its icons on the chart for trading analysis. The indicator works very well, does not freeze and does not slow down even a weak processor in the computer, and is also no
United Rsi
Kenneth Parling
3.5 (2)
Introduction United Rsi is an expert everyone should have in their arsenal, simple and easy to handle. From the name, you will surely understand that the expert works with the Relative Strength Index indicator, which constitutes a signal for trading in overbought and oversold price zones. Orders are placed with the usual take profit and stop loss. The characteristic features of the expert Presets ready to use on eurusd M5 No dangerous trading methods are used Works after optimization on the mo
FREE
TradingDesk Demo
Christian Weilinger
TradingDesk Demo – Performance Analyse MT4 This is a Demo version of TradingDesk indicator which is limited to show only EURUSD. Full version can be found here: https://www.mql5.com/en/market/product/40189 TradingDesk analysed MetaTrader 4 historical data by Symbol, Magic Number, Trade or Comment. All these evaluations will be displayed in real time on your MetaTrader 4 chart window. All this information will be displayed in the following dashboards: account info General information about
FREE
Angle Dashboard
Taras Slobodyanik
5 (1)
This is a multicurrency and multitimeframe indicator that calculates the angle between two points. Points for measuring the angle can be taken from the ZigZag (the last two points), or from the Moving Average (between two given bars), or it can be the closing prices of bars. Angle measurement is possible in degrees or in radians. You can select the scale for the calculation. For a better understanding of the indicator, you can study the free Angle High Low indicator. In the parameters you can
ZigZagLW4 Addition
Gayrat Madumarov
This is a functional extension of the ZigZagLW4 indicator. It detects the beginning of a new trend signaling of a new indicator line shoulder of a specified level. This is a stand-alone indicator, which means you do not need the activated ZigZagLW4 indicator for correct operation. Algorithm logic To understand the logic of the indicator, let's take a look at the screenshots consistently displaying the conditions for the signals formation. The chart has ZigZagLW4 indicator with the Short_term a
MT4용 외환 지표 "주요 추세 수정 히스토그램" 주요 추세 수정 히스토그램 표시기는 큰 추세를 감지하도록 설계되었습니다. 표시기는 2가지 색상으로 제공됩니다: 하락 추세는 빨간색, 상승 추세는 파란색(색상은 변경 가능) 동일한 색상의 연속 히스토그램 열이 10개 이상 있으면 새로운 추세의 시작을 의미합니다. 표시기에는 모바일 및 PC 알림이 내장되어 있습니다. 지표의 민감도를 담당하는 매개변수 "기간" 사용 방법 표시기: 1) 동일한 색상의 연속 히스토그램 열이 10개 이상 있는지 확인합니다. 이는 새로운 추세의 시작을 의미합니다(파란색 - 강세, 빨간색 - 약세). 2) 그런 다음 반대 색상 열이 1~2개 발생하고 다시 주요 추세 색상으로 변경되는 경우, 이것이 추세 수정입니다. 3) 수정 후 고려하는 것이 좋습니다: 큰 상승 추세일 경우 매수 거래를 열고 큰 하락 추세일 경우 매도 거래를 시작하는 것이 좋습니다. // 더 훌륭한 전문가 자문 및 지표는 여기에서 확인
Introducing the Donchian Channels indicator for MQL4, a powerful technical analysis tool designed to boost your trading success. This indicator consists of four lines that represent the upper and lower boundaries of price movement over a specified period. With the Donchian Channels indicator, you can easily identify potential breakouts and reversals in the market. The upper line shows the highest high of the specified period, while the lower line represents the lowest low. The space between thes
Dark Bands
Marco Solito
4.93 (153)
Dark Bands   is an Indicator for intraday trading. This Indicator is based on   Counter Trend  strategy but use also Volatility. We can enter in good price with this Indicator, in order to follow the inversions on the current instrument. Key benefits Easily visible take profit/stop loss lines Reliable bands lines with futuristic colors, and  Intuitive directional arrows Useful   statistics , which indicate the   win rate   of the signals   Plus Package  available, leave a feedback to recei
FREE
MT4용 외환 지표 "추세 진입 히스토그램" 추세 항목 히스토그램 표시기는 항목 막대가 나타나면 추세 방향에 대한 항목 신호를 검색하는 데 사용할 수 있습니다. 이 지표에는 고유한 기능이 있습니다. 계산에는 가격과 거래량이 모두 필요합니다. 추세 입력 히스토그램은 2가지 색상이 있습니다. 빨간색은 약세 추세이고 파란색은 강세 추세입니다. 꾸준한 추세(동일한 색상의 최소 10개 연속 히스토그램 막대)가 보이면 - 입력 막대를 기다립니다. 입력 신호는 히스토그램에서 반대 색상의 1열과 초기 추세 색상의 다음 열입니다(그림 참조). 짧은 목표 사용 - 현재 추세에 따라 차트에서 가장 가까운 고점/저점 표시기에는 모바일 및 PC 알림이 내장되어 있습니다. 사용 방법 표시기: - 매수 신호의 경우: 꾸준한 강세 추세(파란색 히스토그램 막대) 히스토그램의 +1 빨간색 막대 +1 파란색 막대(여기서 장기 거래 열기) - 매도 신호의 경우: 꾸준한 약세 추세(빨간색 히스토그램 막대) 히스
SpectorChart
Sergii Krasnyi
This indicator continuously changes the color of candlestick borders and bodies, as well as the color of volumes in real time. The indicator is easy to use. The palette of colors is diverse. This product is a graphical solution, so it is difficult to describe what it does by text, it is easier to see by downloading it, besides the product is free. The indicator is suitable for bloggers who want to create a beautiful picture of a chart for video editing or traders who want to make their chart al
FREE
This indicator uses a different approach from the previous version to get it's trendlines. This method is derived from Orchard Forex, and the process of making the indicator is demonstrated in there video   https://www.youtube.com/watch?v=mEaiurw56wY&t=1425s . The basic idea behind this indicator is it draws a   tangent line   on the highest levels and lowest levels of the bars used for calculation, while ensuring that the lines don't intersect with the bars in review (alittle confusing? I kno
FREE
MetaCOT 2 is a set of indicators and specialized utilities for the analysis of the U.S. Commodity Futures Trading Commission reports. Thanks to the reports issued by the Commission, it is possible to analyze the size and direction of the positions of the major market participants, which brings the long-term price prediction accuracy to a new higher-quality level, inaccessible to most traders. These indicators, related to the fundamental analysis, can also be used as an effective long-term filter
Forex strength meter is a useful indicator with which novice traders and professionals can analyze the market and see when and where to open a deal. Forex strength meter is an analytical complex for Metatrader4 which, in the form of lines on the chart, shows the trader the direction of the trend and its reversals. The interpretation of the indicator is very simple. When the indicator draws a red line above the blue line on the chart, it means that the trend is now going down. At this point, it
FTC Neuro
Aliaksandr Ausiyevich
혁신적인 거래 솔루션의 세계에 오신 것을 환영합니다! 우리는 최신 거시 경제 통계 및 현대 신경망 계산을 기반으로 작업,당신의 관심을 우리의 고급 거래 고문 공정위 신경에 제시한다. 고문은 복잡한 알고리즘을 사용하여 시장 상황을 분석하여 고급 인공 지능 알고리즘을 사용하여 경제 정보의 숨겨진 패턴을 인식합니다. 그것은 당신에게 가장 전문적인 거래 경험을 제공하여 거래 진입 및 종료에 대한 고유 한 포인트를 제공합니다. 모든 사람들은 고품질 거래가 항상 위험과 이익 사이의 균형이라는 것을 알고 있습니다. 우리는 고유 한 위험 관리 시스템을 개발했으며 고문은 귀하의 자본을 안전하게 유지하기 위해 신중하게 관리합니다. 공정위 신경 거래 고문으로 거래 전략을 자동화하고 복잡한 결정을 단순화하십시오! 위험을 최소화하면서 자본을 늘릴 수있는 기회를 얻으십시오! 그리고 이 모든 것-미래에 대한 편안함과 자신감. 오늘 우리의 무역 고문을 시도하고 전문적이고 높은 품질의 거래의 세계에 빠져! 고문
Market Structure Zig Zag
Lesedi Oliver Seilane
4.77 (22)
Free Market structure zig zag to assist in price action trading the screenshots describe how to use and how to spot patterns new version comes with alerts, email alert and  push notification alert can be used on all pairs  can be used on all timeframes  you can add additional confirmation indicators the indicator shows you your higher high and low highs as well as your lower lows and lower highs  the indication makes price action analysis easier to spot.
FREE
R Var 이동 평균 지표는 완고한 추세 추종자를 위해 설계된 추세 추종 지표입니다. 그것은 주식 거래자뿐만 아니라 상품 거래자 사이에서 꽤 인기있는 외환 거래 지표이며 그 인기는 사용자에게 진정한 돈 버는 신호를 전달하는 능력에서 비롯됩니다. 표시기는 시에나 라인에 배치된 녹색 및 빨간색 점으로 구성됩니다. 녹색 점은 강세 신호를 가리키고 빨간색 점은 약세 신호를 나타냅니다. 기본 거래 신호 매수 신호: 지표의 시에나 선에 있는 점이 녹색으로 바뀌면 매수하세요. 매도 신호: 지표의 시에나 선에 있는 점이 빨간색으로 바뀌면 매도하십시오. 매수 거래 종료: 강세 추세가 진행되는 동안 표시기의 시에나 라인에 빨간색 점이 나타나면 모든 매수 주문을 닫습니다. 매도 거래 종료: 약세 추세가 진행되는 동안 R Var 이동 평균 지표의 시에나 선에 녹색 점이 표시되면 모든 매도 주문을 마감합니다. 팁 R Var 이동 평균 지표를 사용할 때 잘못된 신호를 방지하기 위해 적당한 손
Trend Sensor MT4
Yuriy Lyachshenko
인디케이터는 가장 적절한 진입 및 청산 지점을 보여줍니다. 또한 더 나은 거래 분석을 위해 모든 신호에 대한 통계 데이터를 표시합니다. 이 지표의 도움으로 시장을 더 잘 이해할 수 있습니다. 추세의 힘이 약해지기 시작하면 (패널에 표시됨) 추세선이 수평 위치로 끌리게되며 이것이 거래를 종료하라는 신호입니다. 또는 평균 / 중간 수익 수준에 도달하면 종료 할 수 있습니다. 이 인디케이터는 2010년 이후 제 트레이딩 경험의 결과입니다. MT5용 인디케이터 버전 특징 이 인디케이터는 다시 그려지지 않습니다. 과거 차트에 인쇄된 내용도 실시간으로 인쇄됩니다. 암호화폐, 주식, 금속, 지수, 원자재, 통화 등 모든 자산 거래에 사용할 수 있습니다. 모든 차트주기에 사용할 수 있습니다. 진입 신호는 새 캔들이 열릴 때 나타납니다. 거래 종료 신호는 더 큰 수익으로 거래를 종료할 수 있는 경우가 많기 때문에 잠정적으로 제공됩니다. 왼쪽 상단에는 최소화 할 수있는 자세한 거래 통
EZT MultiTF MACD
Tibor Rituper
5 (8)
This indicator can display 1 or 2 MACD indicator on different time-frames and settings. Uses EMA for calculation. The active indicators can give visual and sound alert on zero-level-cross if the user choose that option. Alert can be set on one or both active indicator, even if the time-frame, and the period different on each. When alert set to both, the two MACD histogram must be on the same size of the 0 level to get an arrow. There is a display panel with buttons on the main chart, what is sho
FREE
AD Trend line
Pavel Shutovskiy
5 (4)
AD Trend line draws trend lines on the basis of A/D indicator (Accumulation/Distribution). When A/D indicator breaks a trend line, the probability of the trend reversal is very high. This is a multitimeframe indicator which can display values from higher timeframes. Parameters Time-frame — Select a timeframe; zero is the current timeframe of the chart; Trend Line — Display lines on the chart; Apply to — Apply lines to close the candle's highest/lowest value; Width line — Width of the line; Style
FREE
이 제품의 구매자들이 또한 구매함
Gann Made Easy
Oleg Rodin
4.96 (45)
Gann Made Easy 는 mr.의 이론을 사용하여 최고의 거래 원칙을 기반으로 하는 전문적이고 사용하기 쉬운 Forex 거래 시스템입니다. W.D. 간. 이 표시기는 Stop Loss 및 Take Profit Levels를 포함하여 정확한 BUY 및 SELL 신호를 제공합니다. PUSH 알림을 사용하여 이동 중에도 거래할 수 있습니다. 구매 후 연락주세요! 내 거래 팁과 훌륭한 보너스 지표를 무료로 공유하겠습니다! 아마도 Gann 거래 방법에 대해 이미 여러 번 들었을 것입니다. 일반적으로 Gann의 이론은 초보자 거래자뿐만 아니라 이미 거래 경험이 있는 사람들에게도 매우 복잡한 것입니다. Gann의 거래 방식은 이론적으로 적용하기 쉽지 않기 때문입니다. 나는 그 지식을 연마하고 Forex 지표에 최고의 원칙을 적용하기 위해 몇 년을 보냈습니다. 표시기는 적용하기가 매우 쉽습니다. 차트에 첨부하고 간단한 거래 권장 사항을 따르기만 하면 됩니다. 지표는 지속적으로 시장 분석 작업
Atomic Analyst
Issam Kassas
5 (1)
우선적으로 언급할 점은이 거래 지표가 다시 그리지 않고 지연되지 않으며 이를 통해 수동 및 로봇 거래 모두에 이상적이라는 점입니다. Atomic Analyst는 가격의 강도와 모멘텀을 활용하여 시장에서 더 나은 이점을 찾는 PA Price Action Indicator입니다. 고급 필터를 장착하여 잡음과 거짓 신호를 제거하고 거래 잠재력을 높이는 데 도움이 됩니다. 복잡한 지표의 다중 레이어를 사용하여 Atomic Analyst는 차트를 스캔하고 복잡한 수학적 계산을 간단한 신호와 색상으로 변환하여 초보 트레이더가 이해하고 일관된 거래 결정을 내릴 수 있도록합니다. "Atomic Analyst"는 새로운 및 경험이 풍부한 트레이더를위한 종합적인 거래 솔루션입니다. 프리미엄 지표와 최고 수준의 기능을 하나의 거래 전략에 결합하여 모든 종류의 트레이더에 대한 다재다능한 선택지가되었습니다. 인트라데이 거래 및 스캘핑 전략 : 빠르고 정확한 일일 거래 및 단기 거래를 위해 설계
Gold Stuff
Vasiliy Strukov
4.89 (250)
Gold Stuff는 금을 위해 특별히 설계된 추세 지표이며 모든 금융 상품에서도 사용할 수 있습니다. 표시기가 다시 그려지지 않고 지연되지 않습니다. 권장 기간 H1. 표시기에서 완전 자동 Expert Advisor EA Gold Stuff를 작동합니다. 내 프로필에서 찾을 수 있습니다. 설정 및 개인 보너스를 받으려면 구매 후 즉시 저에게 연락하십시오!   설정 화살표 그리기 - 켜기 끄기. 차트에 화살표 그리기. 경고 - 가청 경고를 끕니다. 이메일 알림 - 켜기 끄기. 이메일 알림. Puch-notification - 켜기 끄기. 푸시 알림. 다음으로 색 영역을 조정합니다. Gold Stuff는 금을 위해 특별히 설계된 추세 지표이며 모든 금융 상품에서도 사용할 수 있습니다. 표시기가 다시 그려지지 않고 지연되지 않습니다. 권장 기간 H1. 표시기에서 완전 자동 Expert Advisor EA Gold Stuff를 작동합니다. 내 프로필에서 찾을 수 있습니
Scalper Vault
Oleg Rodin
5 (27)
Scalper Vault 는 성공적인 스캘핑에 필요한 모든 것을 제공하는 전문 스캘핑 시스템입니다. 이 표시기는 외환 및 바이너리 옵션 거래자가 사용할 수 있는 완전한 거래 시스템입니다. 권장 시간 프레임은 M5입니다. 시스템은 추세 방향으로 정확한 화살표 신호를 제공합니다. 또한 상단 및 하단 신호와 Gann 시장 수준을 제공합니다.  이 시스템은 사용하기가 매우 쉽습니다. 원하는 시장 지역의 화살표만 따라가면 됩니다. 엑시트는 가격이 적정 수준에 도달하거나 시장의 고점 또는 저점 신호가 나타날 때 수행됩니다.  표시기는 PUSH 알림을 포함한 모든 유형의 경고를 제공합니다. 인디케이터 구매 후 연락주세요. 내 개인 거래 권장 사항과 훌륭한 보너스 지표를 무료로 공유합니다! 나는 당신에게 행복하고 유익한 거래를 기원합니다!
TPSproTREND PrO
Roman Podpora
5 (15)
TPSpro TRENDPRO  - is a trend indicator that automatically analyzes the market and provides information about the trend and each of its changes, as well as giving signals for entering trades without redrawing! The indicator uses each candle, analyzing them separately. referring to different impulses - up or down impulse. Exact entry points into transactions for currencies, crypto, metals, stocks, indices!  -  Version MT5               DETAILED DESCRIPTION        /       TRADING SETUPS           
Trend Screener
STE S.S.COMPANY
4.83 (86)
트렌드 표시기, 트렌드 트레이딩 및 필터링을 위한 획기적인 고유 솔루션, 하나의 도구 안에 내장된 모든 중요한 트렌드 기능! Forex, 상품, 암호 화폐, 지수 및 주식과 같은 모든 기호/도구에 사용할 수 있는 100% 다시 칠하지 않는 다중 시간 프레임 및 다중 통화 표시기입니다. Trend Screener는 차트에 점이 있는 화살표 추세 신호를 제공하는 효율적인 지표 추세 추종 지표입니다. 추세 분석기 표시기에서 사용할 수 있는 기능: 1. 트렌드 스캐너. 2. 최대 이익 분석이 있는 추세선. 3. 추세 통화 강도 측정기. 4. 경고가 있는 추세 반전 점. 5. 경고가 있는 강력한 추세 점. 6. 추세 화살표 Trend Screener Indicator가 있는 일일 분석 예, 일일 신호 성능...등은 여기에서 찾을 수 있습니다.   여기를 클릭하십시오. LIMITED TIME OFFER : Trend Screener Indicator는 50 $ 및 평생 동안만 사용할 수 있
Quantum Trend Sniper Indicator MT4
Bogdan Ion Puscasu
4.59 (39)
소개       Quantum Trend Sniper Indicator는   추세 반전을 식별하고 거래하는 방식을 변화시키는 획기적인 MQL5 지표입니다! 13년 이상의 거래 경험을 가진 숙련된 트레이더 팀이 개발한       Quantum Trend Sniper 표시기       매우 높은 정확도로 추세 반전을 식별하는 혁신적인 방법으로 거래 여정을 새로운 차원으로 끌어올리도록 설계되었습니다. ***Quantum Trend Sniper Indicator를 구입하면 Quantum Breakout Indicator를 무료로 받을 수 있습니다!*** Quantum Trend Sniper Indicator는 추세 반전을 식별하고 세 가지 이익실현 수준을 제안할 때 경고, 신호 화살표를 제공합니다. 초보자 거래자와 전문 거래자 모두에게 적합합니다. Quantum EA 채널:       여기를 클릭하세요 MT5 버전:       여기를 클릭하세요
우선적으로, 이 거래 도구는 전문적인 거래에 이상적인 비-다시 그리기 및 지연되지 않는 지표입니다.  스마트 가격 액션 컨셉트 인디케이터는 신규 및 경험 많은 트레이더 모두에게 매우 강력한 도구입니다. Inner Circle Trader Analysis 및 Smart Money Concepts Trading Strategies와 같은 고급 거래 아이디어를 결합하여 20가지 이상의 유용한 지표를 하나로 결합합니다. 이 인디케이터는 스마트 머니 컨셉트에 중점을 두어 대형 기관의 거래 방식을 제공하고 이동을 예측하는 데 도움을 줍니다.  특히 유동성 분석에 뛰어나 기관이 어떻게 거래하는지 이해하는 데 도움을 줍니다. 시장 트렌드를 예측하고 가격 변동을 신중하게 분석하는 데 탁월합니다. 귀하의 거래를 기관 전략에 맞추어 시장의 동향에 대해 더 정확한 예측을 할 수 있습니다. 이 인디케이터는 시장 구조를 분석하고 중요한 주문 블록을 식별하고 다양한 패턴을 인식하는 데 뛰어납니다. 
Advanced Currency Strength28 Indicator
Bernhard Schweigert
4.9 (662)
현재 26% 할인 초보자 또는 전문가 트레이더를 위한 최고의 솔루션! 이 지표는 우리가 독점 기능과 새로운 공식을 통합했기 때문에 독특하고 고품질이며 저렴한 거래 도구입니다. 단 하나의 차트로 28 Forex 쌍의 통화 강도를 읽을 수 있습니다! 새로운 추세 또는 스캘핑 기회의 정확한 트리거 포인트를 정확히 찾아낼 수 있기 때문에 거래가 어떻게 개선될지 상상해 보십시오. 사용 설명서: 여기를 클릭  https://www.mql5.com/en/blogs/post/697384 그것이 첫 번째, 원본입니다! 쓸모없는 지망생 클론을 사지 마십시오. 더 스페셜  강력한 통화 모멘텀을 보여주는 하위 창의 화살표 GAP가 거래를 안내합니다! 기본 또는 호가 통화가 과매도/과매도 영역(외부 시장 피보나치 수준)에 있을 때 개별 차트의 기본 창에 경고 표시가 나타납니다. 통화 강도가 외부 범위에서 떨어질 때 풀백/반전 경고. 교차 패턴의 특별 경고 추세를 빠르게 볼 수 있는
TPSpro RFI Levels
Roman Podpora
5 (13)
A key element in trading is zones or levels from which decisions to buy or sell a trading instrument are made. Despite attempts by major players to conceal their presence in the market, they inevitably leave traces. Our task was to learn how to identify these traces and interpret them correctly. Reversal First Impulse levels (RFI)   -  Version MT5                INSTRUCTIONS                 RUS                 ENG                                       R ecommended to use with an indicator   -  
Advanced Supply Demand
Bernhard Schweigert
4.92 (310)
현재 33% 할인! 초보자나 전문 트레이더를 위한 최고의 솔루션! 이 보조지표는 우리가 다수의 독창적 기능과 새로운 공식을 통합한 독특하고 고품질이며 저렴한 거래 도구입니다. 이 업데이트를 통해 이중 시간대를 표시할 수 있습니다. 더 높은 TF를 표시할 수 있을 뿐만 아니라 차트 TF와 더 높은 TF 모두를 표시할 수 있습니다: 중첩 영역 표시. 모든 Supply Demand 트레이더들이 좋아할 것입니다. :) 중요한 정보 공개 Advanced Supply Demand의 잠재력을 극대화하려면 다음을 방문하십시오. https://www.mql5.com/ko/blogs/post/720245   진입 또는 목표의 명확한 트리거 포인트를 정확히 찾아냄으로 해서 거래가 어떻게 개선될지 상상해 보십시오. 새로운 알고리즘을 기반으로 매수자와 매도자 간의 잠재적인 불균형을 훨씬 더 쉽게 분간할 수 있습니다. 왜냐하면 가장 강한 공급영역과 가장 강한 수요 영역과 과거에 어떻게 진행 되었는지를(이
Entry Points Pro
Yury Orlov
4.7 (224)
다시 색을 칠하지 않고 거래에 진입할 수 있는 정확한 신호를 제공하는 MT4용 지표입니다. 외환, 암호화폐, 금속, 주식, 지수 등 모든 금융 자산에 적용할 수 있습니다. 매우 정확한 추정값을 제공하고 매수와 매도의 가장 좋은 시점을 알려줍니다. 하나의 시그널로 수익을 내는 지표의 예와 함께 비디오 (6:22)시청하십시오! 대부분의 거래자는 Entry Points Pro 지표의 도움으로 첫 거래 주 동안 트레이딩 결과를 개선합니다. 저희의   Telegram Group 을 구독하세요! Entry Points Pro 지표의 좋은점. 재도색이 없는 진입 신호 신호가 나타나고 확인되면(시그널 캔들이 완성된 경우) 신호는 더 이상 사라지지 않습니다. 여타 보조지표의 경우 신호를 표시한 다음 제거되기 때문에 큰 재정적 손실로 이어집니다. 오류 없는 거래 게시 알고리즘을 통해 트레이드(진입 또는 청산)를 할 이상적인 순간을 찾을 수 있으며, 이를 통해 이를 사용하는 모든 거래자의
Scalper Inside PRO
Alexey Minkov
4.75 (55)
SALE NOW! Limited Time Offer! An exclusive indicator that utilizes an innovative algorithm to swiftly and accurately determine the market trend. The indicator automatically calculates opening, closing, and profit levels, providing detailed trading statistics. With these features, you can choose the most appropriate trading instrument for the current market conditions. Additionally, you can easily integrate your own arrow indicators into Scalper Inside Pro to quickly evaluate their statistics and
맞춤형 MT4 지표로 성공적인 외환 거래에 대한 비밀을 발견하십시오! 외환 시장에서 성공을 달성하고 위험을 최소화하면서 일관되게 이익을 얻는 방법을 궁금해 한 적이 있습니까? 여기에 당신이 찾고 있던 답이 있습니다! 거래에 대한 귀하의 접근 방식을 혁신 할 독점적 MT4 지표를 소개 할 수 있습니다. 독특한 다양성 우리의 지표는 Renko 및 Rangebar Candle Formations를 선호하는 사용자를 위해 특별히 설계되었습니다. 우리는 이러한 차트 유형이 많은 숙련 된 거래자들이 선호한다는 것을 이해하기 때문에 우리의 지표가 그들과 완벽하게 통합되어 비교할 수없는 시장 분석을 제공합니다. 명확한 추세 신호 복잡한 분석을 잊어 버리십시오! 우리의 지표는 생생한 색상과 명확한 점 구조를 사용하여 시장 동향을 명확하게 나타냅니다. 빨간색과 파란색 점은 가격 이동 방향에 대해 의심의 여지가 없어 거래에서 빠른 의사 결정을 할 수 있습니다. HH/HL HL/LL
TrendMaestro
Stefano Frisetti
5 (2)
note: this indicator is for METATRADER4, if you want the version for METATRADER5 this is the link: TRENDMAESTRO recognizes a new TREND in the bud, he never makes mistakes. The certainty of identifying a new TREND is priceless. DESCRIPTION TRENDMAESTRO identifies a new TREND in the bud, this indicator examines the volatility, volumes and momentum to identify the moment in which there is an explosion of one or more of these data and therefore the moment in which prices have strong probability of f
현재 20% 할인 ! 초보자 또는 전문가 트레이더를 위한 최고의 솔루션! 이 대시보드 소프트웨어는 28개의 통화 쌍에서 작동합니다. 2가지 주요 지표(Advanced Currency Strength 28 및 Advanced Currency Impulse)를 기반으로 합니다. 전체 Forex 시장에 대한 훌륭한 개요를 제공합니다. 고급 통화 강도 값, 통화 이동 속도 및 모든(9) 시간대의 28 Forex 쌍에 대한 신호를 보여줍니다. 추세 및/또는 스캘핑 기회를 정확히 파악하기 위해 차트의 단일 지표를 사용하여 전체 시장을 볼 수 있을 때 거래가 어떻게 개선될지 상상해 보십시오! 잠재적인 거래를 식별하고 확인하면서 강력한 통화와 약한 통화를 더욱 쉽게 식별할 수 있도록 이 지표에 기능을 내장했습니다. 이 표시기는 통화의 강세 또는 약세가 증가 또는 감소하는지 여부와 모든 시간대에서 수행되는 방식을 그래픽으로 보여줍니다. 추가된 새로운 기능은 현재 시장 조건 변화에 적
기적적인 외환 지표 소개: 정확한 트레이딩의 힘을 발휘하세요 모든 시간대에서 뛰어난 결과를 제공하는 최고의 외환 지표를 찾는데 지친 적이 있나요? 더 이상 찾을 필요가 없습니다! 기적적인 외환 지표가 도래하여 귀하의 트레이딩 경험을 혁신하고 수익을 새로운 고도로 끌어올립니다. 최첨단 기술과 수년간의 정성스런 개발을 토대로 기적적인 외환 지표는 외환 시장에서의 힘과 정확성의 정점으로 떠오릅니다. 이 탁월한 도구는 모든 수준의 트레이더의 요구를 충족시키고 지속적인 수익을 추구하는 데에서 비길 데 없는 우위를 제공하기 위해 설계되었습니다. 기적적인 외환 지표의 가장 큰 장점은 그 뛰어난 적응성에 있습니다. 당신이 데이 트레이더, 스윙 트레이더이든 장기 포지션을 선호하든, 이 지표는 모든 시간대에서 뛰어난 결과를 제공하기 위해 최적화되었습니다. 그러나 그 정확성과 시장의 복잡한 움직임을 포착하는 능력이 참으로 빛을 발하는 것은 1시간 기간대에서 사용할 때입니다. 기적적인 외환 지표의 정확성
Market Reversal Alerts
LEE SAMSON
4.21 (121)
가격이 역전되고 후퇴함에 따라 시장 구조가 변경됩니다. 시장 구조 반전 경고 표시기는 추세 또는 가격 움직임이 고갈에 가까워지고 반전할 준비가 되었음을 식별합니다. 일반적으로 반전이나 큰 하락이 일어나려고 할 때 발생하는 시장 구조의 변화를 알려줍니다. 지표는 가능한 고갈 지점 근처에서 새로운 고점 또는 저점이 형성될 때마다 초기에 돌파와 가격 모멘텀을 식별합니다. 표시기는 반대쪽에 있는 마지막 촛불에 직사각형을 그립니다. 그런 다음 현재의 단기 추세에서 계속 움직이기 때문에 가격과 함께 직사각형을 따라갈 것입니다. 가격이 사각형 위나 아래로 다시 닫힐 정도로 약해지면 시장 구조에 잠재적인 변화가 일어나고 있음을 나타냅니다. 그런 다음 표시기는 방향의 잠재적인 이동과 추세 또는 주요 하락의 가능한 반전 시작에 대해 경고합니다. 작동 방식을 보려면 아래의 작동 표시기를 참조하십시오! 여기에서 모든 쌍 및 기간을 모니터링하기 위한 선택적 대시보드 추가 기능: https://
FX Power MT4 NG
Daniel Stein
5 (8)
모닝 브리핑 여기 mql5 와 텔레그램에서 FX Power MT4 NG 는 오랫동안 인기 있는 통화 강도 측정기인 FX Power의 차세대 버전입니다. 이 차세대 강도 측정기는 무엇을 제공합니까? 기존 FX Power에서 좋아했던 모든 것 PLUS GOLD/XAU 강도 분석 더욱 정밀한 계산 결과 개별 구성 가능한 분석 기간 더 나은 성능을 위한 사용자 정의 가능한 계산 한도 특별 멀티더 많은 것을보고 싶은 사람들을위한 특별한 다중 인스턴스 설정 모든 차트에서 좋아하는 색상을위한 끝없는 그래픽 설정 수많은 알림 옵션, 중요한 것을 다시는 놓치지 않도록 Windows 11 및 macOS 스타일의 둥근 모서리가 있는 새로운 디자인 마법처럼 움직이는 인디케이터 패널 FX 파워 키 특징 모든 주요 통화의 완전한 강세 이력 모든 시간대에 걸친 통화 강세 이력 모든 브로커 및 차트에서 고유 계산 결과 100% 신뢰할 수있는 실시간100 % 신뢰할 수있는 실시간 계산-> 다시 칠하지 않음
EasyTrade Indicator
Gabor Bocsak
5 (5)
다중 통화 및 다중 시간대 매수 및 매도 알림. 자동 추적 중지 및 위험 보상 이익 실현! 지표는 시장을 스캔하고 분석하므로 귀하가 할 일이 없습니다! 하나의 차트에서 모든 통화를 거래하세요!   구매 후 댓글 남겨주시면 연락드리겠습니다. 무역도우미 EA를 보내드리겠습니다. 표시기는 여러 오실레이터와 부착된 필터를 사용하여 최상의 확인 진입점을 찾으므로 걱정할 필요가 없습니다! 이는 귀하에게 경고하고 귀하가 시청하기로 선택한 모든 기간과 통화에 대한 버튼을 그립니다. 버튼을 누르면 차트로 이동하여 거래를 시작할 수 있습니다! 이 표시기는 또한 모든 기본 및 시장 감시 통화에 대한 강도 패널을 그립니다(설정에서 조정 가능). 그러면 모든 통화 쌍과 선택한 더 높은 기간의 통화가 표시됩니다. 표시기 창에는 추세 필터가 포함된 특수 MACD 히스토그램과 차트 통화에 대한 다중 기간 추세 패널이 있습니다! 모든 통화와 시간대에 대한 거래 알림을 제공하며 버튼을 누르면
Quantum Breakout Indicator PRO
Bogdan Ion Puscasu
4.96 (26)
소개       Quantum Breakout PRO   , 브레이크아웃 존 거래 방식을 변화시키는 획기적인 MQL5 지표! 13년 이상의 거래 경험을 가진 숙련된 트레이더 팀이 개발한   Quantum Breakout PRO는   혁신적이고 역동적인 브레이크아웃 영역 전략으로 거래 여정을 새로운 차원으로 끌어올리도록 설계되었습니다. Quantum Breakout Indicator는 5개의 이익 목표 영역이 있는 브레이크아웃 영역의 신호 화살표와 브레이크아웃 상자를 기반으로 한 손절 제안을 제공합니다. 초보자 거래자와 전문 거래자 모두에게 적합합니다. Quantum EA 채널:       여기를 클릭하세요 MT5 버전 :   여기를 클릭하세요 중요한! 구매 후 설치 매뉴얼을 받으려면 개인 메시지를 보내주십시오. 추천: 기간: M15 통화쌍: GBPJPY, EURJPY, USDJPY,NZDUSD, XAUUSD 계정 유형: 스프레드가 매우 낮은 ECN, Ra
PRO Renko System
Oleg Rodin
5 (24)
PRO Renko System 은 RENKO 차트 거래를 위해 특별히 고안된 매우 정확한 거래 시스템입니다. 이것은 다양한 거래 상품에 적용될 수있는 보편적 인 시스템입니다. 체계는 효과적으로 당신에게 정확한 반전 신호에 접근을 주는 소위 시장 소음을 중화합니다. 이 표시기는 사용하기가 매우 쉽고 신호 생성을 담당하는 매개 변수가 하나만 있습니다. 당신은 쉽게 당신의 선택의 어떤 무역 계기에 공구를 적응시킬 수 있고 renko 막대기의 크기. 나는 항상 당신이 내 소프트웨어로 수익성있게 거래 할 수 있도록 추가 지원을 제공 할 준비가되어 있습니다! 나는 당신에게 행복하고 수익성있는 거래를 기원합니다! 구매 후 저에게 연락하십시오! 내 렌코 차트 생성기를 보내드립니다. 또한 내 개인 권장 사항 및 시스템의 다른 모듈을 무료로 공유 할 것입니다!
TrendDecoder Premium
Christophe, Pa Trouillas
5 (3)
범위 및 다음 가능한 움직임 식별   |  추세의 초기 신호와 강도를 확인하세요   |  반전 전 명확한 출구 확보   |  가격이 테스트 할 피보 레벨 파악 비추적, 비지연 지표 - 수동 및 자동 거래에 이상적 - 모든 자산 및 모든 시간 단위에 적합 기간 한정 혜택 >>   50% 할인 구매 후 이 채널로 문의 하여 권장 설정을 확인하세요. MT5   버전:   여기를 클릭하세요 BladeSCALPER   및   PowerZONES   로 전체 방법을 확인하세요. 어떤 서비스인가요? 트렌드디코더는 추세 모니터링을 간단하고 쉽게 하기 위한 여러 혁신 기술의 집약체입니다. 투영 추세선(투영 추세선) - 다가오는 추세의 속도 기준 실시간 추세선과 투영 추세선 비교 - 시장이 이전과 같은 방향으로 움직이고 있는지, 아니면 둔화되고 있는지? 실시간 추세선 교차 - 추세가 궤도를 이탈하고 있습니다. 그레이박스 - 시장이 더 이상 추세가 아니며 새로운 전환기에 들어섰습
Currency Strength Wizard
Oleg Rodin
4.91 (44)
통화 강도 마법사는 성공적인 거래를 위한 올인원 솔루션을 제공하는 매우 강력한 지표입니다. 표시기는 여러 시간 프레임의 모든 통화 데이터를 사용하여 이 또는 해당 외환 쌍의 힘을 계산합니다. 이 데이터는 특정 통화의 힘을 확인하는 데 사용할 수 있는 사용하기 쉬운 통화 지수 및 통화 전력선의 형태로 표시됩니다. 필요한 것은 거래하려는 차트에 표시기를 부착하는 것뿐입니다. 표시기는 거래하는 통화의 실제 강세를 보여줍니다. 지표는 또한 추세와 거래할 때 유리하게 사용할 수 있는 구매 및 판매 거래량 압력의 극한값을 보여줍니다. 지표는 또한 피보나치에 기반한 가능한 대상을 보여줍니다. 표시기는 PUSH 알림을 포함한 모든 유형의 알림을 제공합니다. 구매 후 연락주세요. 나는 당신과 거래 팁을 공유하고 당신에게 무료로 훌륭한 보너스 지표를 줄 것입니다! 나는 당신에게 행복하고 유익한 거래를 기원합니다!
Trend Forecasting
Mohamed Hassan
5 (15)
This indicator is unstoppable when combined with our other indicator called Katana. After purchase, send us a message and you could get Katana for FREE as a BONUS After purchase, send us a private message for your instructions.  MT5 version: click here 40 copies available at $55. There are 3 copies left before the next price of $105. Don't miss this great deal!  The Trend Forecasting indicator is a very unique & easy tool that is able to make prediction about future price movement
Advanced Currency IMPULSE with ALERT
Bernhard Schweigert
4.91 (493)
현재 31% 할인!! 초보자 또는 전문가 트레이더를 위한 최고의 솔루션! 이 지표는 우리가 독점 기능과 비밀 공식을 통합했기 때문에 독특하고 고품질이며 저렴한 거래 도구입니다. 단 하나의 차트로 28개 통화 쌍 모두에 대한 경고를 제공합니다. 새로운 추세 또는 스캘핑 기회의 정확한 트리거 포인트를 정확히 찾아낼 수 있기 때문에 거래가 어떻게 개선될지 상상해 보십시오! 새로운 기본 알고리즘을 기반으로 구축되어 잠재적인 거래를 훨씬 더 쉽게 식별하고 확인할 수 있습니다. 이는 통화의 강세 또는 약세가 가속되는지 여부를 그래픽으로 표시하고 가속 속도를 측정하기 때문입니다. 자동차의 속도계처럼 생각하면 됩니다. 가속화할 때 Forex 시장에서 동일한 일이 분명히 더 빠르게 발생합니다. 즉, 반대 방향으로 가속화되는 통화를 페어링하면 잠재적으로 수익성 있는 거래를 식별한 것입니다. 통화 모멘텀의 수직선과 화살표가 거래를 안내합니다! 역동적인 Market Fibonacci 23
FX Volume
Daniel Stein
4.6 (35)
모닝 브리핑을 통해 세부 정보와 스크린샷으로 매일 시장 업데이트를 받으세요 여기 mql5 및 텔레그램에서 FX 거래량은 브로커의 관점에서 시장 심리에 대한 실제 통찰력을 제공하는 최초이자 유일한 거래량 지표입니다. 브로커와 같은 기관 시장 참여자가 외환 시장에서 어떤 포지션을 취하고 있는지에 대한 훌륭한 통찰력을 COT 보고서보다 훨씬 빠르게 제공합니다. 차트에서 이 정보를 직접 확인하는 것은 트레이딩의 진정한 판도를 바꾸고 획기적인 솔루션입니다. 다음과 같은 고유한 시장 데이터 인사이트의 이점 비율 는 통화의 매수/매도 포지션 비율을 백분율로 표시 비율 변화 는 선택한 기간 내 매수 비율과 비율 변화를 표시 총 거래량 는 해당 통화의 총 거래량(롱 및 숏)을 로트 단위로 보여줍니다 Volumes Long 는 해당 통화의 모든 롱 포지션의 거래량을 보여줍니다 Volumes Short 는 해당 통화의 모든 숏 포지션의 거래량을 보여줍니다 Net Long 는 순 롱 포지션의 거래량
Up Down v6
Guner Koca
4.67 (9)
up-down indicator is no repaint and works all pairs and lower than weekly time frames charts. it is suitable also 1 m charts for all pairs. and hold long way to signal. dont gives too many signals. when red histogram cross trigger line that is up signal.and price probably will down when blue histogram cross trigger line that is down signal.and price probably will go up. when the signals not seen press + button on terminal . too see weekly chart because of low data on chart ,it needs to lower p
Shepherd Harmonic Pattern
Abdullah Alrai
4.68 (59)
이 지표는 수동 및 자동 방법으로 차트에 그려진 고조파 패턴을 감지합니다. 사용자 매뉴얼은 다음 링크에서 확인할 수 있습니다. 리뷰를 작성하고 문의하면 무료 버전으로 MT4에서 제품을 시도할 수 있습니다. Gartley 및 Nenstar 패턴을 감지하는 데 사용할 수 있습니다. https://www.mql5.com/en/market/product/30181 전체 MT4 버전을 구입하려면 다음에서 구입할 수 있습니다. https://www.mql5.com/en/market/product/15212 참고 사항 지표에는 제어 패널이 있으며 모든 (차트 및 시간대) 설정을 저장합니다. 차트에서 더 많은 공간을 확보하려면 최소화할 수 있으며, 다른 분석 도구로 작업하는 것이 선호되는 경우 모든 지표 데이터를 숨기려면 닫기 버튼을 누를 수 있습니다. 이 지표를 사용하고 설정을 변경하면 이동 평균 또는 볼린저 밴드와 같은 지표를 추가하면 자동으로 템플릿을 저장하고 필요할 때 언제든지 로드할 수
TakePropips Donchian Trend Pro
Eric John Pajarillaga Aldana
4.82 (17)
TakePropips Donchian Trend Pro   (MT4)는 Donchian 채널을 사용하여 추세의 방향을 자동으로 감지하고 진입 및 퇴장 거래 신호를 제공하는 강력하고 효과적인 도구입니다! 이 다기능 지표에는 추세 스캐너, 거래 신호, 통계 패널, 스크리너, 거래 세션 및 경고 내역 대시보드가 포함됩니다. 거래 신호를 제공하고 차트 분석 시간을 절약하도록 설계되었습니다! 다음 블로그 게시물에서 사용자 설명서 및 설치 가이드를 다운로드할 수 있습니다.   https://www.mql5.com/en/blogs/post/751368 오늘 50% 할인을 받으세요! 가격이 $98에서 $49로 인하되었습니다! 전략 테스터에서 이 지표를 테스트할 수 있습니다(비주얼 모드 활성화). 실시간 차트에서 테스트하고 싶다면 저에게 메시지를 보내 7일 평가판을 받을 수도 있습니다. 자세한 내용은 설명 아래에 비디오 자습서도 제공됩니다. 질문이 있거나 도움이 필요하면 저에게 연락하십시오.
제작자의 제품 더 보기
Kfx Rsi 201
Peter Kariuki Thande
5 (3)
KFX RSI Dashboard   uniquely monitors RSI levels on multiple currency pairs (selectable by you) at once and displays them in a two-column list of lower timeframe and higher timeframe (selectable by you). The currency pairs are the combinations of the major currencies (USD, EUR, GBP, CHF, JPY, CAD, AUD, and NZD). All the currency pairs are sorted automatically based on RSI Levels from this the indicator allows one of two output options: 1. Currency Strength   OR   2. RSI Level What's the Str
KFX Dashboard
Peter Kariuki Thande
5 (2)
KFX Dashboard monitors Price Action using Candle Direction + Moving Average on Multiple currency pairs (selectable by you) and on Multiple Timeframes (selectable by you). The dashboard also reveals Currency Strength of pairs based on your Moving Average selection. FEATURES - Price Action: Candle Direction + Moving Averages(3x shown on chart). - Multiple Symbols and Multiple Timeframes. - Currency Strength Analysis. - Monitors Open Trades: Currency Amount + Pips. - Symbol button(click) chang
KFX Dashboard EA
Peter Kariuki Thande
** Automatically Adds to your existing trades that you open ** KFX Dashboard EA monitors Price Action using Candle Direction + Moving Average on Multiple currency pairs (selected by you) and on Multiple Timeframes (selected by you). The dashboard also reveals Currency Strength of pairs based on your Moving Average selection. KFX Dashboard EA option to set Stop Loss(SL) and Take Profit(TP) based on your selected Timeframe and ATR / Points settings. Trailing stop by ATR / Points also available (s
필터:
Jason Carson
442
Jason Carson 2023.08.07 20:08 
 

I only use it for the symbol changer. Really need a version that doesn't include all the other stuff that gets in the way. I set all the colors to none. But when hovering over the chart, the popup for this KFX changer shows up everywhere which is annoying. Would be 5 stars if it was just the changer.

leo1618
74
leo1618 2022.12.09 10:16 
 

A useful tool that works well, thanks for the indicator.

carterluk3
24
carterluk3 2022.11.27 07:55 
 

Good.

리뷰 답변
버전 1.2 2022.12.08
UPDATE 1.02
- Fixes and Improvements.