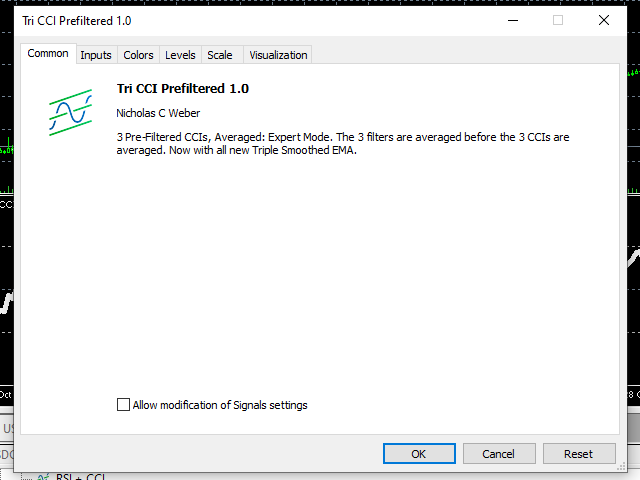
• 미리보기
  • 리뷰
  • 코멘트
  • 새 소식

Tri CCI PreFiltered

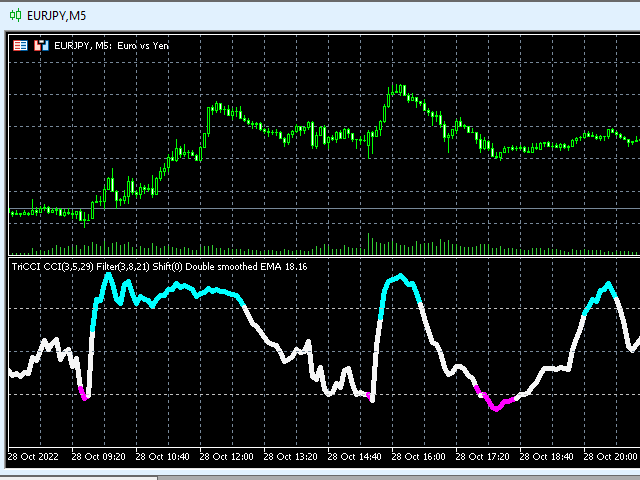
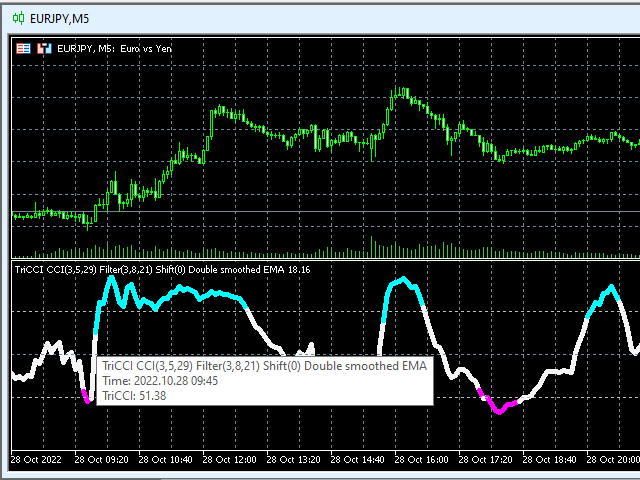
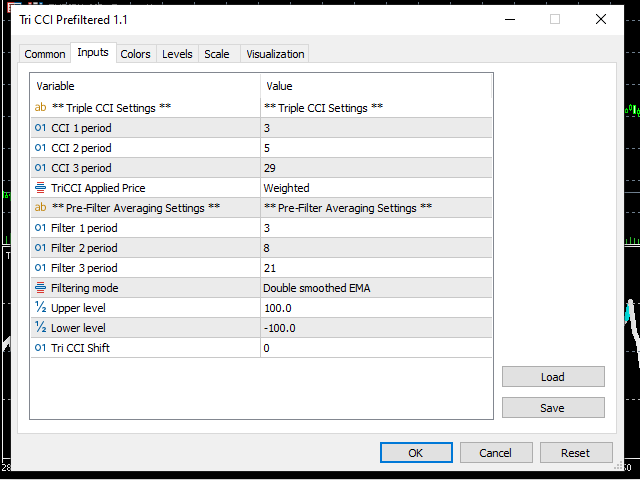
This is 3 pre-filtered CCI, Commodity Channel Index, indicators pre-filtered by your choice of 3 Smoothing and/or Averaging methods. I have found certain settings to be very reliable and I plan to incorporate this into an Expert Advisor in the future.

I have added a new form of Averaging: Smoothed TEMA, or Triple Smoothed EMA, Exponential Moving Average. It gives less noise than the TEMA, but provides the smoothing of the Double Smoothed EMA, so it should be a slight bit quicker.

PLEASE Download and Demo it on some back-test charts to see what I mean.

Thank You! Good luck out there. Hopefully the CCI Trident will give you the edge you need(so cheesy..)!


Tips: use as a crossover of the 100/-100 line, 0 line, trend indicator, or two used as stochastics. For a Stochastics, you can use close/weighted price as the main line and a 2nd indicator with Open price and slightly slower period and/or use the shift control to bump the line over a few bars.

Notes: I'm planning to add an alert feature in the future. Let me know if that's something you need!

Prices to choose from:

Close
Open
High
Low
Median
Typical
Weighted
Average (high+low+open+close)/4


Averages to choose from:

Simple moving average
Exponential moving average
Double smoothed EMA
Double EMA
Triple smoothed EMA
Triple EMA
Smoothed MA
Linear weighted MA
Parabolic weighted MA
Alexander MA
Volume weighted MA
Hull MA
Triangular MA
Sine weighted MA
Linear regression value
IE/2
Non lag MA
Zero lag EMA
Leader EMA

추천 제품
Owl Smart Levels MT5
Sergey Ermolov
4.47 (36)
MT4 버전  |  FAQ Owl Smart Levels Indicator 는 Bill Williams 의 고급 프랙탈, 시장의 올바른 파동 구조를 구축하는 Valable ZigZag, 정확한 진입 수준을 표시하는 피보나치 수준과 같은 인기 있는 시장 분석 도구를 포함하는 하나의 지표 내에서 완전한 거래 시스템입니다. 시장과 이익을 취하는 장소로. 전략에 대한 자세한 설명 표시기 작업에 대한 지침 고문-거래 올빼미 도우미의 조수 개인 사용자 채팅 ->구입 후 나에게 쓰기,나는 개인 채팅에 당신을 추가하고 거기에 모든 보너스를 다운로드 할 수 있습니다 힘은 단순함에 있습니다! Owl Smart Levels 거래 시스템은 사용하기 매우 쉽기 때문에 전문가와 이제 막 시장을 연구하고 스스로 거래 전략을 선택하기 시작한 사람들 모두에게 적합합니다. 전략 및 지표에는 눈에 보이지 않는 비밀 공식 및 계산 방법이 없으며 모든 전략 지표는 공개되어 있습니다. Owl Smart Levels를
Noize Absorption Index
Ekaterina Saltykova
Noize Absorption Index - is the manual trading system that measures the difference of pressure between bears forces and bulls forces. Green line - is a noize free index that showing curent situation. Zero value of index shows totally choppy/flat market.Values above zero level shows how powerfull bullish wave is and values below zero measures bearish forces.Up arrow appears on bearish market when it's ready to reverse, dn arrow appears on weak bullish market, as a result of reverse expectation.
An indicator of pattern #31 ("Long Island") from Encyclopedia of Chart Patterns by Thomas N. Bulkowski. The second gap is in the opposite direction. Parameters: Alerts - show alert when an arrow appears   Push - send a push notification when an arrow appears (requires configuration in the terminal) GapSize - minimum gap size in points ArrowType - a symbol from 1 to 17 ArrowVShift - vertical shift of arrows in points   ShowLevels - show levels ColUp - color of an upward line ColDn - color of a
QM Pattern Scanner MT5
Reza Aghajanpour
5 (3)
QM (Quasimodo) Pattern is based on Read The Market(RTM) concepts. The purpose of this model is to face the big players of the market (financial institutions and banks), As you know in financial markets, big traders try to fool small traders, but RTM prevent traders from getting trapped. This style is formed in terms of price candles and presented according to market supply and demand areas and no price oscillator is used in it. RTM concepts are very suitable for all kinds of investments, includi
Swing Tracer
Ely Alsedy
5 (2)
it depends on ATR period to get swing points to help make better trading decisions  blue dot and red dot is the default color scheme of course you can change it later if you'd like  you can change the following : ATR PERIOD  sending notifications number of times to send notifications  sending notifications to your smart phone that's it very simple to use just drag and drop and follow the trend 
Premium level Pro
Dmitriy Kashevich
Premium level is a unique indicator with more than 80% accuracy of correct predictions! This indicator has been tested for more than two months by the best Trading Specialists! The author's indicator you will not find anywhere else! From the screenshots you can see for yourself the accuracy of this tool! 1 is great for trading binary options with an expiration time of 1 candle. 2 works on all currency pairs, stocks, commodities, cryptocurrencies Instructions: As soon as the red ar
Double HMA MTF for MT5
Pavel Zamoshnikov
5 (2)
This is an advanced multi-timeframe version of the popular Hull Moving Average (HMA) Features Two lines of the Hull indicator of different timeframes on the same chart. The HMA line of the higher timeframe defines the trend, and the HMA line of the current timeframe defines the short-term price movements. A graphical panel with HMA indicator data from all timeframes at the same time . If the HMA switched its direction on any timeframe, the panel displays a question or exclamation mark with a tex
Introduction The "Two Moving Average Crossover" indicator for MetaTrader 5 (MT5) is a technical analysis tool that displays two moving averages and notifies when the moving averages cross each other. The indicator calculates and plots two moving averages, one of which is faster and the other is slower. When the faster moving average crosses above the slower moving average, it is considered a bullish signal, indicating a potential trend reversal or the start of a new uptrend. Conversely, when th
Atomic Analyst MT5
Issam Kassas
3.64 (11)
우선적으로 언급할 점은이 거래 지표가 다시 그리지 않고 지연되지 않으며 이를 통해 수동 및 로봇 거래 모두에 이상적이라는 점입니다. Atomic Analyst는 가격의 강도와 모멘텀을 활용하여 시장에서 더 나은 이점을 찾는 PA Price Action Indicator입니다. 고급 필터를 장착하여 잡음과 거짓 신호를 제거하고 거래 잠재력을 높이는 데 도움이 됩니다. 복잡한 지표의 다중 레이어를 사용하여 Atomic Analyst는 차트를 스캔하고 복잡한 수학적 계산을 간단한 신호와 색상으로 변환하여 초보 트레이더가 이해하고 일관된 거래 결정을 내릴 수 있도록합니다. "Atomic Analyst"는 새로운 및 경험이 풍부한 트레이더를위한 종합적인 거래 솔루션입니다. 프리미엄 지표와 최고 수준의 기능을 하나의 거래 전략에 결합하여 모든 종류의 트레이더에 대한 다재다능한 선택지가되었습니다. 인트라데이 거래 및 스캘핑 전략 : 빠르고 정확한 일일 거래 및 단기 거래를 위해 설계
Trend Monitor MT5
Pavel Zamoshnikov
3.67 (3)
The indicator generates early signals basing on ADX reading data combined with elements of price patterns. Works on all symbols and timeframes. The indicator does not redraw its signals. You see the same things on history and in real time. For better visual perception signals are displayed as arrows (in order not to overload the chart). Features The best results are obtained when the indicator works on two timeframes. For example: M30 – the indicator shows the main trend; M5 – the indicator ge
Trend Master Chart MT5
Frederic Jacques Collomb
5 (1)
Trend Master Chart는 귀하에게 필요한 추세 지표입니다. 차트를 오버레이하고 색상 코딩을 사용하여 다양한 시장 동향/움직임을 정의합니다. 두 개의 이동 평균과 서로 다른 오실레이터를 결합하는 알고리즘을 사용합니다. 이 세 가지 요소의 기간은 수정 가능합니다. 모든 시간대와 모든 쌍에서 작동합니다. 한 눈에 상승 또는 하락 추세와 이 추세의 다양한 진입점을 식별할 수 있습니다. 예를 들어 뚜렷한 상승 추세(밝은 녹색) 동안 이 추세 내의 다양한 시장 충동은 짙은 녹색 양초로 표시됩니다. 구성 가능한 경고를 사용하면 이러한 충동 중 하나를 놓치지 않을 수 있습니다. MT4 버전. 입력 매개변수: Period 1: 빠른 기간 이동 평균. Period 2: 느린 기간 이동 평균. Oscillator period: 오실레이터 기간. Sell/Buy alert: 시장 충동 경고, 추세 진입점. Bullish/Bearish a
FREE
Rainbow EA MT5
Jamal El Alama
Description : Rainbow EA MT5 is a simple Expert advisor based on   Rainbow MT5 indicator witch is based on Moving average with period 34. The indicator is incorporated in the EA, therefore, it is not required for the EA to operate, but if you wish, you can download it from   my product page . The Expert Advisor settings are as follows : Suitable for Timeframes up to H1 The parameters below can be set according to your trading rules. StopLoss ( Stop Loss in pips) TakeProfit ( Take Profit in pi
Renko Gold
Ignacio Agustin Mene Franco
Renko Gold! clearly indicates the floors and ceilings where it goes from 4 lines, the line below that marks the floor in green confirming with the thinnest line clarifies the purchase entry, the same is for sale, the top line marks the ceiling and the thinnest red line marks the sale, This indicator works for all temporalities! For Forex and Synthetic Indices markets! It also works for crypto markets! Good profit! World Investor.
Fit Line Trending
Ta Thi Thuy Linh
Fit line supports to extrapolation next movement of market, support for buy/sell decision. Indicator using spline algorithm to extrapolation.  You can change number of spline with parameter "PointsNumber" and number of extrapolation point with "ExtrapolateBars". Eextrapolation points will be save into csv format, with prefix in parameter "PointsPrefix", and store in folder File of Data Folder.
Cumulative Delta NG
Anton Polkovnikov
Cumulative delta indicator As most traders believe, the price moves under the pressure of market buying or selling. When someone redeems an offer standing in the cup, the deal is a "buy". If someone pours into the bid standing in the cup - the deal goes with the direction of "sale". The delta is the difference between purchases and sales. A cumulative delta - the difference between the cumulative sum of purchases and sales for a certain period of time. It allows you to see who is currently contr
Ichimoku Aiko MTF
Michael Jonah Randriamampionontsoa
Ichimoku Aiko MTF is a collection of technical indicators that show support and resistance levels, as well as momentum and trend direction. It is a multi-timeframe indicator so you don't need to change the chart timeframe when you want to see the ichimoku clouds on a higher timeframe.  eg. The chart timeframe is M15 and you want to see on the M15 timeframe chart the H1 ichimoku indicators (the ichimoku in Metatrader can't do that) that's why you need to use Ichimoku Aiko MTF.
Indicator and Expert Adviser  EA Available in the comments section of this product. Download with Indicator must have indicator installed for EA to work. Mt5 indicator alerts for bollinger band and envelope extremes occurring at the same time. Buy signal alerts occur when A bullish candle has formed below both the lower bollinger band and the lower envelope  Bar must open and close below both these indicators. Sell signal occur when A bear bar is formed above the upper bollinger band and upp
표시기는 가능한 최소 지연으로   다시 칠하지 않고   차트의 고조파 패턴을 보여줍니다. 지표 상단 검색은 가격 분석의 파동 원리를 기반으로 합니다. 고급 설정을 통해 거래 스타일에 대한 매개변수를 선택할 수 있습니다. 양초(막대)가 열릴 때 새로운 패턴이 형성되면 가격 변동의 가능성이 있는 방향의 화살표가 고정되어 변경되지 않습니다. 표시기는 ABCD, Gartley(Butterfly, Crab, Bat), 3Drives, 5-0, Batman, SHS, One2One, Camel, Triangles, WXY, Fibo, Vibrations와 같은 패턴과 그 종류를 인식합니다. 기본적으로 ABCD 및 Gartley 수치만 설정에 표시됩니다. 많은 추가 구성 가능한 매개변수. 주요 매개변수: ShowUpDnArrows - 가능한 방향 화살표 표시/숨기기 ArrowUpCode - 위쪽 화살표 코드 ArrowDnCode - 아래쪽 화살표 코드 Show old history pattern
40% off. Original price: $50 Advanced Bollinger Bands Scanner is a multi symbol multi timeframe Bollinger bands dashboard that monitors and analyzes the Bollinger Bands indicator from one chart. This panel scans the Bollinger bands indicator in up to 28 configurable instruments and 9 timeframes for price overbought/oversold, price consolidation (Bollinger bands squeeze), and consolidation breakout (squeeze break)  with a deep scan feature to scan all market watch symbols (up to 1000 instruments
HMA Trend Professional MT5
Pavel Zamoshnikov
4.4 (5)
Improved version of the free HMA Trend indicator (for MetaTrader 4) with statistical analysis. HMA Trend is a trend indicator based on the Hull Moving Average (HMA) with two periods. HMA with a slow period identifies the trend, while HMA with a fast period determines the short-term movements and signals in the trend direction. The main differences from the free version: Ability to predict the probability of a trend reversal using analysis of history data. Plotting statistical charts for analyz
Stochastic R
Antony Augustine
Stochastic  Reversal  allows you to recognize reversals professionally. Stochastic Indicator: This technical indicator was developed by George Lane more than 50 years ago. The reason why this indicator survived for so many years is because it continues to show consistent signals even in these current times. The Stochastic indicator is a momentum indicator that shows you how strong or weak the current trend is. It helps you identify overbought and oversold market conditions within a trend.  Rules
Volality Index Scalper
Lesedi Oliver Seilane
Volality Index scalper indicator  Meant for Volality pairs such as Volality 10, 25, 50, 75 and 100 The indicator works on all timeframes from the 1 minute to the monthly timeframe the indicator is non repaint the indicator has 3 entry settings 1 color change on zero cross 2 color change on slope change 3 color change on signal line cross Orange line is your sell signal Blue line is your buy signal.
TVf Channel
Nicholas C Weber
I really like this indicator. But I made it, so of course I would.. NOW FREE. But please consider supporting me by buying my 2 for sale indicators. You can multiply the weight of each indicator used to give more emphasis on it's value when averaging between the 3. Boost fast TEMA and it can move the indicator faster. Boost slow FrAMA and watch it smooth out. I like to use them as open/close lines and set them up so they move quick, but have the FrAMA smooth it out more.  Check out my other ind
PipFinite Trend PRO MT5
Karlo Wilson Vendiola
4.87 (664)
Breakthrough Solution For Trend Trading And Filtering With All Important Features Built Inside One Tool! Trend PRO's smart algorithm detects the trend, filters out market noise and gives entry signals with exit levels. The new features with enhanced rules for statistical calculation improved the overall performance of this indicator. Important Information Revealed Maximize the potential of Trend Pro, please visit www.mql5.com/en/blogs/post/713938 The Powerful Expert Advisor Version Automa
This indicator tracks the market trend with an unmatched reliability, by ignoring sudden fluctuations and market noise. It has been designed to trend-trade intraday charts and small timeframes. Its winning ratio is around 85%. [ Installation Guide | Update Guide | Troubleshooting | FAQ | All Products ] Amazingly easy to trade Find oversold/overbought situations Enjoy noise-free trading at all times Avoid being whipsawed in intraday charts The indicator analyzes its own quality and performance It
Market Structure Patterns
Samuel Manoel De Souza
4.7 (20)
Market Structure Patterns is an indicator based on smart money concepts that displays almost all of the SMC/ICT elements needed to take your trading decisions to the next level. Take advantage of the alerts , push notifications and email messages to keep informed from when an element is formed on the chart, the price crosses a level and/or enters in a box/zone. Developers can access the values of the elements of the indicator using the global variables  what allows the automation of trading deci
무한대에서 통화의 강도를 측정하는이 혁신적인 지표는 오랫동안 거래하는 암표 및 거래자에게 없어서는 안될 조수입니다. 통화의 강도/약점을 분석하는 시스템은 오랫동안 알려져 있으며 세계 최고의 거래자들에 의해 시장에서 사용되었습니다. 이 분석 없이는 차익 거래가 완료되지 않습니다. 우리의 지표는 서로 관련하여 기본 통화의 강도를 쉽게 결정합니다. 표시 라인에 차트에 대한 모든 또는 현재 통화 쌍의 수 있도록 즉각적인 분석 및 검색에 대한 강한 진입 점. 표시등,직관적 인 사용하면 신속하게 찾아와 스위치는 모든 쌍,모바일 패널 배치할 수 있는 모두에서 지하실에는 기본 차트. 통화의 강도의 변화의 통지의 타이머 모드는 상인에게 전화로 알림을받을 수있는 기회를 제공합니다.  통화 전력계 무한대 표시기를 사용하기위한 몇 가지 전략: 1. 신흥 추세에 대한 신호로 교차점을 검색 할 통화의 강도의 선형 표시의 차트를 사용하여 2. 추세 반전 신호가 나타난 후 강한 통화 방향으로 두피
Dark Support Resistance  is an Indicator for intraday trading. This Indicator is programmed to identify  Support and Resistance Lines , providing a high level of accuracy and reliability. Key benefits Easily visible lines Only the most important levels will be displayed Automated adjustment for each timeframe and instrument Easy to use even for beginners Never repaints, never backpaints, Not Lag 100% compatible with Expert Advisor development All types of alerts available: Pop-up, Email, Pus
This indicator is used to compare the relative strength of the trade on the chart against the other several selected symbols. By comparing the price movement of each traded variety based on the same base day, several trend lines of different directions can be seen, reflecting the strong and weak relationship between the several different traded varieties, so that we can have a clearer understanding of the market trend. For example, you can apply this indicator on a EurUSD chart and compare it
PipFinite Exit EDGE MT5
Karlo Wilson Vendiola
4.89 (35)
Did You Have A Profitable Trade But Suddenly Reversed? In a solid strategy, exiting a trade is equally important as entering. Exit EDGE helps maximize your current trade profit and avoid turning winning trades to losers. Never Miss An Exit Signal Again Monitor all pairs and timeframes in just 1 chart www.mql5.com/en/blogs/post/726558 How To Trade You can close your open trades as soon as you receive a signal Close your Buy orders if you receive an Exit Buy Signal. Close your Sell orde
이 제품의 구매자들이 또한 구매함
우선 이 거래 시스템이 리페인팅, 리드로잉 및 레이그 인디케이터가 아니라는 점을 강조하는 것이 중요합니다. 이는 수동 및 로봇 거래 모두에 이상적인 것으로 만듭니다. "스마트 트렌드 트레이딩 시스템 MT5"은 새로운 및 경험이 풍부한 트레이더를 위해 맞춤형으로 제작된 종합적인 거래 솔루션입니다. 10개 이상의 프리미엄 인디케이터를 결합하고 7개 이상의 견고한 거래 전략을 특징으로 하여 다양한 시장 조건에 대한 다목적 선택이 가능합니다. 트렌드 추종 전략: 효과적인 트렌드 추이를 타기 위한 정확한 진입 및 손절 관리를 제공합니다. 반전 전략: 잠재적인 트렌드 반전을 식별하여 트레이더가 범위 시장을 활용할 수 있게 합니다. 스캘핑 전략: 빠르고 정확한 데이 트레이딩 및 단기 거래를 위해 설계되었습니다. 안정성: 모든 인디케이터가 리페인팅, 리드로잉 및 레이그가 아니므로 신뢰할 수 있는 신호를 보장합니다. 맞춤화: 개별 거래 선호도를 고려한 맞춤형 전략을 지원합니다. 최상의 전략을 찾는
Quantum Trend Sniper
Bogdan Ion Puscasu
5 (37)
소개       Quantum Trend Sniper Indicator는   추세 반전을 식별하고 거래하는 방식을 변화시키는 획기적인 MQL5 지표입니다! 13년 이상의 거래 경험을 가진 숙련된 트레이더 팀이 개발한       Quantum Trend Sniper 표시기       매우 높은 정확도로 추세 반전을 식별하는 혁신적인 방법으로 거래 여정을 새로운 차원으로 끌어올리도록 설계되었습니다. ***Quantum Trend Sniper Indicator를 구입하면 Quantum Breakout Indicator를 무료로 받을 수 있습니다!*** Quantum Trend Sniper Indicator는 추세 반전을 식별하고 세 가지 이익실현 수준을 제안할 때 경고, 신호 화살표를 제공합니다. 초보자 거래자와 전문 거래자 모두에게 적합합니다. Quantum EA 채널:       여기를 클릭하세요 MT4 버전:       여기를 클릭하세요
Trend Screener Pro MT5
STE S.S.COMPANY
4.89 (61)
트렌드 표시기, 트렌드 트레이딩 및 필터링을 위한 획기적인 고유 솔루션, 하나의 도구 안에 내장된 모든 중요한 트렌드 기능! Forex, 상품, 암호 화폐, 지수 및 주식과 같은 모든 기호/도구에 사용할 수 있는 100% 다시 칠하지 않는 다중 시간 프레임 및 다중 통화 표시기입니다. Trend Screener는 차트에 점이 있는 화살표 추세 신호를 제공하는 효율적인 지표 추세 추종 지표입니다. 추세 분석기 표시기에서 사용할 수 있는 기능: 1. 트렌드 스캐너. 2. 최대 이익 분석이 있는 추세선. 3. 추세 통화 강도 측정기. 4. 경고가 있는 추세 반전 점. 5. 경고가 있는 강력한 추세 점. 6. 추세 화살표 Trend Screener Indicator가 있는 일일 분석 예, 일일 신호 성능...등은 여기에서 찾을 수 있습니다. 여기를 클릭하십시오. LIMITED TIME OFFER : Trend Screener Indicator는 50$ 및 평생 동안만 사용할 수 있습니다
FX Volume MT5
Daniel Stein
4.94 (17)
모닝 브리핑을 통해 세부 정보와 스크린샷으로 매일 시장 업데이트를 받으세요 여기 mql5 및 텔레그램에서 FX 거래량은 브로커의 관점에서 시장 심리에 대한 실제 통찰력을 제공하는 최초이자 유일한 거래량 지표입니다. 브로커와 같은 기관 시장 참여자가 외환 시장에서 어떤 포지션을 취하고 있는지에 대한 훌륭한 통찰력을 COT 보고서보다 훨씬 빠르게 제공합니다. 차트에서 이 정보를 직접 확인하는 것은 트레이딩의 진정한 판도를 바꾸고 획기적인 솔루션입니다. 다음과 같은 고유한 시장 데이터 인사이트의 이점 비율 는 통화의 매수/매도 포지션 비율을 백분율로 표시 비율 변화 는 선택한 기간 내 매수 비율과 비율 변화를 표시 총 거래량 는 해당 통화의 총 거래량(롱 및 숏)을 로트 단위로 보여줍니다 Volumes Long 는 해당 통화의 모든 롱 포지션의 거래량을 보여줍니다 Volumes Short 는 해당 통화의 모든 숏 포지션의 거래량을 보여줍니다 Net Long 는 순 롱 포지션의 거래량
FX Power MT5 NG
Daniel Stein
5 (4)
모닝 브리핑 여기 mql5 와 텔레그램에서 FX Power MT5 NG 는 오랫동안 인기 있는 통화 강도 측정기인 FX Power의 차세대 버전입니다. 이 차세대 강도 측정기는 무엇을 제공합니까? 기존 FX Power에서 좋아했던 모든 것 PLUS GOLD/XAU 강도 분석 더욱 정밀한 계산 결과 개별 구성 가능한 분석 기간 더 나은 성능을 위한 사용자 정의 가능한 계산 한도 특별 멀티더 많은 것을보고 싶은 사람들을위한 특별한 다중 인스턴스 설정 모든 차트에서 좋아하는 색상을위한 끝없는 그래픽 설정 수많은 알림 옵션, 중요한 것을 다시는 놓치지 않도록 Windows 11 및 macOS 스타일의 둥근 모서리가 있는 새로운 디자인 마법처럼 움직이는 인디케이터 패널 FX 파워 키 특징 모든 주요 통화의 완전한 강세 이력 모든 시간대에 걸친 통화 강세 이력 모든 브로커 및 차트에서 고유 계산 결과 100% 신뢰할 수있는 실시간100 % 신뢰할 수있는 실시간 계산-> 다시 칠하지 않음
우선적으로, 이 거래 도구는 전문적인 거래에 이상적인 비-다시 그리기 및 지연되지 않는 지표입니다.  스마트 가격 액션 컨셉트 인디케이터는 신규 및 경험 많은 트레이더 모두에게 매우 강력한 도구입니다. Inner Circle Trader Analysis 및 Smart Money Concepts Trading Strategies와 같은 고급 거래 아이디어를 결합하여 20가지 이상의 유용한 지표를 하나로 결합합니다. 이 인디케이터는 스마트 머니 컨셉트에 중점을 두어 대형 기관의 거래 방식을 제공하고 이동을 예측하는 데 도움을 줍니다.  특히 유동성 분석에 뛰어나 기관이 어떻게 거래하는지 이해하는 데 도움을 줍니다. 시장 트렌드를 예측하고 가격 변동을 신중하게 분석하는 데 탁월합니다. 귀하의 거래를 기관 전략에 맞추어 시장의 동향에 대해 더 정확한 예측을 할 수 있습니다. 이 인디케이터는 시장 구조를 분석하고 중요한 주문 블록을 식별하고 다양한 패턴을 인식하는 데 뛰어납니다. 
Advanced Supply Demand MT5
Bernhard Schweigert
4.53 (15)
현재 33% 할인! 초보자나 전문 트레이더를 위한 최고의 솔루션! 이 보조지표는 우리가 다수의 독창적 기능과 새로운 공식을 통합한 독특하고 고품질이며 저렴한 거래 도구입니다. 이 업데이트를 통해 이중 시간대를 표시할 수 있습니다. 더 높은 TF를 표시할 수 있을 뿐만 아니라 차트 TF와 더 높은 TF 모두를 표시할 수 있습니다: 중첩 영역 표시. 모든 Supply Demand 트레이더들이 좋아할 것입니다. :) 중요한 정보 공개 Advanced Supply Demand의 잠재력을 극대화하려면 다음을 방문하십시오. https://www.mql5.com/ko/blogs/post/720245   진입 또는 목표의 명확한 트리거 포인트를 정확히 찾아냄으로 해서 거래가 어떻게 개선될지 상상해 보십시오. 새로운 알고리즘을 기반으로 매수자와 매도자 간의 잠재적인 불균형을 훨씬 더 쉽게 분간할 수 있습니다. 왜냐하면 가장 강한 공급영역과 가장 강한 수요 영역과 과거에 어떻게 진행 되었는지를(이
RelicusRoad Pro MT5
Relicus LLC
4.81 (21)
이제 $ 147 (몇 가지 업데이트 후 $ 499 증가) - 무제한 계정 (PCS 또는 MACS) RelicusRoad 사용 설명서 + 교육 비디오 + 비공개 Discord 그룹 액세스 + VIP 상태 시장을 보는 새로운 방법 RelicusRoad는 외환, 선물, 암호화폐, 주식 및 지수에 대한 세계에서 가장 강력한 거래 지표로서 거래자에게 수익성을 유지하는 데 필요한 모든 정보와 도구를 제공합니다. 우리는 초보자부터 고급까지 모든 거래자가 성공할 수 있도록 기술적 분석 및 거래 계획을 제공합니다. 미래 시장을 예측할 수 있는 충분한 정보를 제공하는 핵심 거래 지표입니다. 우리는 차트에서 말이 안 되는 여러 지표 대신 완전한 솔루션을 믿습니다. 타의 추종을 불허하는 매우 정확한 신호, 화살표 + 가격 조치 정보를 표시하는 올인원 표시기입니다. 강력한 AI를 기반으로 하는 RelicusRoad는 누락된 정보와 도구를 제공하여 교육하고 성공적인 트레이더인 트레이딩 전문
XQ Indicator MetaTrader 5
Marzena Maria Szmit
5 (1)
Step into the realm of Forex trading with confidence and precision using XQ, a cutting-edge Forex indicator designed to elevate your trading game to unprecedented heights. Whether you're a seasoned trader or just stepping into the world of currency exchange, XQ Forex Indicator empowers you with the insights and signals needed to make informed trading decisions. The signal conditions are a combination of three indicators, and XQ Forex Indicator only display  medium and long-term trends . The ind
Volume by Price MT5
Brian Collard
5 (3)
The Volume by Price Indicator for MetaTrader 5 features Volume Profile and Market Profile TPO (Time Price Opportunity). Get valuable insights out of currencies, equities and commodities data. Gain an edge trading financial markets. Volume and TPO histogram bar and line charts. Volume Footprint charts. TPO letter and block marker charts including split structures. Versatile segmentation and compositing methods. Static, dynamic and flexible ranges with relative and/or absolute visualizations. Lay
소개       Quantum Breakout PRO   , 브레이크아웃 존 거래 방식을 변화시키는 획기적인 MQL5 지표! 13년 이상의 거래 경험을 가진 숙련된 트레이더 팀이 개발한       퀀텀 브레이크아웃 PRO       혁신적이고 역동적인 브레이크아웃 존 전략으로 거래 여정을 새로운 차원으로 끌어올리도록 설계되었습니다. Quantum Breakout Indicator는 5개의 이익 목표 영역이 있는 브레이크아웃 영역의 신호 화살표와 브레이크아웃 상자를 기반으로 한 손절 제안을 제공합니다. 초보자 거래자와 전문 거래자 모두에게 적합합니다. Quantum EA 채널:       여기를 클릭하세요 중요한! 구매 후 설치 매뉴얼을 받으려면 개인 메시지를 보내주십시오. 추천: 기간: M15 통화쌍: GBPJPY, EURJPY, USDJPY,NZDUSD, XAUUSD 계정 유형: 스프레드가 매우 낮은 ECN, Raw 또는 Razor 브로커 시간: GM
Entry Points Pro for MT5
Yury Orlov
4.54 (157)
다시 색을 칠하지 않고 거래에 진입할 수 있는 정확한 신호를 제공하는 MT5용 지표입니다. 외환, 암호화폐, 금속, 주식, 지수 등 모든 금융 자산에 적용할 수 있습니다. 매우 정확한 추정값을 제공하고 매수와 매도의 가장 좋은 시점을 알려줍니다. 하나의 시그널로 수익을 내는 지표의 예와 함께 비디오 (6:22)시청하십시오! 대부분의 거래자는 Entry Points Pro 지표의 도움으로 첫 거래 주 동안 트레이딩 결과를 개선합니다. 저희의   Telegram Group 을 구독하세요! Entry Points Pro 지표의 좋은점. 재도색이 없는 진입 신호 신호가 나타나고 확인되면(시그널 캔들이 완성된 경우) 신호는 더 이상 사라지지 않습니다. 여타 보조지표의 경우 신호를 표시한 다음 제거되기 때문에 큰 재정적 손실로 이어집니다. 오류 없는 거래 게시 알고리즘을 통해 트레이드(진입 또는 청산)를 할 이상적인 순간을 찾을 수 있으며, 이를 통해 이를 사용하는 모든 거래자의
ICT, SMC, SMART MONEY CONCEPTS, SMART MONEY, Smart Money Concept, Support and Resistance, Trend Analysis, Price Action, Market Structure, Order Blocks, BOS/CHoCH,   Breaker Blocks ,  Momentum Shift,   Supply&Demand Zone/Order Blocks , Strong Imbalance,   HH/LL/HL/LH,    Fair Value Gap, FVG,  Premium  &   Discount   Zones, Fibonacci Retracement, OTE, Buy Side Liquidity, Sell Side Liquidity, BSL/SSL Taken, Equal Highs & Lows, MTF Dashboard, Multiple Time Frame, BigBar, HTF OB, HTF Market Structure
AW Trend Predictor MT5
AW Trading Software Limited
4.76 (54)
하나의 시스템에서 추세와 고장 수준의 조합입니다. 고급 지표 알고리즘은 시장 노이즈를 필터링하고 추세, 진입점 및 가능한 출구 수준을 결정합니다. 표시기 신호는 통계 모듈에 기록되어 가장 적합한 도구를 선택하여 신호 기록의 효율성을 보여줍니다. 이 표시기는 이익 실현 및 손절매 표시를 계산합니다. 매뉴얼 및 지침 ->   HERE   / MT4 버전 ->   HERE 지표로 거래하는 방법: Trend Predictor로 거래하는 것은 3단계로 간단합니다. 1단계 - 포지션 열기 70% 이상의 성공률로 매수 신호를 받았습니다. 2단계 - StopLoss 결정 반대 신호로 트렁크 선택 3단계 - 이익 실현 전략 정의 전략 1: TP1 도달 시 전체 포지션 청산 전략 2: TP1 도달 시 포지션의 50% 청산 및 TP2 도달 시 나머지 50% 청산 전략 3: 추세 반전 시 전체 포지션 청산 이익: 결과를 다시 그리지 않음, 신호는 엄격하게 양초가 닫힐 때 어드바이저에서 사용할 수 있습니
Auto Order Block with break of structure based on ICT and Smart Money Concepts Futures Break of Structure ( BoS )             Order block ( OB )            Higher time frame Order block / Point of Interest ( POI )    shown on current chart           Fair value Gap ( FVG ) / Imbalance   ,  MTF      ( Multi Time Frame )    Volume Imbalance     ,  MTF          vIMB Gap’s Equal High / Low’s     ,  MTF             EQH / EQL Liquidity               Current Day High / Low           HOD /
Blahtech Supply Demand MT5
Blahtech Limited
4.57 (14)
Was: $299  Now: $99   Supply Demand uses previous price action to identify potential imbalances between buyers and sellers. The key is to identify the better odds zones, not just the untouched ones. Blahtech Supply Demand indicator delivers functionality previously unavailable on any trading platform. This 4-in-1 indicator not only highlights the higher probability zones using a multi-criteria strength engine, but also combines it with multi-timeframe trend analysis, previously confirmed swings
ON Trade Gann Squares MT5
Abdullah Alrai
5 (1)
간 스퀘어 지표는 W.D. 간이 쓴 "시장 예측을 위한 수학적 공식" 기사에 기반한 강력한 시장 분석 도구입니다. 이 도구는 수학적 개념과 간 이론을 사용하여 정확한 시장 분석을 수행합니다. 144, 90, 52의 제곱과 9의 제곱을 사용합니다. 또한 의 9의 제곱근 및 해당 제곱의 채널 및 스타 패턴과의 관련성을 통합합니다. 사용자 메뉴얼 및 적용: 이 지표를 사용하기 전에 사용자 메뉴얼을 읽고 질문이 있을 경우 문의하시기 바랍니다. 전체 메뉴얼은 웹사이트에서 제공됩니다. MT5의 전체 버전을 구매하거나 MT4의 무료 버전을 테스트할 수 있습니다. 두 버전 모두 링크에서 확인하실 수 있습니다. 주요 기능 및 기능: 간 스퀘어 지표는 정확한 결정을 위해 기하학적 개념과 간 이론을 활용하는 시장 분석을 위한 포괄적인 도구 집합을 제공합니다. 주요 기능은 다음과 같습니다. 9의 제곱 분석:   이 지표는 9의 제곱에 대한 수평 선, 스타 패턴, 그리드 및 간 팬을 그릴 수 있습니다. 간
TrendMaestro5
Stefano Frisetti
note: this indicator is for METATRADER4, if you want the version for METATRADER5 this is the link:  https://www.mql5.com/it/market/product/108106 TRENDMAESTRO recognizes a new TREND in the bud, he never makes mistakes. The certainty of identifying a new TREND is priceless. DESCRIPTION TRENDMAESTRO identifies a new TREND in the bud, this indicator examines the volatility, volumes and momentum to identify the moment in which there is an explosion of one or more of these data and therefore the mome
가격이 역전되고 후퇴함에 따라 시장 구조가 변경됩니다. 시장 구조 반전 경고 표시기는 추세 또는 가격 움직임이 고갈에 가까워지고 반전할 준비가 되었음을 식별합니다. 일반적으로 반전이나 큰 하락이 일어나려고 할 때 발생하는 시장 구조의 변화를 알려줍니다. 지표는 가능한 고갈 지점 근처에서 새로운 고점 또는 저점이 형성될 때마다 초기에 돌파와 가격 모멘텀을 식별합니다. 표시기는 반대쪽에 있는 마지막 촛불에 직사각형을 그립니다. 그런 다음 현재의 단기 추세에서 계속 움직이기 때문에 가격과 함께 직사각형을 따라갈 것입니다. 가격이 사각형 위나 아래로 다시 닫힐 정도로 약해지면 시장 구조에 잠재적인 변화가 일어나고 있음을 나타냅니다. 그런 다음 표시기는 방향의 잠재적인 이동과 추세 또는 주요 하락의 가능한 반전 시작에 대해 경고합니다. 작동 방식을 보려면 아래의 작동 표시기를 참조하십시오! 모든 쌍 및 주요 기간을 모니터링하는 대시보드: https://www.mql5.com/
Trend Line Map Pro MT5
STE S.S.COMPANY
4.67 (9)
트렌드 라인 맵 표시기는 트렌드 스크리너 표시기의 애드온입니다. Trend screener(Trend Line Signals)에 의해 생성된 모든 신호에 대한 스캐너로 작동합니다. Trend Screener Indicator 기반의 Trend Line Scanner입니다. Trend Screener Pro 표시기가 없으면 Trend Line Map Pro가 작동하지 않습니다. It's a Trend Line Scanner based on Trend Screener Indicator. If you don't have Trend Screener Pro Indicator,     the Trend Line Map Pro will not work . MQL5 블로그에 액세스하여 추세선 지도 표시기의 무료 버전을 다운로드할 수 있습니다. Metatrader Tester 제한 없이 구매하기 전에 사용해 보십시오. : 여기를 클릭하세요 1. 쉽게 얻을 수 있는 이점 통화 및
TrendLine PRO MT5
Evgenii Aksenov
4.78 (49)
The Trend Line PRO indicator is an independent trading strategy. It shows the trend change, the entry point to the transaction, as well as automatically calculates three levels of Take Profit and Stop Loss protection Trend Line PRO is perfect for all Meta Trader symbols: currencies, metals, cryptocurrencies, stocks and indices Advantages of Trend Line PRO Never redraws its signals The possibility of using it as an independent strategy It has three automatic levels Take Profit and Stop Loss lev
TPSproTREND PrO MT5
Roman Podpora
5 (5)
TPSpro TRENDPRO  - is a trend indicator that automatically analyzes the market and provides information about the trend and each of its changes, as well as giving signals for entering trades without redrawing! The indicator uses each candle, analyzing them separately. referring to different impulses - up or down impulse. Exact entry points into transactions for currencies, crypto, metals, stocks, indices!  -  Version MT4                  DETAILED DESCRIPTION        /       TRADING SETUPS       
Gartley Hunter Multi
Siarhei Vashchylka
5 (5)
Gartley Hunter Multi - An indicator for searching for harmonic patterns simultaneously on dozens of trading instruments and on all classic timeframes: (m1, m5, m15, m30, H1, H4, D1, Wk, Mn). Manual (Be sure to read before purchasing) | Version for MT4 Advantages 1. Patterns: Gartley, Butterfly, Shark, Crab. Bat, Alternate Bat, Deep Crab, Cypher 2. Simultaneous search for patterns on dozens of trading instruments and on all classic timeframes 3. Search for patterns of all possible sizes. Fr
Blahtech Market Profile MT5
Blahtech Limited
5 (8)
Was: $249  Now: $99   Market Profile defines a number of day types that can help the trader to determine market behaviour. A key feature is the Value Area, representing the range of price action where 70% of trading took place. Understanding the Value Area can give traders valuable insight into market direction and establish the higher odds trade. It is an excellent addition to any system you may be using. Inspired by Jim Dalton’s book “Mind Over Markets”, this indicator is designed to suit the
Black Dragon indicator mt5
Ramil Minniakhmetov
4.82 (56)
추세 감지 표시기는 모든 전략을 보완하며 독립적인 도구로도 사용할 수 있습니다.   장점 사용하기 쉽고 불필요한 정보로 차트에 과부하가 걸리지 않습니다. 모든 전략에 대한 필터로 사용할 수 있습니다. 기본 제공 수준의 동적 지원 및 저항이 있어 이익을 얻고 손절매를 설정하는 데 모두 사용할 수 있습니다. 촛대가 닫힌 후에도 표시기는 색상을 변경하지 않습니다.  주식 시장, 지수, 석유, 금 및 모든 시간대에서 작동합니다. 토스트 알림, 이메일 알림, 푸시 알림 및 소리 알림 기능이 있습니다. 내 다른 개발은 여기에서 찾을 수 있습니다:   https://www.mql5.com/ko/users/mechanic/seller 입력 매개변수 Alert - 켜기/끄기. 알리다; Push Notification - 켜기/끄기. 푸시 알림; Mail - 켜기/끄기 이메일 알림; Fibo 1,2,3,4,5,6,7,11,21,31,41,51,61,71 - 동적 지원 및 저항 수준 설정.
Golden Spikes Detector
Batsirayi L Marango
5 (1)
Golden Spikes Detector This indicator is based on an advanced strategy primarily for trading spikes on Boom and Crash Indices. Complex algorithms were implemented to detect high probability entries only. It alerts on potential Buy and Sell entries. To trade spikes on the Deriv or Binary broker, only take Buy Boom and Sell Cash alerts. It was optimised to be loaded on 5-minute timeframe although multiple timeframe analysis is done in the background. Features ·             Desktop pop up and sound
Matrix Arrow Indicator MT5
Juvenille Emperor Limited
5 (14)
매트릭스 화살표 표시기 MT5 는 외환, 상품, 암호 화폐, 지수, 주식과 같은 모든 기호/도구에 사용할 수 있는 100% 다시 칠하지 않는 다중 기간 표시기를 따르는 고유한 10 in 1 추세입니다.  Matrix Arrow Indicator MT5 는 다음과 같은 최대 10개의 표준 지표에서 정보와 데이터를 수집하여 초기 단계에서 현재 추세를 결정합니다. 평균 방향 이동 지수(ADX) 상품 채널 지수(CCI) 클래식 하이켄 아시 캔들 이동 평균 이동 평균 수렴 발산(MACD) 상대 활력 지수(RVI) 상대 강도 지수(RSI) 포물선 SAR 스토캐스틱 오실레이터 윌리엄스의 백분율 범위 모든 지표가 유효한 매수 또는 매도 신호를 제공하면 강력한 상승/하락 추세를 나타내는 다음 캔들/막대가 시작될 때 해당 화살표가 차트에 인쇄됩니다. 사용자는 사용할 표시기를 선택하고 각 표시기의 매개변수를 개별적으로 조정할 수 있습니다. 매트릭스 화살표 표시기 MT5는 선택한 표시기에서만 정보를 수
Smart Peak Bottom
Xiaoyu Huang
5 (2)
이것은 고점과 저점을 판단하기 위한 명확한 지표이며 진동 시장에 적합합니다. 프로모션 가격 49$ → 59$ 특징 상의와 하의를 잘 판단한다 다시 그리기 없음, 드리프트 없음 빠른 계산, 지연 없음 풍부한 알림 모드 여러 매개 변수 및 색상을 조정할 수 있습니다. 매개변수 "======== 메인 ========" HighLowPeriod1 = 9 HighLowPeriod2 = 60 HighLowPeriod3 = 34 HighLowEMAPeriod = 4 MASignalPeriod = 5 "======== 알림 ========" UseAlertNotify = 참; UseMetaQuotesIDNotify = 참; UseMailNotify = 참; NotifySignalMode = 색상 변경 및 레벨 확인; 하이레벨 = 80; 저수준 = 20; NofityPreMessage = "스마트 피크 바닥"; EA 통화의 경우 0. 높은 버퍼 1.낮은 버퍼 2. 방향 버퍼 1 up
IX Power MT5
Daniel Stein
5 (2)
IX Power는   마침내 FX Power의 탁월한 정밀도를 외환이 아닌 기호에도 적용했습니다. 좋아하는 지수, 주식, 원자재, ETF, 심지어 암호화폐까지 단기, 중기, 장기 추세의 강도를 정확하게 파악할 수 있습니다. 단말기가 제공하는   모든 것을 분석할   수 있습니다. 사용해 보고 트레이딩   타이밍이 크게 향상되는   것을 경험해 보세요. IX Power 주요 특징 단말기에서 사용 가능한 모든 거래 심볼에 대해 100% 정확한 비재도장 계산 결과 제공 사전 구성 및 추가적으로 개별 구성 가능한 강도 분석 기간의 드롭다운 선택 가능 이메일, 메시지, 모바일 알림을 통한 다양한 알림 옵션 제공 EA 요청을 위한 액세스 가능한 버퍼 더 나은 성능을 위한 사용자 지정 가능한 계산 한도 더 많은 것을 보고 싶은 사용자를 위한 특별 다중 인스턴스 설정 모든 차트에서 좋아하는 색상을 위한 무한한 그래픽 설정 가능 Windows 11 및 macOS 스타일의 둥
Account Graph MT5
Kyra Nickaline Watson-gordon
5 (1)
An indicator to draw a graph of account current and historical state such as Balance, Equity, Margin, Free Margin, Margin Level, Drawdown, Account Profit, Deposit and Withdrawals. Indicator Inputs : Draw Balance Graph Draw Equity Graph Draw Margin Graph Draw Free Margin Graph Draw Margin Level Graph Draw Drawdown Graph Draw Account Profit Graph Hide Data on Chart and Buffers Connect Gaps by Lines Sign of DDs on Profit Sign of DDs on Loss Tips : The Indicator will draw historical balance gra
제작자의 제품 더 보기
Triple TRIX
Nicholas C Weber
Three Triple Exponential Average oscillators merged into one. Fast period will pull on the slower period, and the slower will smooth out the faster and avoid early positions. You can use 2 fast and 1 slow, or Fibonacci range or 2 slow, 1 fast. NOW FREE. But please consider supporting me by buying my 2 for sale indicators. You can use this as an entry indicator and exit indicator. Open when the tripleTRIX line crosses the zero line and close when it starts to reverse. When the peaks get bigger,
TVf Channel
Nicholas C Weber
I really like this indicator. But I made it, so of course I would.. NOW FREE. But please consider supporting me by buying my 2 for sale indicators. You can multiply the weight of each indicator used to give more emphasis on it's value when averaging between the 3. Boost fast TEMA and it can move the indicator faster. Boost slow FrAMA and watch it smooth out. I like to use them as open/close lines and set them up so they move quick, but have the FrAMA smooth it out more.  Check out my other ind
Binary Wave Advance
Nicholas C Weber
Update 2.2: Added MFI with predictive mod. Updated all indicators to reflect similar values, to combine multiple ones to rest well on overbought/oversold lines. Update 2.3: Minor bug fixes. Update 2.4: Removed buggy indicators DeMarker, and MACD, as it was too complicated and not as accurate as the rest due to it's nature. Added Awesome Oscillator. removed spreads, as it bogged the indicator down. Added other features, like indicator value compensators to match each other's levels when combine
Update 2.0: Added the option to change LWMA to the other 3 basic MA modes. I also added Smoothing to it, to tame it a bit. You can input 1 as smoothing period and no smoothing will be applied. Update 2.1: Removed Trend Typical Open/Close as is was the same behavior as Trend Open/Close. Trend follow works by averaging the high/low with close/open. If Close is above Open, Trend Close = Close+High/2, averaging between close and high, and when Close drops below Open, it's calculation automatically
This is a Lite version of my Binary Wave Advance Oscillating indicator:  https://www.mql5.com/en/market/product/90734 Free for a limited time! It reduces the less useful indicators, while keeping it's predictive modifications to make each indicator within better than their stock counter part. I reduced it and made it simpler, in the hopes it would be less overwhelming and more approachable. Contains: ADX Chaikin Money Flow Index Each have separate smoothing controls to tame faster periods, as we
Doctor Oscillator
Nicholas C Weber
This is similar in it's idea as the Binary Advance/Lite indicator, but this is intended to use as a levels indicator, as well as trend reversal and how ranging the market is. It takes several useful indicators and combines them in such a way as to declutter your charts, yet prove even more useful together, than separate. RSI, RVI, DeMarker, MACD are added together then multiplied by ATR and StdDev to reveal multiple factors: How far the price has changed, and as the price slows down and reverses
필터:
리뷰 없음
리뷰 답변
버전 1.1 2022.11.05
Version 1.1 fixed the controls menu format.