New Awesome Oscillator Mt5
- 지표
- Nikolay Kositsin
- 버전: 1.1
- 업데이트됨: 19 8월 2022
- 활성화: 5
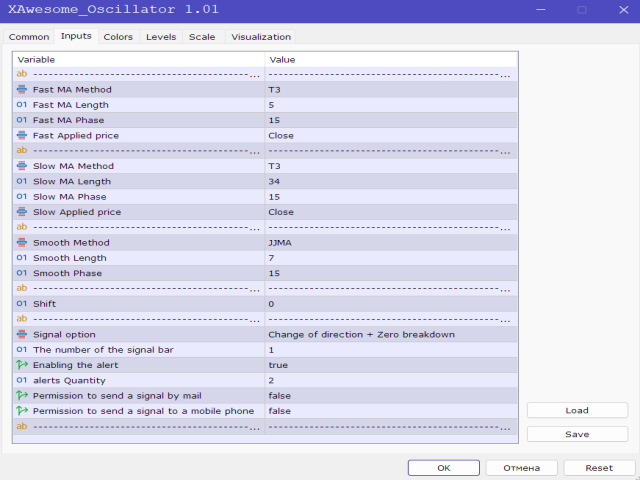
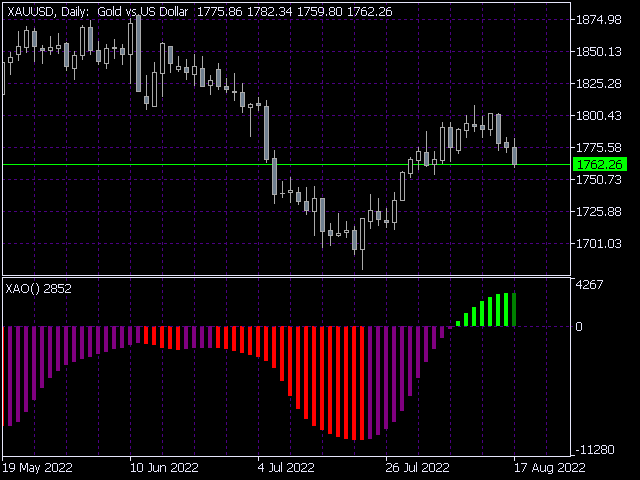
Awesome Oscillator by Bill Williams with the ability to fine-tune and replace the averaging algorithms of the indicator, which significantly expands the possibilities of using this oscillator in algorithmic trading and brings it closer in its properties to such an indicator as the MACD.
To reduce price noise, the final indicator is processed with an additional Smooth averaging.
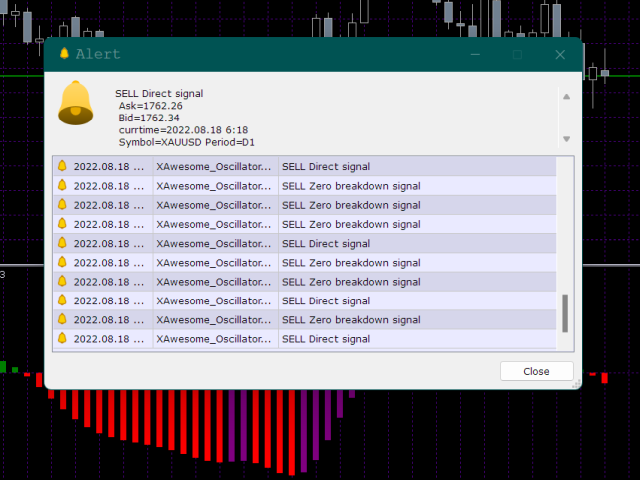
The indicator has the ability to give alerts, send mail messages and push signals when the direction of movement of the oscillator changes and when the oscillator breaks the zero level.