• 미리보기
  • 리뷰 (6)
  • 코멘트 (5)

Double Tops And Bottoms MT5

4.83
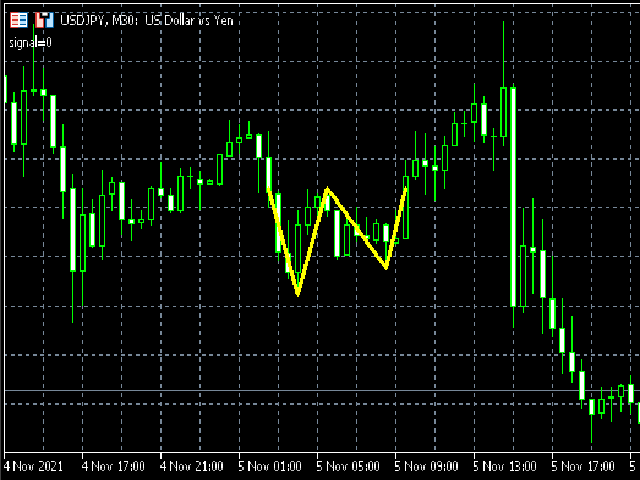
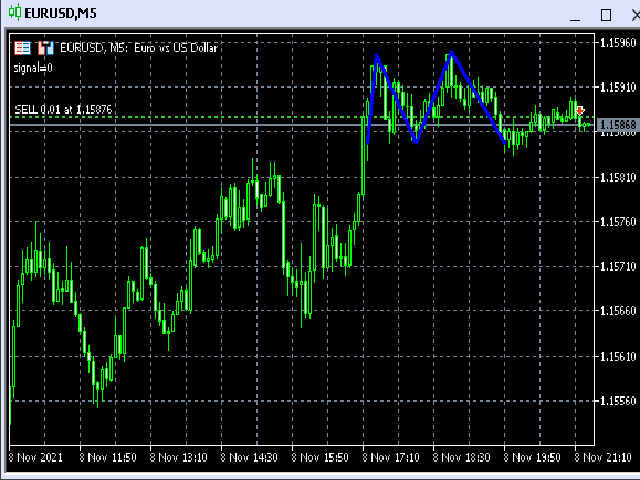
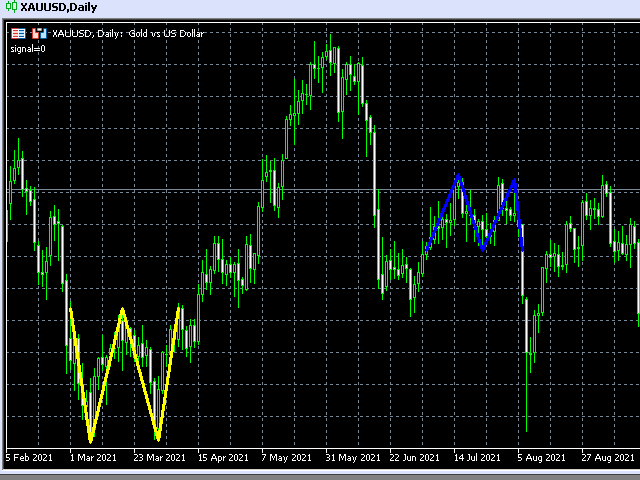
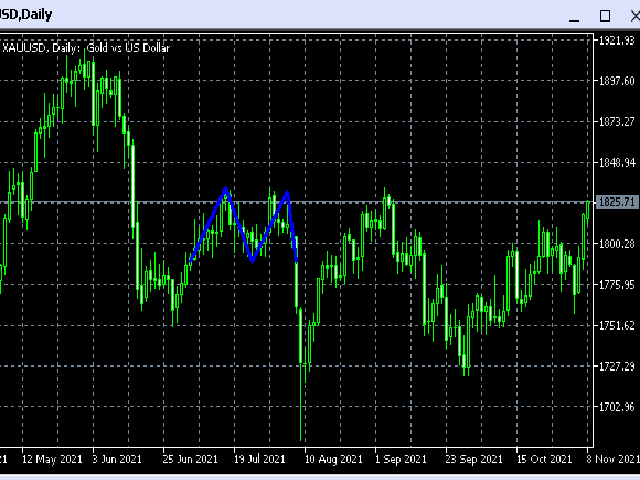
This indicator finds and displays the Double Bottom and Double Top technical analysis patterns. Signals (displays a message on the screen) if the shape was formed recently. Often after the appearance of these patterns, the trend reverses or a correction occurs. In order not to search for them yourself, or not to miss their appearance, it is enough to add an indicator to the chart. The indicator can be used on different timeframes and currency pairs, there are settings for a better search on a certain currency pair (if the indicator does not find a pattern, it may be necessary to change some settings), automatic tuning of parameters. Also, you can change the color of the lines, show all lines, or only formed shapes.

Options

  • History - the number of bars to search for patterns on the chart;
  • ExtremCountBars - The number of bars to search for extremums, for example, highs at the 2nd peak (3-40 is recommended);
  • MinExtremDist - The minimum number of bars between 2 extremums (2-12 is recommended, the higher the value, the larger the size of the found pattern);
  • MaxExtremDist - Maximum number of bars between 2 extremums (10-50 is recommended);
  • MultipleVerticesFilter - Filtering to find "extra" highs or lows (if enabled, there should be only 2 tops or bottoms);
  • PeriodMAforEdgeFiltering - Filtering the edges of double bottom and top shapes by MA so that there is a smooth rise or fall (0 - off, 0-10 is recommended);
  • PriceDeviationsParam - The maximum price deviation (depending on the volatility) of a currency pair of two extremes (the larger this value, the more the figure may turn out to be a curve, but it will be found more often);
  • PriceChangeBeforePattern - How much the value of the price change before the pattern should be less than the size of the pattern itself (recommended from 1 to 2.5);
  • MaxPriceStrengthAfterPattern - A parameter for increasing (and decreasing) the maximum price divergence from the pattern (for example, 1.5 = 1.5 larger than the pattern size);
  • SelfTuningParametersCount - The number of attempts to auto-tuning parameters (how many times the parameter values ​​can be changed to search for at least 1 figure, it is recommended 0-10, 0 - auto-tuning of parameters is disabled);
  • DrawUnfinishedPatterns - Draw unfinished patterns (lines on the chart that show that a pattern could have been formed);
  • EnableAlert - enable alerts when a pattern appears and breaks out;
  • AlertPeriodBars - The number of bars after which the alert can appear again;
  • MaximumFigureShiftForAlert - Maximum distance of the figure from the current bar for the alert to appear;
  • NeutralLinesClr - Color of neutral lines (shown when the DrawUnfinishedPatterns parameter is enabled);
  • FinalBuyPatternClr - Line color of the completed buy shape;
  • FinalSellPatternClr - Line color of the completed sell shape.
리뷰 6
docjames777
25
docjames777 2024.04.09 15:51 
 

very good indicator

Gloria Sarpong
712
Gloria Sarpong 2024.04.08 15:21 
 

good one

gnanos123
535
gnanos123 2024.02.08 21:14 
 

OK Indicator

추천 제품
RSI with alerts BDA
Laron Demetris Burrows
4.25 (16)
이 알고리즘은 86%*정확도로 단기간의 가격 변화를 예측합니다. 과매수 또는 과매도 상태인 경우,이 표시기가 사용자에게 알립니다. 가격이 신호 촛불보다 높거나 낮은 경우 예측한다. 더 큰 시간 프레임에 평균 복귀 거래,바이너리 옵션 또는 선물 계약에 적합합니다. 이 지표는 5 년간의 데이터에 대해 백 테스트되었으며 시간 경과에 따른 가격 반전을 예측하는 데 90%의 정확도가 있습니다. 특징:: 간단한 설정 모든 차트로 드래그 앤 드롭 원하는대로 매개 변수 조정(선택 사항) 경고 사용(선택 사항) 그리고 당신은 완료! 시각 및 오디오 경고 휴대 전화로 직접 전송 경고 터미널로 전송 된 팝업 알림 높은 승률 거래의 90%까지 승리 백 테스트 5 년 여러 통화. (백 테스트 세부 정보 및 분석은 웹 사이트를 참조하십시오). 많은 수의 신호 기대 1 에 2 기호 당 하루 신호*. 당신이 표시가있는 경우*이입니다 30 분 촛불. 유연한 외환,지수,상품 및 주식에서 작동합니다. 어떤
FREE
Free automatic Fibonacci is an indicator that automatically plots a Fibonacci retracement based on the number of bars you select on the BarsToScan setting in the indicator. The Fibonacci is automatically updated in real time as new highest and lowest values appears amongst the selected bars. You can select which level values to be displayed in the indicator settings. You can also select the color of the levels thus enabling the trader to be able to attach the indicator several times with differe
FREE
Trend Catcher with Alert MT5
Issam Kassas
4.64 (58)
트렌드 캐쳐: 알림 인디케이터와 함께 하는 트렌드 캐쳐 전략은 시장 트렌드와 잠재적인 진입 및 체크 포인트를 식별하는 데 도움이 되는 다목적 기술 분석 도구입니다. 이는 시장 상황에 적응하여 트렌드 방향을 명확하게 시각적으로 표현하는 동적 트렌드 캐쳐 전략을 제공합니다. 트레이더는 선호도와 위험 허용도에 맞게 매개변수를 사용자 정의할 수 있습니다. 이 인디케이터는 트렌드 식별을 지원하고 잠재적인 반전을 신호로 제공하며 트레일링 스탑 메커니즘으로 작동하며 실시간 경고를 제공하여 신속한 시장 대응을 돕습니다. 특징: - 트렌드 식별: 상승 트렌드와 하락 트렌드를 신호합니다. - 트렌드 반전: 양봉 색상이 상승에서 하락으로 변경되거나 그 반대의 경우 잠재적인 반전을 경고합니다. - 실시간 경고: 새로운 트렌드 식별을 위한 경고를 생성합니다. 추천사항: - 통화 및 페어: EURUSD, AUDUSD, XAUUSD 등... - 시간 프레임: H1. - 계정 유형: 모든 E
FREE
This indicator is an automated version of the Fibonacci retracement (Fib) indicator. Deciding the best areas to use when drawing the fib can be tricky and this  indicator was made with that in mind. When you drop it on the chart it will automatically choose the best points to draw the fib with, but in case you aren't satisfied with those regions, you can adjust it as you wish.
FREE
Follow The Line MT5
Oliver Gideon Amofa Appiah
4.4 (30)
This indicator obeys the popular maxim that: "THE TREND IS YOUR FRIEND" It paints a GREEN line for BUY and also paints a RED line for SELL. (you can change the colors). It gives alarms and alerts of all kinds. IT DOES NOT REPAINT and can be used for all currency pairs and timeframes. Yes, as easy and simple as that. Even a newbie can use it to make great and reliable trades. NB: For best results, get my other premium indicators for more powerful and reliable signals. Get them here: https://www.m
FREE
Reversal Composite Candles
MetaQuotes Ltd.
3.43 (23)
The idea of the system is to indentify the reversal patterns using the calculation of the composite candle. The reversal patterns is similar to the "Hammer" and "Hanging Man" patterns in Japanese candlestick analysis. But it uses the composite candle instead the single candle and doesn't need the small body of the composite candle to confirm the reversal. Input parameters: Range - maximal number of bars, used in the calculation of the composite candle. Minimum - minimal size of the composite can
FREE
What is this indicator? This indicator is the MACD (Moving Average Convergence/Divergence) supporting Virtual Trading mode of  Knots Compositor . When the mode is turned on, the indicator will be recalculated based on the displayed candlesticks. When the mode is turned off, the indicator will be recalculated based on the original chart candlesticks. Types of the applied price - Close - Open - High - Low - Median Price (HL/2) - Typical Price (HLC/3) - Weighted Price (HLCC/4) KC-Indicators
FREE
Mitimom
Danil Poletavkin
The indicator is based on Robert Miner's methodology described in his book "High probability trading strategies" and displays signals along with momentum of 2 timeframes. A Stochastic oscillator is used as a momentum indicator. The settings speak for themselves period_1 is the current timeframe, 'current' period_2 is indicated - the senior timeframe is 4 or 5 times larger than the current one. For example, if the current one is 5 minutes, then the older one will be 20 minutes The rest of the
FREE
RenkoExpert
Andrey Goida
3.67 (3)
Renko Expert Advisor based on Renko bar simulation.    The EA has two options for building Renko bars. Classic and ATR. In the classic version, renko bars are marked with areas on the main chart; in the ATR version, renko bars are modeled and drawn in the indicator window. Modeling renko bars inside the EA allows you to optimize the robot better than drawing renko bars offline.      Telegramm channel   Set file Our second robot RENKOTREND Does not use martingale!  Trades opened by the robot co
FREE
PZ Three Drives MT5
PZ TRADING SLU
3.11 (9)
This indicator finds Three Drives patterns. The Three Drives pattern is a 6-point reversal pattern characterised by a series of higher highs or lower lows that complete at a 127% or 161.8% Fibonacci extension. It signals that the market is exhausted and a reversal can happen. [ Installation Guide | Update Guide | Troubleshooting | FAQ | All Products ] Customizable pattern sizes Customizable colors and sizes Customizable breakout periods Customizable 1-2-3 and 0-A-B ratios It implements visua
FREE
This is a demo version of the Candle Absorption Full indicator. It has limitations on operation. This indicator detects the Engulfing candlestick pattern and draws the corresponding market entry signal. Features It works only with EURUSD on timeframes M1 and M5. The indicator analyzes a combination of 2 or 3 candlesticks depending on settings. The number of pre-calculated bars (signals) is configurable. The indicator can send an alert to notify of a found signal. Signal can be filtered by sett
FREE
Easy GOLD MT5
Franck Martin
5 (8)
Easy Gold is the latest addition to the BotGPT family. It is surprising and very powerful. It is ideal for beginners due to its simplicity.  There is absolutely nothing to do, it's 100% automated, simply indicate the percentage of risk you want to take per trade and the EA is ready. Whatever your capital, the EA takes care of everything. Optimized on (XAUUSD).  Unleash all the power with the professional version (AGI Gold) and its connection to the neural network, available in my store. My othe
FREE
A professional tool for trading - the divergence indicator between the WPR and the price, which allows you to receive a signal about a trend reversal in a timely manner or catch price pullback movements (depending on the settings). The indicator settings allow you to adjust the strength of the divergence due to the angle of the WPR peaks and the percentage change in price, which makes it possible to fine-tune the signal strength. The indicator code is optimized and is tested very quickly as par
FREE
Forex Indicator Arrows
NGUYEN NGHIEM DUY
1 (1)
Forex Indicator Arrows is an arrow Indicator used as an assistant tool for your trading strategy. The indicator analyzes the standard deviation of bar close for a given period and generates a buy or sell signals if the deviation increases. It good to combo with Martingale EA to follow Trend and Sellect Buy Only/Sell Only for EA work Semi-Automatic. You can use this  Indicator with any EAs in my Products.
FREE
PZ The Zone MT5
PZ TRADING SLU
5 (1)
This indicator displays buy or sell signals according to Bill Williams' definition of the Trading Zone. [ Installation Guide | Update Guide | Troubleshooting | FAQ | All Products ] Easy to use and understand Avoid trading flat markets Deterministic indicator with clear rules The indicator is non-repainting It implements alerts of all kinds It has straightforward trading implications. A blue arrow is a buy signal A red arrow is a sell signal According to Bill Williams trading in the zone helps t
FREE
Trendline mt5 indicator
David Muriithi
3 (1)
Are you tired of drawing trendlines every time you're analyzing charts? Or perhaps you would like more consistency in your technical analysis. Then this is for you. This indicator will draw trend lines automatically when dropped on a chart. How it works Works similar to standard deviation channel found on mt4 and mt5. It has 2 parameters: 1. Starting Bar 2. Number of bars for calculation The   starting bar   is the bar which drawing of the trend lines will begin, while the   number of bars for c
FREE
The indicator identifies when a divergence occurs between price and an indicator or oscillator. It identifies both regular and hidden divergences. Combined with your own rules and techniques, this indicator will allow you to create (or enhance) your own powerful system. Features Can detect divergences for the following oscillators/indicators:   MACD, OsMA, Stochastics, RSI, CCI, RVI, Awesome, ADX, ATR, OBV, Composite index, MFI and Momentum. Only one oscillator/indicator can be selected. Draws
FREE
Important Lines
Terence Gronowski
4.88 (26)
This indicator displays Pivot-Lines, preday high and low, preday close and the minimum and maximum of the previous hour. You just have to put this single indicator to the chart to have all these important lines, no need to setup many single indicators. Why certain lines are important Preday high and low : These are watched by traders who trade in a daily chart. Very often, if price climbs over or falls under a preday low/high there is an acceleration in buying/selling. It is a breakout out of
FREE
Basic Harmonic Pattern MT5
Mehran Sepah Mansoor
4.77 (43)
이 지표는 시장 반전 시점을 예측하는 가장 인기 있는 하모닉 패턴을 식별합니다. 이러한 하모닉 패턴은 외환 시장에서 지속적으로 반복되는 가격 형성이며 향후 가능한 가격 움직임을 제안합니다 /   무료 MT4 버전 또한 이 보조지표에는 시장 진입 신호와 다양한 이익실현 및 손절매 신호가 내장되어 있습니다. 하모닉 패턴 지표는 자체적으로 매수/매도 신호를 제공할 수 있지만 다른 기술 지표를 사용하여 이러한 신호를 확인하는 것이 좋습니다. 예를 들어, 매수/매도하기 전에 추세의 방향과 모멘텀의 강도를 확인하기 위해 RSI 또는 MACD와 같은 오실레이터를 사용하는 것을 고려할 수 있습니다. 이 인디케이터의 대시보드 스캐너: ( Basic Harmonic Patterns Dashboard ) 포함된 하모닉 패턴 가틀리 버터플라이 박쥐 게 Shark Cypher ABCD 주요 입력 Max allowed deviation (%):   이 매개변수는 하모닉 패턴의 형성에
FREE
Automatic Trendlines
Pasi Hakamaki
4.63 (48)
The indicator draws trendlines on chart. This indicator has six inputs. User can specify alternative labels for both lines. If multiple instances of the indicator are used, the labels must differ. User can set width and color of the lines and depth which specifies what significant peaks should be used. For example, Depth=10 sets trendlines using the current peaks and valleys that have at least 10 bars to the right and to the left and that have highs/lows less/greater than the peak's high/low. In
FREE
DALA Forecast
Grigorii Matsnev
About the indicator: DALA Forecast is a universal tool for predicting the dynamics of time series of any nature. For prediction, modified methods of nonlinear dynamics analysis are used, on the basis of which a predictive model is built using machine learning methods.  To get the trial version of the indicator, you can contact me in private messages. How to use the indicator: Apply the indicator to your chosen financial instrument or indicator with the settings you need. The prediction will b
FREE
Curver Arrows
Francis Dube
4 (9)
This indicator is a straight port of a well known MetaTrader 4 indicator that is freely available on the Internet. It does not redraw at all. It implements a type of breakout strategy. The arrows indicate market direction. Use the indicator on M15 charts and higher. The indicator draws two bands near price action and generates signals when the price closes below the lower band and also above the upper band. The indicator uses periodic highs and lows to calculate upper and lower threshold bands.
FREE
PZ Penta O MT5
PZ TRADING SLU
4 (6)
The Penta-O is a 6-point retracement harmonacci pattern which usually precedes big market movements. Penta-O patterns can expand and repaint quite a bit. To make things easier this indicator implements a twist: it waits for a donchian breakout in the right direction before signaling the trade. The end result is an otherwise repainting indicator with a very reliable trading signal. The donchian breakout period is entered as an input. [ Installation Guide | Update Guide | Troubleshooting | FAQ | A
FREE
Renko Box
Andrey Dik
Description. The basis for the formation of the Renko chart is the price range. If the price goes beyond its limits, the chart shows a box above or below the previous one. As a result, we see price movement without additional "noise" and important support and resistance levels. Features. For use in conjunction with the Expert Advisor, an additional buffer is implemented-a box counter. For convenience and to increase the speed of testing, the user can use the "new box" event, which the indicato
FREE
This indicator is a zero-lag indicator and displays  strength of trend change . True Trend  Oscillator Pro works best in combination with True Trend Moving Average Pro that displays exact trend as is. Oscillator value is exact price change in given direction of the trend. True Trend Moving Average Pro: https://www.mql5.com/en/market/product/103586 If you set PERIOD input parameter to 1 this indicator becomes a sharpshooter for binary options. Developers can use True Trend Oscillator in E
FREE
This indicator is based on the Parabolic SAR indicator. It helps the user identifying whether to buy or sell. It comes with an alert that will sound whenever a new signal appears. It also features an email facility. Your email address and SMTP Server settings should be specified in the settings window of the "Mailbox" tab in your MetaTrader 5. Blue arrow up = Buy. Red arrow down = Sell. Line = Trailing Stop. You can use one of my Trailing Stop products that automatically move the Stop Loss and i
FREE
High Low Open Close
Alexandre Borela
4.97 (35)
이 프로젝트를 좋아한다면 5 스타 리뷰를 남겨주세요. 인스 타 그램: borelatech 이 지표는 열리고, 높은, 낮은 및 마감 가격을 지정합니다. 기간과 그것은 특정한 시간대를 위해 조정될 수 있습니다. 이들은 많은 기관 및 전문가에 의해 보는 중요한 수준입니다 상인은 당신이 더 많은 것일 수있는 장소를 알고 도움이 될 수 있습니다 이름 * 사용 가능한 기간: 이전 날. 이전 주. 지난 달. 이전 분기. 이전 연도. 또는: 현재 날. 현재 주. 현재 달. 현재 분기. 현재 년.
FREE
PZ Fibonacci MT5
PZ TRADING SLU
4.63 (16)
Are you tired of plotting Fibonacci retracements or extensions manually? This indicator displays Fibo retracements or extensions automatically, calculated from two different price points, without human intervention or manual object anchoring. [ Installation Guide | Update Guide | Troubleshooting | FAQ | All Products ] Easy to use Manual anchoring is not needed Perfect for price confluence studies The indicator evaluates if retracements or extensions are needed Once drawn, you can manually edit t
FREE
This indicator is designed to detect high probability reversal patterns: Double Tops/Bottoms with fake breakouts . This is the FREE version of the indicator: https://www.mql5.com/en/market/product/29957 The free version works only on EURUSD and GBPUSD! Double top and bottom patterns are chart patterns that occur when the trading instrument moves in a similar pattern to the letter "W" (double bottom) or "M" (double top). The patterns usually occur at the end of a trend and are used to signal tren
FREE
PZ Binary Options MT5
PZ TRADING SLU
4.31 (13)
This indicator analyzes price action patterns and helps you to make positive equity decisions in the binary options market. [ Installation Guide | Update Guide | Troubleshooting | FAQ | All Products ] Easy to trade Trade both call and put options No crystal ball and no predictions The indicator is non-repainting The only strategy suitable for binary options is applying a mathematical approach, like professional gamblers do. It is based on the following principles: Every binary option represents
FREE
이 제품의 구매자들이 또한 구매함
Atomic Analyst MT5
Issam Kassas
3.64 (11)
우선적으로 언급할 점은이 거래 지표가 다시 그리지 않고 지연되지 않으며 이를 통해 수동 및 로봇 거래 모두에 이상적이라는 점입니다. Atomic Analyst는 가격의 강도와 모멘텀을 활용하여 시장에서 더 나은 이점을 찾는 PA Price Action Indicator입니다. 고급 필터를 장착하여 잡음과 거짓 신호를 제거하고 거래 잠재력을 높이는 데 도움이 됩니다. 복잡한 지표의 다중 레이어를 사용하여 Atomic Analyst는 차트를 스캔하고 복잡한 수학적 계산을 간단한 신호와 색상으로 변환하여 초보 트레이더가 이해하고 일관된 거래 결정을 내릴 수 있도록합니다. "Atomic Analyst"는 새로운 및 경험이 풍부한 트레이더를위한 종합적인 거래 솔루션입니다. 프리미엄 지표와 최고 수준의 기능을 하나의 거래 전략에 결합하여 모든 종류의 트레이더에 대한 다재다능한 선택지가되었습니다. 인트라데이 거래 및 스캘핑 전략 : 빠르고 정확한 일일 거래 및 단기 거래를 위해 설계
우선 이 거래 시스템이 리페인팅, 리드로잉 및 레이그 인디케이터가 아니라는 점을 강조하는 것이 중요합니다. 이는 수동 및 로봇 거래 모두에 이상적인 것으로 만듭니다. "스마트 트렌드 트레이딩 시스템 MT5"은 새로운 및 경험이 풍부한 트레이더를 위해 맞춤형으로 제작된 종합적인 거래 솔루션입니다. 10개 이상의 프리미엄 인디케이터를 결합하고 7개 이상의 견고한 거래 전략을 특징으로 하여 다양한 시장 조건에 대한 다목적 선택이 가능합니다. 트렌드 추종 전략: 효과적인 트렌드 추이를 타기 위한 정확한 진입 및 손절 관리를 제공합니다. 반전 전략: 잠재적인 트렌드 반전을 식별하여 트레이더가 범위 시장을 활용할 수 있게 합니다. 스캘핑 전략: 빠르고 정확한 데이 트레이딩 및 단기 거래를 위해 설계되었습니다. 안정성: 모든 인디케이터가 리페인팅, 리드로잉 및 레이그가 아니므로 신뢰할 수 있는 신호를 보장합니다. 맞춤화: 개별 거래 선호도를 고려한 맞춤형 전략을 지원합니다. 최상의 전략을 찾는
Quantum Trend Sniper
Bogdan Ion Puscasu
5 (37)
소개       Quantum Trend Sniper Indicator는   추세 반전을 식별하고 거래하는 방식을 변화시키는 획기적인 MQL5 지표입니다! 13년 이상의 거래 경험을 가진 숙련된 트레이더 팀이 개발한       Quantum Trend Sniper 표시기       매우 높은 정확도로 추세 반전을 식별하는 혁신적인 방법으로 거래 여정을 새로운 차원으로 끌어올리도록 설계되었습니다. ***Quantum Trend Sniper Indicator를 구입하면 Quantum Breakout Indicator를 무료로 받을 수 있습니다!*** Quantum Trend Sniper Indicator는 추세 반전을 식별하고 세 가지 이익실현 수준을 제안할 때 경고, 신호 화살표를 제공합니다. 초보자 거래자와 전문 거래자 모두에게 적합합니다. Quantum EA 채널:       여기를 클릭하세요 MT4 버전:       여기를 클릭하세요
Trend Screener Pro MT5
STE S.S.COMPANY
4.89 (61)
트렌드 표시기, 트렌드 트레이딩 및 필터링을 위한 획기적인 고유 솔루션, 하나의 도구 안에 내장된 모든 중요한 트렌드 기능! Forex, 상품, 암호 화폐, 지수 및 주식과 같은 모든 기호/도구에 사용할 수 있는 100% 다시 칠하지 않는 다중 시간 프레임 및 다중 통화 표시기입니다. Trend Screener는 차트에 점이 있는 화살표 추세 신호를 제공하는 효율적인 지표 추세 추종 지표입니다. 추세 분석기 표시기에서 사용할 수 있는 기능: 1. 트렌드 스캐너. 2. 최대 이익 분석이 있는 추세선. 3. 추세 통화 강도 측정기. 4. 경고가 있는 추세 반전 점. 5. 경고가 있는 강력한 추세 점. 6. 추세 화살표 Trend Screener Indicator가 있는 일일 분석 예, 일일 신호 성능...등은 여기에서 찾을 수 있습니다. 여기를 클릭하십시오. LIMITED TIME OFFER : Trend Screener Indicator는 50$ 및 평생 동안만 사용할 수 있습니다
Gold Stuff mt5
Vasiliy Strukov
4.88 (163)
Gold Stuff mt5는 금을 위해 특별히 설계된 추세 지표이며 모든 금융 상품에서도 사용할 수 있습니다. 표시기가 다시 그려지지 않고 지연되지 않습니다. 권장 기간 H1. 설정 및 개인 보너스를 받으려면 구매 후 즉시 저에게 연락하십시오!   설정 화살표 그리기 - 켜기 끄기. 차트에 화살표 그리기. 경고 - 가청 경고를 끕니다. 이메일 알림 - 켜기 끄기. 이메일 알림. Puch-notification - 켜기 끄기. 푸시 알림. 다음으로 색 영역을 조정합니다. Gold Stuff mt5는 금을 위해 특별히 설계된 추세 지표이며 모든 금융 상품에서도 사용할 수 있습니다. 표시기가 다시 그려지지 않고 지연되지 않습니다. 권장 기간 H1. 설정 및 개인 보너스를 받으려면 구매 후 즉시 저에게 연락하십시오!   설정 화살표 그리기 - 켜기 끄기. 차트에 화살표 그리기. 경고 - 가청 경고를 끕니다. 이메일 알림 - 켜기 끄기. 이메일 알림. Puch-noti
FX Volume MT5
Daniel Stein
4.94 (17)
모닝 브리핑을 통해 세부 정보와 스크린샷으로 매일 시장 업데이트를 받으세요 여기 mql5 및 텔레그램에서 FX 거래량은 브로커의 관점에서 시장 심리에 대한 실제 통찰력을 제공하는 최초이자 유일한 거래량 지표입니다. 브로커와 같은 기관 시장 참여자가 외환 시장에서 어떤 포지션을 취하고 있는지에 대한 훌륭한 통찰력을 COT 보고서보다 훨씬 빠르게 제공합니다. 차트에서 이 정보를 직접 확인하는 것은 트레이딩의 진정한 판도를 바꾸고 획기적인 솔루션입니다. 다음과 같은 고유한 시장 데이터 인사이트의 이점 비율 는 통화의 매수/매도 포지션 비율을 백분율로 표시 비율 변화 는 선택한 기간 내 매수 비율과 비율 변화를 표시 총 거래량 는 해당 통화의 총 거래량(롱 및 숏)을 로트 단위로 보여줍니다 Volumes Long 는 해당 통화의 모든 롱 포지션의 거래량을 보여줍니다 Volumes Short 는 해당 통화의 모든 숏 포지션의 거래량을 보여줍니다 Net Long 는 순 롱 포지션의 거래량
RelicusRoad Pro MT5
Relicus LLC
4.81 (21)
이제 $ 147 (몇 가지 업데이트 후 $ 499 증가) - 무제한 계정 (PCS 또는 MACS) RelicusRoad 사용 설명서 + 교육 비디오 + 비공개 Discord 그룹 액세스 + VIP 상태 시장을 보는 새로운 방법 RelicusRoad는 외환, 선물, 암호화폐, 주식 및 지수에 대한 세계에서 가장 강력한 거래 지표로서 거래자에게 수익성을 유지하는 데 필요한 모든 정보와 도구를 제공합니다. 우리는 초보자부터 고급까지 모든 거래자가 성공할 수 있도록 기술적 분석 및 거래 계획을 제공합니다. 미래 시장을 예측할 수 있는 충분한 정보를 제공하는 핵심 거래 지표입니다. 우리는 차트에서 말이 안 되는 여러 지표 대신 완전한 솔루션을 믿습니다. 타의 추종을 불허하는 매우 정확한 신호, 화살표 + 가격 조치 정보를 표시하는 올인원 표시기입니다. 강력한 AI를 기반으로 하는 RelicusRoad는 누락된 정보와 도구를 제공하여 교육하고 성공적인 트레이더인 트레이딩 전문
FX Power MT5 NG
Daniel Stein
5 (4)
모닝 브리핑 여기 mql5 와 텔레그램에서 FX Power MT5 NG 는 오랫동안 인기 있는 통화 강도 측정기인 FX Power의 차세대 버전입니다. 이 차세대 강도 측정기는 무엇을 제공합니까? 기존 FX Power에서 좋아했던 모든 것 PLUS GOLD/XAU 강도 분석 더욱 정밀한 계산 결과 개별 구성 가능한 분석 기간 더 나은 성능을 위한 사용자 정의 가능한 계산 한도 특별 멀티더 많은 것을보고 싶은 사람들을위한 특별한 다중 인스턴스 설정 모든 차트에서 좋아하는 색상을위한 끝없는 그래픽 설정 수많은 알림 옵션, 중요한 것을 다시는 놓치지 않도록 Windows 11 및 macOS 스타일의 둥근 모서리가 있는 새로운 디자인 마법처럼 움직이는 인디케이터 패널 FX 파워 키 특징 모든 주요 통화의 완전한 강세 이력 모든 시간대에 걸친 통화 강세 이력 모든 브로커 및 차트에서 고유 계산 결과 100% 신뢰할 수있는 실시간100 % 신뢰할 수있는 실시간 계산-> 다시 칠하지 않음
Advanced Supply Demand MT5
Bernhard Schweigert
4.53 (15)
현재 33% 할인! 초보자나 전문 트레이더를 위한 최고의 솔루션! 이 보조지표는 우리가 다수의 독창적 기능과 새로운 공식을 통합한 독특하고 고품질이며 저렴한 거래 도구입니다. 이 업데이트를 통해 이중 시간대를 표시할 수 있습니다. 더 높은 TF를 표시할 수 있을 뿐만 아니라 차트 TF와 더 높은 TF 모두를 표시할 수 있습니다: 중첩 영역 표시. 모든 Supply Demand 트레이더들이 좋아할 것입니다. :) 중요한 정보 공개 Advanced Supply Demand의 잠재력을 극대화하려면 다음을 방문하십시오. https://www.mql5.com/ko/blogs/post/720245   진입 또는 목표의 명확한 트리거 포인트를 정확히 찾아냄으로 해서 거래가 어떻게 개선될지 상상해 보십시오. 새로운 알고리즘을 기반으로 매수자와 매도자 간의 잠재적인 불균형을 훨씬 더 쉽게 분간할 수 있습니다. 왜냐하면 가장 강한 공급영역과 가장 강한 수요 영역과 과거에 어떻게 진행 되었는지를(이
우선적으로, 이 거래 도구는 전문적인 거래에 이상적인 비-다시 그리기 및 지연되지 않는 지표입니다.  스마트 가격 액션 컨셉트 인디케이터는 신규 및 경험 많은 트레이더 모두에게 매우 강력한 도구입니다. Inner Circle Trader Analysis 및 Smart Money Concepts Trading Strategies와 같은 고급 거래 아이디어를 결합하여 20가지 이상의 유용한 지표를 하나로 결합합니다. 이 인디케이터는 스마트 머니 컨셉트에 중점을 두어 대형 기관의 거래 방식을 제공하고 이동을 예측하는 데 도움을 줍니다.  특히 유동성 분석에 뛰어나 기관이 어떻게 거래하는지 이해하는 데 도움을 줍니다. 시장 트렌드를 예측하고 가격 변동을 신중하게 분석하는 데 탁월합니다. 귀하의 거래를 기관 전략에 맞추어 시장의 동향에 대해 더 정확한 예측을 할 수 있습니다. 이 인디케이터는 시장 구조를 분석하고 중요한 주문 블록을 식별하고 다양한 패턴을 인식하는 데 뛰어납니다. 
XQ Indicator MetaTrader 5
Marzena Maria Szmit
5 (1)
Step into the realm of Forex trading with confidence and precision using XQ, a cutting-edge Forex indicator designed to elevate your trading game to unprecedented heights. Whether you're a seasoned trader or just stepping into the world of currency exchange, XQ Forex Indicator empowers you with the insights and signals needed to make informed trading decisions. The signal conditions are a combination of three indicators, and XQ Forex Indicator only display  medium and long-term trends . The ind
Volume by Price MT5
Brian Collard
5 (3)
The Volume by Price Indicator for MetaTrader 5 features Volume Profile and Market Profile TPO (Time Price Opportunity). Get valuable insights out of currencies, equities and commodities data. Gain an edge trading financial markets. Volume and TPO histogram bar and line charts. Volume Footprint charts. TPO letter and block marker charts including split structures. Versatile segmentation and compositing methods. Static, dynamic and flexible ranges with relative and/or absolute visualizations. Lay
소개       Quantum Breakout PRO   , 브레이크아웃 존 거래 방식을 변화시키는 획기적인 MQL5 지표! 13년 이상의 거래 경험을 가진 숙련된 트레이더 팀이 개발한       퀀텀 브레이크아웃 PRO       혁신적이고 역동적인 브레이크아웃 존 전략으로 거래 여정을 새로운 차원으로 끌어올리도록 설계되었습니다. Quantum Breakout Indicator는 5개의 이익 목표 영역이 있는 브레이크아웃 영역의 신호 화살표와 브레이크아웃 상자를 기반으로 한 손절 제안을 제공합니다. 초보자 거래자와 전문 거래자 모두에게 적합합니다. Quantum EA 채널:       여기를 클릭하세요 중요한! 구매 후 설치 매뉴얼을 받으려면 개인 메시지를 보내주십시오. 추천: 기간: M15 통화쌍: GBPJPY, EURJPY, USDJPY,NZDUSD, XAUUSD 계정 유형: 스프레드가 매우 낮은 ECN, Raw 또는 Razor 브로커 시간: GM
ICT, SMC, SMART MONEY CONCEPTS, SMART MONEY, Smart Money Concept, Support and Resistance, Trend Analysis, Price Action, Market Structure, Order Blocks, BOS/CHoCH,   Breaker Blocks ,  Momentum Shift,   Supply&Demand Zone/Order Blocks , Strong Imbalance,   HH/LL/HL/LH,    Fair Value Gap, FVG,  Premium  &   Discount   Zones, Fibonacci Retracement, OTE, Buy Side Liquidity, Sell Side Liquidity, BSL/SSL Taken, Equal Highs & Lows, MTF Dashboard, Multiple Time Frame, BigBar, HTF OB, HTF Market Structure
Entry Points Pro for MT5
Yury Orlov
4.54 (157)
다시 색을 칠하지 않고 거래에 진입할 수 있는 정확한 신호를 제공하는 MT5용 지표입니다. 외환, 암호화폐, 금속, 주식, 지수 등 모든 금융 자산에 적용할 수 있습니다. 매우 정확한 추정값을 제공하고 매수와 매도의 가장 좋은 시점을 알려줍니다. 하나의 시그널로 수익을 내는 지표의 예와 함께 비디오 (6:22)시청하십시오! 대부분의 거래자는 Entry Points Pro 지표의 도움으로 첫 거래 주 동안 트레이딩 결과를 개선합니다. 저희의   Telegram Group 을 구독하세요! Entry Points Pro 지표의 좋은점. 재도색이 없는 진입 신호 신호가 나타나고 확인되면(시그널 캔들이 완성된 경우) 신호는 더 이상 사라지지 않습니다. 여타 보조지표의 경우 신호를 표시한 다음 제거되기 때문에 큰 재정적 손실로 이어집니다. 오류 없는 거래 게시 알고리즘을 통해 트레이드(진입 또는 청산)를 할 이상적인 순간을 찾을 수 있으며, 이를 통해 이를 사용하는 모든 거래자의
AW Trend Predictor MT5
AW Trading Software Limited
4.76 (54)
하나의 시스템에서 추세와 고장 수준의 조합입니다. 고급 지표 알고리즘은 시장 노이즈를 필터링하고 추세, 진입점 및 가능한 출구 수준을 결정합니다. 표시기 신호는 통계 모듈에 기록되어 가장 적합한 도구를 선택하여 신호 기록의 효율성을 보여줍니다. 이 표시기는 이익 실현 및 손절매 표시를 계산합니다. 매뉴얼 및 지침 ->   HERE   / MT4 버전 ->   HERE 지표로 거래하는 방법: Trend Predictor로 거래하는 것은 3단계로 간단합니다. 1단계 - 포지션 열기 70% 이상의 성공률로 매수 신호를 받았습니다. 2단계 - StopLoss 결정 반대 신호로 트렁크 선택 3단계 - 이익 실현 전략 정의 전략 1: TP1 도달 시 전체 포지션 청산 전략 2: TP1 도달 시 포지션의 50% 청산 및 TP2 도달 시 나머지 50% 청산 전략 3: 추세 반전 시 전체 포지션 청산 이익: 결과를 다시 그리지 않음, 신호는 엄격하게 양초가 닫힐 때 어드바이저에서 사용할 수 있습니
Auto Order Block with break of structure based on ICT and Smart Money Concepts Futures Break of Structure ( BoS )             Order block ( OB )            Higher time frame Order block / Point of Interest ( POI )    shown on current chart           Fair value Gap ( FVG ) / Imbalance   ,  MTF      ( Multi Time Frame )    Volume Imbalance     ,  MTF          vIMB Gap’s Equal High / Low’s     ,  MTF             EQH / EQL Liquidity               Current Day High / Low           HOD /
ON Trade Gann Squares MT5
Abdullah Alrai
5 (1)
간 스퀘어 지표는 W.D. 간이 쓴 "시장 예측을 위한 수학적 공식" 기사에 기반한 강력한 시장 분석 도구입니다. 이 도구는 수학적 개념과 간 이론을 사용하여 정확한 시장 분석을 수행합니다. 144, 90, 52의 제곱과 9의 제곱을 사용합니다. 또한 의 9의 제곱근 및 해당 제곱의 채널 및 스타 패턴과의 관련성을 통합합니다. 사용자 메뉴얼 및 적용: 이 지표를 사용하기 전에 사용자 메뉴얼을 읽고 질문이 있을 경우 문의하시기 바랍니다. 전체 메뉴얼은 웹사이트에서 제공됩니다. MT5의 전체 버전을 구매하거나 MT4의 무료 버전을 테스트할 수 있습니다. 두 버전 모두 링크에서 확인하실 수 있습니다. 주요 기능 및 기능: 간 스퀘어 지표는 정확한 결정을 위해 기하학적 개념과 간 이론을 활용하는 시장 분석을 위한 포괄적인 도구 집합을 제공합니다. 주요 기능은 다음과 같습니다. 9의 제곱 분석:   이 지표는 9의 제곱에 대한 수평 선, 스타 패턴, 그리드 및 간 팬을 그릴 수 있습니다. 간
TrendMaestro5
Stefano Frisetti
note: this indicator is for METATRADER4, if you want the version for METATRADER5 this is the link:  https://www.mql5.com/it/market/product/108106 TRENDMAESTRO recognizes a new TREND in the bud, he never makes mistakes. The certainty of identifying a new TREND is priceless. DESCRIPTION TRENDMAESTRO identifies a new TREND in the bud, this indicator examines the volatility, volumes and momentum to identify the moment in which there is an explosion of one or more of these data and therefore the mome
가격이 역전되고 후퇴함에 따라 시장 구조가 변경됩니다. 시장 구조 반전 경고 표시기는 추세 또는 가격 움직임이 고갈에 가까워지고 반전할 준비가 되었음을 식별합니다. 일반적으로 반전이나 큰 하락이 일어나려고 할 때 발생하는 시장 구조의 변화를 알려줍니다. 지표는 가능한 고갈 지점 근처에서 새로운 고점 또는 저점이 형성될 때마다 초기에 돌파와 가격 모멘텀을 식별합니다. 표시기는 반대쪽에 있는 마지막 촛불에 직사각형을 그립니다. 그런 다음 현재의 단기 추세에서 계속 움직이기 때문에 가격과 함께 직사각형을 따라갈 것입니다. 가격이 사각형 위나 아래로 다시 닫힐 정도로 약해지면 시장 구조에 잠재적인 변화가 일어나고 있음을 나타냅니다. 그런 다음 표시기는 방향의 잠재적인 이동과 추세 또는 주요 하락의 가능한 반전 시작에 대해 경고합니다. 작동 방식을 보려면 아래의 작동 표시기를 참조하십시오! 모든 쌍 및 주요 기간을 모니터링하는 대시보드: https://www.mql5.com/
Trend Line Map Pro MT5
STE S.S.COMPANY
4.67 (9)
트렌드 라인 맵 표시기는 트렌드 스크리너 표시기의 애드온입니다. Trend screener(Trend Line Signals)에 의해 생성된 모든 신호에 대한 스캐너로 작동합니다. Trend Screener Indicator 기반의 Trend Line Scanner입니다. Trend Screener Pro 표시기가 없으면 Trend Line Map Pro가 작동하지 않습니다. It's a Trend Line Scanner based on Trend Screener Indicator. If you don't have Trend Screener Pro Indicator,     the Trend Line Map Pro will not work . MQL5 블로그에 액세스하여 추세선 지도 표시기의 무료 버전을 다운로드할 수 있습니다. Metatrader Tester 제한 없이 구매하기 전에 사용해 보십시오. : 여기를 클릭하세요 1. 쉽게 얻을 수 있는 이점 통화 및
Blahtech Supply Demand MT5
Blahtech Limited
4.57 (14)
Was: $299  Now: $99   Supply Demand uses previous price action to identify potential imbalances between buyers and sellers. The key is to identify the better odds zones, not just the untouched ones. Blahtech Supply Demand indicator delivers functionality previously unavailable on any trading platform. This 4-in-1 indicator not only highlights the higher probability zones using a multi-criteria strength engine, but also combines it with multi-timeframe trend analysis, previously confirmed swings
Owl Smart Levels MT5
Sergey Ermolov
4.47 (36)
MT4 버전  |  FAQ Owl Smart Levels Indicator 는 Bill Williams 의 고급 프랙탈, 시장의 올바른 파동 구조를 구축하는 Valable ZigZag, 정확한 진입 수준을 표시하는 피보나치 수준과 같은 인기 있는 시장 분석 도구를 포함하는 하나의 지표 내에서 완전한 거래 시스템입니다. 시장과 이익을 취하는 장소로. 전략에 대한 자세한 설명 표시기 작업에 대한 지침 고문-거래 올빼미 도우미의 조수 개인 사용자 채팅 ->구입 후 나에게 쓰기,나는 개인 채팅에 당신을 추가하고 거기에 모든 보너스를 다운로드 할 수 있습니다 힘은 단순함에 있습니다! Owl Smart Levels 거래 시스템은 사용하기 매우 쉽기 때문에 전문가와 이제 막 시장을 연구하고 스스로 거래 전략을 선택하기 시작한 사람들 모두에게 적합합니다. 전략 및 지표에는 눈에 보이지 않는 비밀 공식 및 계산 방법이 없으며 모든 전략 지표는 공개되어 있습니다. Owl Smart Levels를
TPSproTREND PrO MT5
Roman Podpora
5 (5)
TPSpro TRENDPRO  - is a trend indicator that automatically analyzes the market and provides information about the trend and each of its changes, as well as giving signals for entering trades without redrawing! The indicator uses each candle, analyzing them separately. referring to different impulses - up or down impulse. Exact entry points into transactions for currencies, crypto, metals, stocks, indices!  -  Version MT4                  DETAILED DESCRIPTION        /       TRADING SETUPS       
TrendLine PRO MT5
Evgenii Aksenov
4.78 (49)
The Trend Line PRO indicator is an independent trading strategy. It shows the trend change, the entry point to the transaction, as well as automatically calculates three levels of Take Profit and Stop Loss protection Trend Line PRO is perfect for all Meta Trader symbols: currencies, metals, cryptocurrencies, stocks and indices Advantages of Trend Line PRO Never redraws its signals The possibility of using it as an independent strategy It has three automatic levels Take Profit and Stop Loss lev
Gartley Hunter Multi
Siarhei Vashchylka
5 (5)
Gartley Hunter Multi - An indicator for searching for harmonic patterns simultaneously on dozens of trading instruments and on all classic timeframes: (m1, m5, m15, m30, H1, H4, D1, Wk, Mn). Manual (Be sure to read before purchasing) | Version for MT4 Advantages 1. Patterns: Gartley, Butterfly, Shark, Crab. Bat, Alternate Bat, Deep Crab, Cypher 2. Simultaneous search for patterns on dozens of trading instruments and on all classic timeframes 3. Search for patterns of all possible sizes. Fr
TrendDecoder Premium MT5
Christophe, Pa Trouillas
5 (1)
이제 메타트레이더에서 사용 가능 범위 및 다음 가능한 움직임 식별       |      추세의 초기 신호와 강도를 확인하세요       |      반전 전 명확한 출구 확보       |      가격이 테스트 할 피보 레벨 파악 비추적, 비지연 지표 - 수동 및 자동 거래에 이상적 - 모든 자산 및 모든 시간 단위에 적합 - 출시 시 50% 할인   - 이후 >> $149로 복귀 구매 후   이 채널로 문의 하여 권장 설정을 확인하세요. MT4 버전:   여기를 클릭하세요 BladeSCALPER 및 PowerZONES 로 전체 방법을 확인하세요. 어떤 서비스인가요? 트렌드디코더는 추세 모니터링을 간단하고 쉽게 하기 위한 여러 혁신 기술의 집약체입니다. 투영 추세선(투영 추세선)   - 다가오는 추세의 속도 기준 실시간 추세선과 투영 추세선 비교   - 시장이 이전과 같은 방향으로 움직이고 있는지, 아니면 둔화되고 있는지? 실시간 추세선 교차   - 추세가 궤
Blahtech Market Profile MT5
Blahtech Limited
5 (8)
Was: $249  Now: $99   Market Profile defines a number of day types that can help the trader to determine market behaviour. A key feature is the Value Area, representing the range of price action where 70% of trading took place. Understanding the Value Area can give traders valuable insight into market direction and establish the higher odds trade. It is an excellent addition to any system you may be using. Inspired by Jim Dalton’s book “Mind Over Markets”, this indicator is designed to suit the
Golden Spikes Detector
Batsirayi L Marango
5 (1)
Golden Spikes Detector This indicator is based on an advanced strategy primarily for trading spikes on Boom and Crash Indices. Complex algorithms were implemented to detect high probability entries only. It alerts on potential Buy and Sell entries. To trade spikes on the Deriv or Binary broker, only take Buy Boom and Sell Cash alerts. It was optimised to be loaded on 5-minute timeframe although multiple timeframe analysis is done in the background. Features ·             Desktop pop up and sound
Matrix Arrow Indicator MT5
Juvenille Emperor Limited
5 (14)
매트릭스 화살표 표시기 MT5 는 외환, 상품, 암호 화폐, 지수, 주식과 같은 모든 기호/도구에 사용할 수 있는 100% 다시 칠하지 않는 다중 기간 표시기를 따르는 고유한 10 in 1 추세입니다.  Matrix Arrow Indicator MT5 는 다음과 같은 최대 10개의 표준 지표에서 정보와 데이터를 수집하여 초기 단계에서 현재 추세를 결정합니다. 평균 방향 이동 지수(ADX) 상품 채널 지수(CCI) 클래식 하이켄 아시 캔들 이동 평균 이동 평균 수렴 발산(MACD) 상대 활력 지수(RVI) 상대 강도 지수(RSI) 포물선 SAR 스토캐스틱 오실레이터 윌리엄스의 백분율 범위 모든 지표가 유효한 매수 또는 매도 신호를 제공하면 강력한 상승/하락 추세를 나타내는 다음 캔들/막대가 시작될 때 해당 화살표가 차트에 인쇄됩니다. 사용자는 사용할 표시기를 선택하고 각 표시기의 매개변수를 개별적으로 조정할 수 있습니다. 매트릭스 화살표 표시기 MT5는 선택한 표시기에서만 정보를 수
제작자의 제품 더 보기
ADX Channel Indicator
Alexander Nikolaev
5 (4)
This indicator forms a channel based on the readings of the ADX (Average Directional Movement Index) indicator, displays and informs the trader of a price reversal at the boundaries of this channel, and can also report when the price touches the channel boundaries. It also draws additional dotted lines, which depend on the readings of the + DI and -DI of the ADX indicator. It also has an option for filtering signals depending on the readings of the stochastic. The channel drawn by this indicato
FREE
Doji Finder Indicator MT5
Alexander Nikolaev
3.33 (3)
The indicator analyzes the chart and identifies Doji candlesticks. Shows their appearance and signals the appearance of such a candle (if allowed in the parameters). Also, this indicator shows the strength of the reversal in the form of bars of different colors (the more green, the more likely the rise, the more red - the fall in price). The direction of the signal depends on the direction of the previous candles, as the Doji signals a reversal or correction. In the indicator settings, you can
FREE
Easy Channels MT5
Alexander Nikolaev
5 (1)
This indicator draws price channels. Easy to use. It has various settings, for example, you can configure it to show channels only for buy or sell, you can display trend lines instead of channels. There are many trading strategies that are based on trading in channels, you can trade on the rebound from the borders of the channels, or the breakdown of the channel.   Parameters History - the maximum number of bars for building channels; Distance - the minimum distance from one maximum (or minimum
Easy Bollinger Bands
Alexander Nikolaev
3.88 (8)
This Expert Advisor trades based on the Bollinger Bands indicator. It performs trades after a price rebound from the borderlines of the indicator. It is simple to use, contains only a few settings, which are easy to understand. This is the simplified version of the Master Bollinger Bands Expert Advisor. For better trading results, it is recommended to use the full version of the EA: https://www.mql5.com/en/market/product/21788 The free version does not provide the ability to use multiple indicat
FREE
Free indicator to quickly detect trendline breakouts and high or low of a price range. It displays lines based on the highs and lows of prices, and also finds and displays inclined trend lines. As soon as the price goes beyond the line and the candlestick closes, the indicator signals this with an arrow (you can also enable an alert). This indicator is easy to use and also free. The number of candles for defining trend lines as well as the high and low of the trading range is configurable. It w
FREE
Easy Channels
Alexander Nikolaev
4 (5)
The indicator draws price channels. It can be customized so that only buy or sell channels are displayed. Also, trend lines can be displayed instead of channels. This indicator is easy to use, but nevertheless, there are many trading strategies based on channel trading. Advisor based on this indicator:  https://www.mql5.com/en/market/product/37952 Parameters History - maximum number of bars to build channels; Distance - minimum distance from one High (or Low) to another when constructing a chann
FREE
ADX Channel
Alexander Nikolaev
4.83 (6)
ADX Channel is an indicator that plots the channel depending on the values of the ADX (Average Directional Movement Index) indicator. The resulting channel is a little similar to the Envelopes, but its lines depend on the market volatility. The sell trade is usually executed fast when the price touches and bounces from the upper line of the channel, buy - from the lower. It is recommended to trade when there is no significant news. The recommended timeframes: M5 - H1. The indicator is not design
FREE
This EA trades with the trend using several methods to identify and enter a trade. For example, it uses trendlines, Gator and Stochastic indicators to analyze the market. In addition to trading, it can also display trend lines that it trades based on. It has filters for ADX and MA indicators, as well as a sufficient number of settings to be able to optimize on various currency pairs and timeframes. The EA sets stop loss and take profit for each trade, does not have risky trading methods. It i
Easy Parabolic Sar
Alexander Nikolaev
4.22 (9)
The Expert Advisor places orders based on the points of the Parabolic Sar indicator. If your trading strategy utilizes this indicator, the EA will save you from the necessity to move your pending orders after every candlestick (e.g. 5 minutes or 1 hour) and will do it automatically. You can set the EA to open only BuyStop or only SellStop or both. Buy default both Buy and Sell are enabled. The EA does not use any indicators other than Parapolic Sar. Therefore you are to decide the time to run th
FREE
Easy Candles
Alexander Nikolaev
3.25 (4)
This is a simple and free Expert Advisor that trades candlesticks. It compares several nearest bars and their volumes, and opens a trade based on that data. Unlike the professional version , it analyzes only 1 timeframe. The recommended timeframes for this EA are H1, H4, D1, it works with any currency pairs. The parameters always need to be optimized before trading, as well as after some period of trading. Input Parameters Lots - lot size (if Lots=0, then the lot will be calculated based on th
FREE
Simple Trade MT5
Alexander Nikolaev
This EA is easy to use, it does not have too complicated settings and algorithms for performing trading operations. It’s not optimized for long, it may appeal to those who recently decided to engage in trading on the exchange with the help of advisers, or who do not want to understand the settings for a long time. The basis of his work is several indicators (moving average, RSI, stochastic, ATR). Despite its simplicity, it has a custom trailing stop function, which can reduce the risks for a dep
Trend and correction indicator
Alexander Nikolaev
4.11 (9)
The indicator finds strong trend movements of a currency pair over the specified number of bars. It also finds correction to this trend. When the trend is strong enough, and the correction becomes equal to the values specified in the parameters, the indicator generates a signal. You can set different correction values, while the best suiting are 38, 50 and 62 (Fibonacci levels). In addition, you can configure the minimum length of trend, the number of history bars for search and other parameters
FREE
Break Lines
Alexander Nikolaev
4.8 (5)
The indicator draws lines the the price highs and lows. Break through the high or low usually indicates trend change (or continuation). Once the price moves through a line, and the candlestick closes, the indicator draws an appropriate arrow (also, you can enable alerts). A deal should be conducted in the breakthrough direction immediately or after a slight rollback. It is best to trade following the trend on a larger timeframe. This indicator is easy to use, but nevertheless, there are many tra
FREE
Bollinger with WPR demo
Alexander Nikolaev
3.75 (4)
This Expert Advisor is the free version of "Bollinger with WPR scalper", which is based on the Bollinger bands and Williams' Percent Range indicators. Limitations of the free version: lot is fixed to 0.01, only the EURUSD currency pair is supported, trading time cannot be selected, trailing stop is not available. Nevertheless, it can make quite a lot of deals, so you do not have to wait for positions to be opened (with the appropriate settings and timeframes below H1). The EA can be used on time
FREE
Colored Candles Demo
Alexander Nikolaev
5 (1)
The demo version of the Colored Candles indicator - calculates the parameters of each candle, as well as its volume. After that, it paints the candles depending on their strength and direction. Bullish candles are colored green and bearish candles - red. The greater the power of the bulls or the bears, the brighter the color. You can change the colors if you want. The indicator helps to analyze the price movement, as well as market entry points. The more accurate signals are formed on the higher
FREE
Moving averages are very often used for analyzing currency pairs and trading. This Expert Advisor can analyze many moving averages at once and trade based on this. When the required number of moving averages signal a purchase, the adviser makes a purchase, if the indicators signal a sale, the advisor sells. Also, there is filtering spurious signals at low volatility based on the ADX indicator. In the settings of the adviser, you can set the required number of sliding ones, their period (the init
Three Fractals demo
Alexander Nikolaev
2 (1)
This Expert Advisor identifies trend reversals based on fractals and some other indicators. It is a free lite version of Three fractals Brief description of the trading strategy: when the fractals were formed after a prolonged fall, and the last fractal did not update the minimum of the previous bar's lower fractal, then a trend reversal is determined (at the same time, there must be a fractal in the middle, which is higher than the others). Similarly, opposite for growth. In case other indicato
FREE
Volume Levels MT5 Free
Alexander Nikolaev
This indicator is able to determine the price levels at which there was the most volume for the specified period of history. In the future, the price often bounces off such levels, and this can be successfully applied in trading. They are displayed as lines, some parameters for determining the levels can be adjusted. This indicator is simple, therefore, it does not report signals, and only builds levels on EUR/USD. Parameters HistoryBars - the number of bars to determine the near volume levels;
FREE
Volume Levels USDJPY
Alexander Nikolaev
3.5 (4)
Volume Levels is a very important indicator for exchange trading. Most of the trades were performed on those levels. This indicator displays the price level that had the most trade volumes over a certain period of time. Often, the price bounces from those levels in the future, and it can be successfully used in trading. This is a demo version that works only on the USD/JPY currency pair. To work on all currency pairs, install the full version: https://www.mql5.com/en/market/product/15888 Param
FREE
The utility manages other EAs' orders as well as the ones opened manually. It is capable of trailing the price (trailing stop function), set a stop loss and take profit if they have not been set before. When configuring the utility for an EA having no trailing stop function, place it to the new window with the same currency pair specifying the same Magic value (as for the EA orders the stop loss is to be applied to). You can set any timeframe. It does not affect the utility operation. Set Magic
FREE
Volume Candles
Alexander Nikolaev
Volumes are one of the most important factors of trading, as it is the high volumes that move the market in either direction. But there are very few standard indicators for volumes in MetaTrader 4. The Volume Candles analyses the volumes of the trades and displays candles depending on these volumes. The candle appears once the required number of volumes has passed during trading (the VolumeCandle parameter). If the candles close frequently and are thin, then the volumes on the market are current
Volume Levels
Alexander Nikolaev
5 (3)
Volume Levels is a very important indicator for exchange trading. Most of the trades were performed on those levels. This indicator displays the price level that had the most trade volumes over a certain period of time. Often, the price bounces from those levels in the future, and it can be successfully used in trading. It works on any currency pair. Parameters HistoryBars - the number of bars to determine the near volume levels; Range - the maximum distance above and below the current price t
EMA 8 and 18 Trading System
Alexander Nikolaev
2 (1)
This EA implements the EMA 8/18 strategy, which is used by many traders. Brief description of the strategy: The Buy is determined when the EMA 8 indicator crosses the EMA 18 from below, with the price moving more than 50 points from the crossing. The buy position is opened when the price touches the EMA for the first time, after that, as the price rises, the trade is maintained by a trailing stop with a step of 30-35 points. The opposite is for opening a sell position. The parameters of the fast
ProCandles
Alexander Nikolaev
Some experienced trades can tell where the price will go even without indicators, as the direction of the price can be found using the ordinary candlesticks. The EA compares several nearest bars and their volumes, and opens a trade based on that data. Also, it is able to analyze the candles on two timeframes at the same time to make the entry more accurate and less risky. In addition, the EA can automatically determine the take profit and stop loss size depending on the size of the previous cand
Colored candles
Alexander Nikolaev
Some candles have a strong tendency to continue the movement or to revert it. With the help of the Colored candles indicator such movements are clearly visible. This indicator calculates the parameters of each candle, as well as its volume, and after that it paints the candles depending on its strength and direction. Bullish candles are colored green and bearish candles - red. The greater the power of the bulls or the bears, the brighter the color. You can change the colors if you want. The indi
It is good to know the presence of a trend on multiple timeframes at once. And even better - on multiple currency pairs at once. This indicator allows to quickly determine the presence of a trend or a flat on 8 timeframes and from 1 to 15 currency pairs at once. Multi Alligator Signals analyzes the signals of the Alligator indicator by Bill Williams on every timeframe (from M1 to W1) and multiple currency pairs (up to 15) simultaneously. If there is a buy signal, a green upward arrow is drawn, i
Parabolic And CCI
Alexander Nikolaev
5 (1)
The EA detects strong movements using the Parabolic indicator and opens a trade. The Commodity Channel Index (CCI) is used as an auxiliary indicator. The CCI levels may depend on the ADX indicator values, which allows for better trading with different volatility. Also, the trades are opened depending on the RSI indicator values on a certain timeframe. Recommended timeframes: M5, M15, M30. Make sure to optimize the parameters of the EA for your account before trading. Input Parameters Lots - lo
Breakout Trend Lines
Alexander Nikolaev
5 (2)
The indicator draws lines based on the price Highs and Lows, as well as slant trend lines. Break through the trend line, High or Low usually indicates trend change (or continuation). Once the price moves through a line, and the candlestick closes, the indicator draws an appropriate arrow (also, you can enable alerts). This indicator is easy to use, but nevertheless, there are many trading strategies, which are based on a breakthrough of the trend lines. The number of candlesticks used to determi
Channels Pro
Alexander Nikolaev
5 (5)
The indicator determines and plots price channels or lines, reading information from multiple timeframes (from current, second and third) simultaneously. Color and width of lines for each timeframe can be customized. It is also possible to set different distance between the Highs and Lows for plotting channels or lines. Parameters History - maximum number of bars to plot channels or lines; Distance - minimum distance from one High (or Low) to another when plotting lines; Shift - shift for seve
The Expert Advisor looks for the bars followed by price rises or falls. It analyzes how often rises and falls occur after similar bars and makes trades based on that analysis. The market changes frequently but the EA is able to adapt to the changes performing analysis right during trading. Input Parameters Lots - lot size (if 0, a lot is calculated based on the percentage of account free margin); Percentage of free money - the percentage of free margin to open each new trade (applicable when L
필터:
docjames777
25
docjames777 2024.04.09 15:51 
 

very good indicator

Gloria Sarpong
712
Gloria Sarpong 2024.04.08 15:21 
 

good one

gnanos123
535
gnanos123 2024.02.08 21:14 
 

OK Indicator

Ard Sluis
145
Ard Sluis 2022.11.27 14:32 
 

This indicator is very functional and useful. However, I would love to see 1 addition to it. Right now, when there's a DT/DB, it only prompts you only when you have that specific timeframe on your chart, even when there might be current DT/DB on different timeframes. I would love to see the option to choose a number of timeframes I want to get prompts on in the choice menu (in my case: 30min, 1, 2, 4, 8, 12 and daily). Since there is already an alert feature built in, this addition would make it super useful. Then I can just add this indicator on the currency pairs, indices and metals of my choosing. Still 5 stars. Thank you for your time and expertise to put this together.

y728115
329
y728115 2022.07.27 05:33 
 

Thank you. I will utilize it.

Sebastian Schmidt
1184
Sebastian Schmidt 2022.07.21 02:10 
 

a really very good indicator provides fantastic results on its own. thank you for offering it for free!

리뷰 답변