• 미리보기
  • 리뷰
  • 코멘트

AlgoSamurai Kana Trend

Cutting-edge solution for Trend Trading with statistically robust signals!

Kana Trend’s smart algorithm detects the trend on any instrument, any timeframe, and gives powerful entry signals with exit levels. 

Its advanced statistics gives you deep insight as to success and profitability of its signals -- while being fully transparent on any potential for loss. 

Because this is an indicator, not an EA, you cannot see it in action in visual tester if you download the Free Demo. Instead, please download and test a fully functional version here.

Join our telegram discussion channel here

Features

  • Intelligent and automatic trend detection to give precise Entry and Exit points

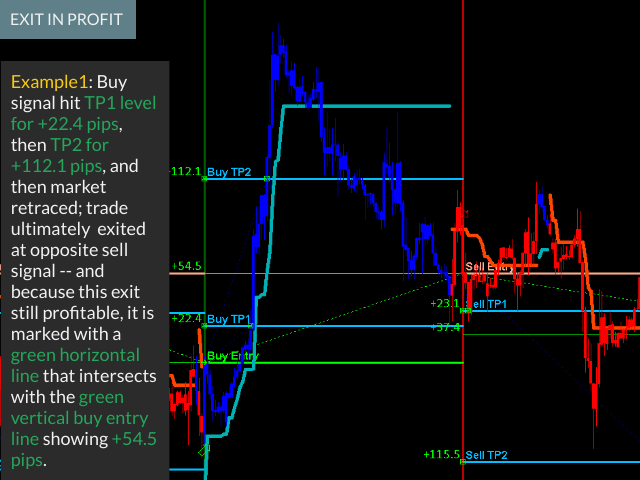
  • Exits based on 3 TP levels, SL and Opposite Close 

  • Detailed statistics showing success rate and profitability 

  • Loss-weighted stats: stats highlight and magnify losses when multiple TPs are used that don't all reach their destination  

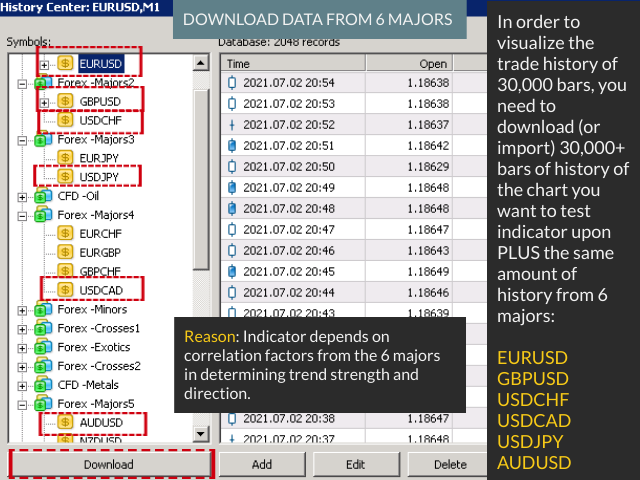
  • Profitable across 30+ instruments (+30,000 bars each) without change of inputs (=robust)

  • Integrated pop-up, email, push notification and sound alerts.

  • 100% Non-Repainting indicator
     

How To Trade

No complicated rules. Just follow 3 simple steps!

Step 1: Trade Setup

  • Enter on buy/sell signal

Step 2: Set Stop Loss

  • Exit on opposite signal and/or SL

Step 3: Set Take Profit

  • Option 1: If only TP1 is true, then take profit on TP1 and/or exit at opposite signal

  • Option 2: If only TP1 and TP2 are true, then take partial profit on TP1 and TP2 and/or exit at opposite signal

  • Option 3: If TP1, TP2 and TP3 are true, then take partial profit on TP1, TP2, and TP3 and/or exit at opposite signal

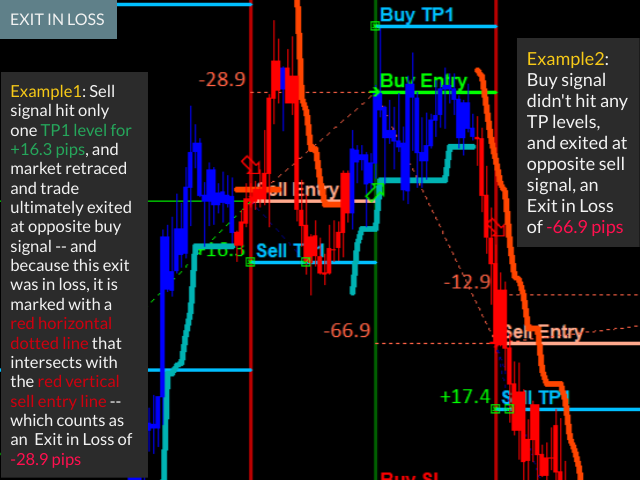
  • Option 4: If no TP levels are true, exit on opposite signal


Enhanced Statistics Calculation


Win Condition

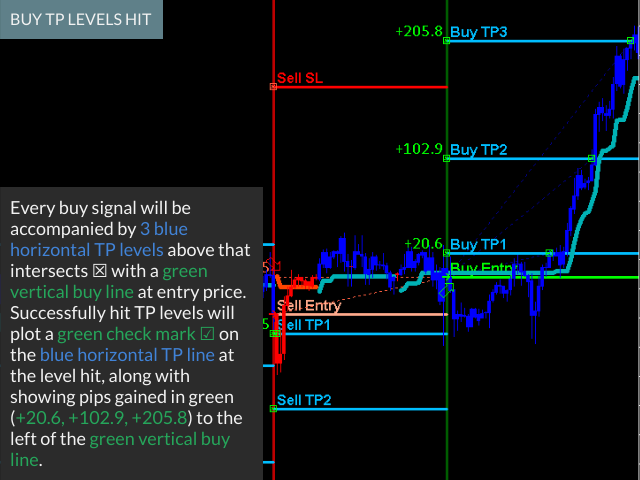
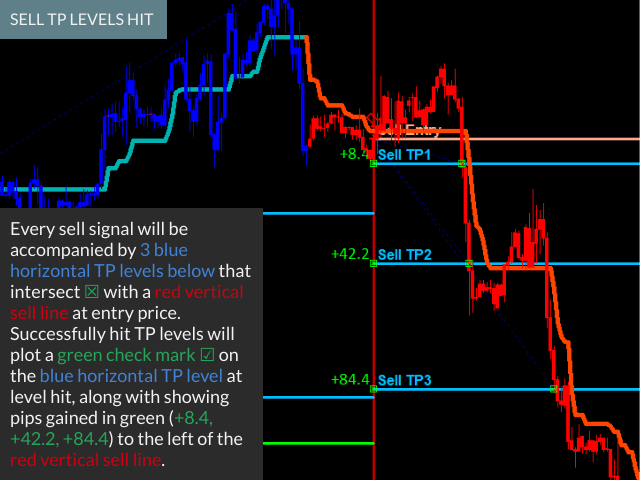
  • TP Hit - When a signal reaches at least one TP level 

  • Exit Win - When a trade closed on opposite signal results in positive profit

Loss Condition

  • SL Hit - When a signal hits the SL 

  • Exit Loss - When trade closed on opposite signal results in negative profit

Success Rate

  • Percentage of signals which meet the win condition divided by the total number of trades, including potential losses

  • Used as reference to find better trending pairs and timeframes.

Profit Factor

  • See your total profit, total loss and net profit/loss in pips or points

  • Use profit factor (total profit / total loss) > 1.5 as a reference to find more robust pairs and timeframes. Hint: Best results on H1. 

Note: We use a loss-weighted formula for generating success rate and profit factor. Loss conditions are counted -- and magnified (this is key)- if multiple TPs are active but only some of them are successfully hit before the market eventually exits in loss. Imagine trading with 3 positions expecting to reach 3 different take profits; if only one TP is hit while the other two exit in loss, then your overall success rate ought to be reduced by these losses, and they ought to count as double damage in gross loss. Scoring for only the hit of TP1 conceals real losses and artificially inflates win rate and profitability.  


Settings

Entry Rules - Customize timeframe and 2 inputs. 
  • Time Frame  - choose the time frame. Default is current chart. 
  • Kana Length - the number of bars used to calculate the trend. Default is 70. 
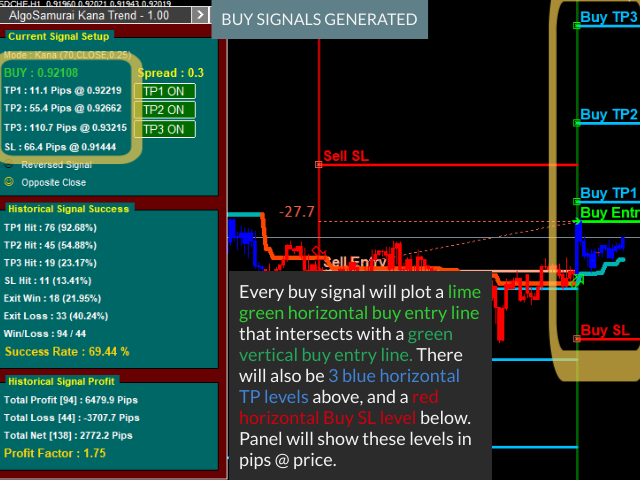
  • Kana Level - the level in which the indicator must cross to generate a signal. Default is 0.25. 

Position Settings - Controls if the position will be reversed, traded long and/or short, with opposite close, and if spread handicap is used.

  • Spread Handicap - Allows you to indicate a current or custom spread to provide for a more realistic result. 


TP Rules
Controls if the position will have 0-3 take profit levels, and how those TP levels will be calculated, in fixed pips or ATR based pip calculations.  Default is to use all 3 TP levels in ATR mode.  

SL Rules -  Controls if the position will have SL or not, and how that SL level will be calculated, in fixed pips or ATR based pip calculations. Default is to use SL in ATR mode. 

Alert Settings -  Controls the alert options enabled.

Visual Settings - Controls the visibility of objects drawn on the chart.

Note: In order to visualize the trade history greater than 2000 bars, you need to download (or import) 30,000+ bars of history of the chart you want to test indicator upon plus the same amount of history from 6 majors: EURUSD, GBPUSD, USDCHF, USDCAD, USDJPY, AUDUSD.


추천 제품
VR Cub
Vladimir Pastushak
VR Cub 은 고품질 진입점을 얻는 지표입니다. 이 지표는 수학적 계산을 용이하게 하고 포지션 진입점 검색을 단순화하기 위해 개발되었습니다. 지표가 작성된 거래 전략은 수년 동안 그 효율성을 입증해 왔습니다. 거래 전략의 단순성은 초보 거래자라도 성공적으로 거래할 수 있다는 큰 장점입니다. VR Cub은 포지션 개시 지점과 이익 실현 및 손절매 목표 수준을 계산하여 효율성과 사용 편의성을 크게 높입니다. 간단한 거래 규칙을 이해하려면 아래 전략을 사용한 거래 스크린샷을 살펴보세요. 설정, 세트 파일, 데모 버전, 지침, 문제 해결 등은 다음에서 얻을 수 있습니다. [블로그] 다음에서 리뷰를 읽거나 작성할 수 있습니다. [링크] 버전 [MetaTrader 5] 진입점 계산 규칙 포지션 개설 진입점을 계산하려면 VR Cub 도구를 마지막 최고점에서 마지막 최저점까지 늘려야 합니다. 첫 번째 지점이 두 번째 지점보다 빠른 경우, 거래자는 막대가 중간선 위에서 마감될 때까지 기다립
Infinity Trend Pro
Yaroslav Varankin
1 (1)
This is a trend indicator without redrawing Developed instead of the binary options strategy (by the color of the Martingale candlestick) Also works well in forex trading When to open trades (binary options) A signal will appear in the place with a candle signaling the current candle It is recommended to open a deal for one candle of the current timeframe M1 and M5 When a blue dot appears, open a deal up When a red dot appears, open a trade down. How to open trades on Forex. When a signal is rec
Owl smart levels
Sergey Ermolov
4.63 (54)
MT5 버전  |   FAQ Owl Smart Levels Indicator 는   Bill Williams 의 고급 프랙탈, 시장의 올바른 파동 구조를 구축하는 Valable ZigZag, 정확한 진입 수준을 표시하는 피보나치 수준과 같은 인기 있는 시장 분석 도구를 포함하는 하나의 지표 내에서 완전한 거래 시스템입니다. 시장과 이익을 취하는 장소로. 전략에 대한 자세한 설명 표시기 작업에 대한 지침 고문-거래 올빼미 도우미의 조수 개인 사용자 채팅 ->구입 후 나에게 쓰기,나는 개인 채팅에 당신을 추가하고 거기에 모든 보너스를 다운로드 할 수 있습니다 힘은 단순함에 있습니다! Owl Smart Levels   거래 시스템은 사용하기 매우 쉽기 때문에 전문가와 이제 막 시장을 연구하고 스스로 거래 전략을 선택하기 시작한 사람들 모두에게 적합합니다. 전략 및 지표에는 눈에 보이지 않는 비밀 공식 및 계산 방법이 없으며 모든 전략 지표는 공개되어 있습니다. Owl Smart Lev
The Th3Eng PipFinite indicator is based on a very excellent analysis of the right trend direction with perfect custom algorithms. It show the true direction and the best point to start trading. With StopLoss point and Three Take Profit points. Also it show the right pivot of the price and small points to order to replace the dynamic support and resistance channel, Which surrounds the price. And Finally it draws a very helpful Box on the left side on the chart includes (take profits and Stop loss
Chart Patterns Detect 15 patterns (Ascending Triangle, Descending Triangle, Rising Wedge, Falling Wedge, Bullish Flag, Bearish Flag, Bullish Rectangle, Bearish Rectangle Symmetrical triangle, Head and Shoulders, Inverted Head and Shoulders, Triple top, Triple Bottom, Double Top, Double Bottom) Use historical data to calculate the probability of each pattern to succeed (possibility to filter notification according to the chance of success) gives graphic indication about the invalidation level and
Noize Absorption Index MT4
Ekaterina Saltykova
5 (1)
Noize Absorption Index - is the manual trading system that measures the difference of pressure between bears forces and bulls forces. Green line - is a noize free index that showing curent situation. Zero value of index shows totally choppy/flat market.Values above zero level shows how powerfull bullish wave is and values below zero measures bearish forces.Up arrow appears on bearish market when it's ready to reverse, dn arrow appears on weak bullish market, as a result of reverse expectation. S
Master scalping M1
Nataliia Marchuk
Master Scalping M1 is an innovative indicator that uses an algorithm to quickly and accurately determine the trend.The indicator calculates the time of opening and closing positions, the indicator's algorithms allow you to find the ideal moments to enter a deal (buy or sell an asset), which increase the success of transactions for most traders. Benefits of the indicator: Easy to assemble, does not overload the chart with unnecessary information. Can be used as a filter for any strategy. Works on
PZ Trend Trading
PZ TRADING SLU
4.75 (4)
Trend Trading is an indicator designed to profit as much as possible from trends taking place in the market, by timing pullbacks and breakouts. It finds trading opportunities by analyzing what the price is doing during established trends. [ Installation Guide | Update Guide | Troubleshooting | FAQ | All Products ] Trade financial markets with confidence and efficiency Profit from established trends without getting whipsawed Recognize profitable pullbacks, breakouts and early reversals The ind
Fibonacci retracement and extension line drawing tool Fibonacci retracement and extended line drawing tool for MT4 platform is suitable for traders who use  golden section trading Advantages: There is no extra line, no too long line, and it is easy to observe and find trading opportunities Trial version: https://www.mql5.com/zh/market/product/35884 Main functions: 1. Multiple groups of Fibonacci turns can be drawn directly, and the relationship between important turning points
Atomic Analyst
Issam Kassas
5 (1)
우선적으로 언급할 점은이 거래 지표가 다시 그리지 않고 지연되지 않으며 이를 통해 수동 및 로봇 거래 모두에 이상적이라는 점입니다. Atomic Analyst는 가격의 강도와 모멘텀을 활용하여 시장에서 더 나은 이점을 찾는 PA Price Action Indicator입니다. 고급 필터를 장착하여 잡음과 거짓 신호를 제거하고 거래 잠재력을 높이는 데 도움이 됩니다. 복잡한 지표의 다중 레이어를 사용하여 Atomic Analyst는 차트를 스캔하고 복잡한 수학적 계산을 간단한 신호와 색상으로 변환하여 초보 트레이더가 이해하고 일관된 거래 결정을 내릴 수 있도록합니다. "Atomic Analyst"는 새로운 및 경험이 풍부한 트레이더를위한 종합적인 거래 솔루션입니다. 프리미엄 지표와 최고 수준의 기능을 하나의 거래 전략에 결합하여 모든 종류의 트레이더에 대한 다재다능한 선택지가되었습니다. 인트라데이 거래 및 스캘핑 전략 : 빠르고 정확한 일일 거래 및 단기 거래를 위해 설계
This is a new strategy for SUPPLY DEMAND areas It is based on a calculation using the tick volume to detect the big price action in market for both bear /bull actions this smart volume action candles are used to determine the supply and demand areas prices in between main supply and demand lines indicate sideway market  up arrows will be shown when prices moves above the main supply and the secondary supply lines Down arrows will be shown when prices moves below the main demand and the secondary
캔들의 종가를 예측하는 지표입니다. 지표는 주로 D1 차트에서 사용하기 위한 것이. 이 지표는 전통적인 외환 거래와 바이너리 옵션 거래 모두에 적합합니다. 지표는 독립형 거래 시스템으로 사용하거나 기존 거래 시스템에 추가로 사용할 수 있습니다. 이 표시기는 현재 양초를 분석하여 양초 본체 내부의 특정 강도 요인과 이전 양초의 매개변수를 계산합니다. 따라서 지표는 시장 움직임의 추가 방향과 현재 양초의 종가를 예측합니다. 이 방법 덕분에 지표는 단기 및 중장기 거래 모두에 적합합니다. 지표를 사용하면 시장 상황을 분석하는 동안 지표가 생성할 잠재적 신호의 수를 설정할 수 있습니다. 표시기 설정에는 이를 위한 특별한 매개변수가 있습니다. 또한 인디케이터는 새로운 신호에 대해 차트의 메시지 형태, 이메일 및 PUSH 알림 형태로 알릴 수 있습니다. 구매 후 저에게 꼭 써주세요! 나는 당신에게 지표와 거래에 대한 나의 추천을 줄 것입니다! 또한 보너스를 받으세요!
Sto Signal AM
Andriy Matviyevs'kyy
This indicator displays Stochastic osc signals on the price chart and allows the user to receive notifications of such signals. The Stochastic indicator is a classic and proven indicator of the technical analysis of the markets. Despite its age, it is still relevant today. Depending on the settings, the indicator allows you to work effectively on various TFs and any markets. Signals are given on fully formed bars and are not redrawn. Custom Parameters: Stochastic_Price (0-1) - The applied pric
FREE
Cosmic Diviner X Planet
Olena Kondratenko
4 (2)
This unique multi-currency strategy simultaneously determines the strength of trends and market entry points, visualizing this using histograms on the chart. The indicator is optimally adapted for trading on the timeframes М5, М15, М30, Н1. For the convenience of users, the indicator renders the entry point (in the form of an arrow), recommended take profit levels (TP1, TP2 with text labels) and the recommended Stop Loss level. The take profit levels (TP1, TP2) are automatically calculated for
Trendiness Index
Libertas LLC
5 (3)
"The trend is your friend" is one of the best known sayings in investing, because capturing large trendy price movements can be extremely profitable. However, trading with the trend is often easier said than done, because many indicators are based on price reversals not trends. These aren't very effective at identifying trendy periods, or predicting whether trends will continue. We developed the Trendiness Index to help address this problem by indicating the strength and direction of price trend
PipFinite Exit EDGE
Karlo Wilson Vendiola
4.89 (160)
Did You Have A Profitable Trade But Suddenly Reversed? In a solid strategy, exiting a trade is equally important as entering. Exit EDGE helps maximize your current trade profit and avoid turning winning trades to losers. Never Miss An Exit Signal Again Monitor all pairs and timeframes in just 1 chart www.mql5.com/en/blogs/post/726558 How To Trade You can close your open trades as soon as you receive a signal Close your Buy orders if you receive an Exit Buy Signal. Close your Sell orde
Super Gator
Agustinus Biotamalo Lumbantoruan
This indi shows the following 1. Supertrend 2. Alligator (Not a regular alligator) 3. ZigZag 4. Moving Average 5. Trend Continuation/Mini correction Signal (plotted in X) (See screenshots in green background color 6. Early Signal Detection (See screenshots in green background color) You may treat Alligator as the lagging indicator The leading indicator is the supertrend. The zig zag is based on the leading indicator where it gets plotted when the leading indicator got broken to the opposite.
ZhiBiCCI MT4
Qiuyang Zheng
5 (1)
[ZhiBiCCI] indicators are suitable for all cycle use, and are also suitable for all market varieties. [ZhiBiCCI] Green solid line is a reversal of bullish divergence. The green dotted line is a classic bullish divergence. [ZhiBiCCI] The solid line to the red is a reverse bearish divergence. The red dotted line is a classical bearish divergence. [ZhiBiCCI] can be set in the parameters (Alert, Send mail, Send notification), set to (true) to send instant signals to the alarm window, email, in
Heiken Ashi candle chart is an improved version of The Japanese candle chart, which can effectively filter the market "noise" of the Japanese candle chart. It is favored by many traders for its simplicity and intuition. For trend traders, the HA candle chart is a magic tool. Unlike the traditional Japanese candle chart, Heikenashi does not reflect the opening price, high price, low price and closing price of the market. Instead, Heikenashi calculates the value of a single K line in the dominant
Strong Retracement Points Pro demo edition! SRP (Strong Retracement/Reversal Points) is a powerful and unique support and resistance indicator. It displays the closest important levels which we expect the price retracement/reversal! If all level are broken from one side, it recalculates and draws new support and resistance levels, so the levels might be valid for several days depending on the market! If you are still hesitating to start using this wonderful tool, you can check this link to see h
WanaScalper MT4
Isaac Wanasolo
1 (1)
A scalping indicator based on mathematical patterns, which on average gives signals with relatively small SL, and also occasionally helps to catch big moves in the markets (more information in the video) This indicator has three main types of notifications: The first type warns of a possible/upcoming signal on the next bar The second type indicates the presence of a ready signal to enter the market/open a position The third type is for SL and TP levels - you will be notified every time price r
무한대에서 통화의 강도를 측정하는이 혁신적인 지표는 오랫동안 거래하는 암표 및 거래자에게 없어서는 안될 조수입니다. 통화의 강도/약점을 분석하는 시스템은 오랫동안 알려져 있으며 세계 최고의 거래자들에 의해 시장에서 사용되었습니다. 이 분석 없이는 차익 거래가 완료되지 않습니다. 우리의 지표는 서로 관련하여 기본 통화의 강도를 쉽게 결정합니다. 표시 라인에 차트에 대한 모든 또는 현재 통화 쌍의 수 있도록 즉각적인 분석 및 검색에 대한 강한 진입 점. 표시등,직관적 인 사용하면 신속하게 찾아와 스위치는 모든 쌍,모바일 패널 배치할 수 있는 모두에서 지하실에는 기본 차트. 통화의 강도의 변화의 통지의 타이머 모드는 상인에게 전화로 알림을받을 수있는 기회를 제공합니다.  통화 전력계 무한대 표시기를 사용하기위한 몇 가지 전략: 1. 신흥 추세에 대한 신호로 교차점을 검색 할 통화의 강도의 선형 표시의 차트를 사용하여 2. 추세 반전 신호가 나타난 후 강한 통화 방향으로 두피
Market Breaker Updated version 3
Allistair Kabelo Mandow
1 (1)
Features for software Main functions: Accurate entry signals WITHOUT REPAINTING! Once a signal appears, it remains valid! This is a significant distinction from repainting indicators that might provide a signal and then alter it, potentially leading to deposit losses. Now, you can enter the market with higher probability and precision. There's also a function to colour candles after an arrow appears until the target (take profit) is reached or a reversal signal appears . Display of STOP LOSS
Wave Wolf MT4
Andrei Salanevich
거래 단말기의 현재 창에 늑대 파도를 검색하여 표시하도록 설계되었습니다. 거래에 늑대 파도를 사용하는 상인을위한 훌륭한 지표. 거래 전략에서의 적용은 효율성과 수익성을 크게 증가시킬 것입니다. 표시기에 대한 정보 다른 늑대 웨이브 지표와는 달리,웨이브 고원지 외환 지표는 크게 그 효과를 증가 기능을 가지고 있습니다: 첫 번째는 열린 창 5 점 매개 변수(진정한 값)정보 지원을 제공합니다,즉 늑대 파도가 나타난 차트의 창을 확장합니다. 예를 들어,유로화 차트가 열려 있고 각각에 웨이브 월드 표시기가 설치되어있는 경우 유로화 모델이 감지되면 해당 차트가 자동으로 다른 차트의 맨 위에 포 그라운드로 가져 오므로 많은 상품을 거래 할 때 매우 편리합니다.  두 번째 기능은 맥 디에 내장 된 발산 분석,사용자가 자신을 선택할 수있는 매개 변수(기본 설정(12,26,9))입니다. 그런데 일반적인 오실레이터의 값은 작업 창에 표시되지 않으며 점을 형성 할 때 가격 라벨의 색상에만 반영됩
Trade with Gann on your side!! MASTER CIRCLE 360 CIRCLE CHART, originally created by Gann admitted that this is “The Mother of all charts”. It is one of the last studies that this great trader left for us. The numeric tab le is apparently quite simple like all the tables and is based on square numbers, the SQUARE OF 12 and is by evolution, one of the most important square numbers. Here we can find CYCLE, PRICE AND TIME thanks to angles and grades, to show past and future support and resistance.
MovingFlatBreakout
Stanislav Korotky
This indicator monitors the market for a flat state and possible breakout. The flat state is detected as a predefined number of consecutive bars during which price fluctuates inside a small range. If one of the next bars closes outside the range, breakout is signaled. The indicator shows 3 lines: blue - upper bound of flat ranges AND consecutive breakout areas; red - lower bound of flat ranges AND consecutive breakout areas; yellow - center of flat ranges (NOT including breakout areas). When a b
Delta Pairs
Anatolii Zainchkovskii
1 (1)
Delta Pairs is an indicator for pair trading, it displays the divergence of two currency pairs. Does not redraw. A useful tool for the analysis of the behavior of two currency pairs relative to each other. Purpose The Delta Pairs indicator is designed for determining the divergences in the movements of two currency pairs. This indicator is displayed as two line charts and the difference (delta) between these charts in the form of a histogram. The Delta Pairs indicator will be useful for those
Trend Monitor
Pavel Zamoshnikov
4.2 (5)
The indicator generates early signals basing on ADX reading data combined with elements of price patterns. Works on all symbols and timeframes. The indicator does not redraw its signals. You see the same things on history and in real time. For better visual perception signals are displayed as arrows (in order not to overload the chart). Features Easy to use. Filter configuration only requires selection of sensitivity in the " Sensitivity of the indicator " input. Signals can be filtered usin
For sure, this indicator has become very popular amongst traders. Through coding this indicator will give you the most accurate levels possible for your trading analysis. We have also added in the ability for you to receive alerts when the price breaks above or below a Support or Resistance lines! HOW TO USE The red rectangles represent your resistance/supply zone. The green rectangles represent your support/demand zone.  BONUS FEATURES We coded this indicator with the ability to switch between
This indicator is another variant of the famous powerful indicator Fibonacci-SS https://www.mql5.com/en/market/product/10136 but has different behaviour in placing Pending Order and TP Line. Automatically places Fibonacci retracement lines from the last highest and lowest visible bars on the chart with: An auto Pending Order (Buy/Sell). Taking Profit 1, Taking Profit 2 is pivot point and Taking Profit 3 for extended reward opportunity. The best risk and reward ratio. Simple and powerful indica
이 제품의 구매자들이 또한 구매함
TrendMaestro
Stefano Frisetti
5 (2)
note: this indicator is for METATRADER4, if you want the version for METATRADER5 this is the link: TRENDMAESTRO recognizes a new TREND in the bud, he never makes mistakes. The certainty of identifying a new TREND is priceless. DESCRIPTION TRENDMAESTRO identifies a new TREND in the bud, this indicator examines the volatility, volumes and momentum to identify the moment in which there is an explosion of one or more of these data and therefore the moment in which prices have strong probability of f
현재 20% 할인 ! 초보자 또는 전문가 트레이더를 위한 최고의 솔루션! 이 대시보드 소프트웨어는 28개의 통화 쌍에서 작동합니다. 2가지 주요 지표(Advanced Currency Strength 28 및 Advanced Currency Impulse)를 기반으로 합니다. 전체 Forex 시장에 대한 훌륭한 개요를 제공합니다. 고급 통화 강도 값, 통화 이동 속도 및 모든(9) 시간대의 28 Forex 쌍에 대한 신호를 보여줍니다. 추세 및/또는 스캘핑 기회를 정확히 파악하기 위해 차트의 단일 지표를 사용하여 전체 시장을 볼 수 있을 때 거래가 어떻게 개선될지 상상해 보십시오! 잠재적인 거래를 식별하고 확인하면서 강력한 통화와 약한 통화를 더욱 쉽게 식별할 수 있도록 이 지표에 기능을 내장했습니다. 이 표시기는 통화의 강세 또는 약세가 증가 또는 감소하는지 여부와 모든 시간대에서 수행되는 방식을 그래픽으로 보여줍니다. 추가된 새로운 기능은 현재 시장 조건 변화에 적
기적적인 외환 지표 소개: 정확한 트레이딩의 힘을 발휘하세요 모든 시간대에서 뛰어난 결과를 제공하는 최고의 외환 지표를 찾는데 지친 적이 있나요? 더 이상 찾을 필요가 없습니다! 기적적인 외환 지표가 도래하여 귀하의 트레이딩 경험을 혁신하고 수익을 새로운 고도로 끌어올립니다. 최첨단 기술과 수년간의 정성스런 개발을 토대로 기적적인 외환 지표는 외환 시장에서의 힘과 정확성의 정점으로 떠오릅니다. 이 탁월한 도구는 모든 수준의 트레이더의 요구를 충족시키고 지속적인 수익을 추구하는 데에서 비길 데 없는 우위를 제공하기 위해 설계되었습니다. 기적적인 외환 지표의 가장 큰 장점은 그 뛰어난 적응성에 있습니다. 당신이 데이 트레이더, 스윙 트레이더이든 장기 포지션을 선호하든, 이 지표는 모든 시간대에서 뛰어난 결과를 제공하기 위해 최적화되었습니다. 그러나 그 정확성과 시장의 복잡한 움직임을 포착하는 능력이 참으로 빛을 발하는 것은 1시간 기간대에서 사용할 때입니다. 기적적인 외환 지표의 정확성
FX Volume
Daniel Stein
4.6 (35)
모닝 브리핑을 통해 세부 정보와 스크린샷으로 매일 시장 업데이트를 받으세요 여기 mql5 및 텔레그램에서 FX 거래량은 브로커의 관점에서 시장 심리에 대한 실제 통찰력을 제공하는 최초이자 유일한 거래량 지표입니다. 브로커와 같은 기관 시장 참여자가 외환 시장에서 어떤 포지션을 취하고 있는지에 대한 훌륭한 통찰력을 COT 보고서보다 훨씬 빠르게 제공합니다. 차트에서 이 정보를 직접 확인하는 것은 트레이딩의 진정한 판도를 바꾸고 획기적인 솔루션입니다. 다음과 같은 고유한 시장 데이터 인사이트의 이점 비율 는 통화의 매수/매도 포지션 비율을 백분율로 표시 비율 변화 는 선택한 기간 내 매수 비율과 비율 변화를 표시 총 거래량 는 해당 통화의 총 거래량(롱 및 숏)을 로트 단위로 보여줍니다 Volumes Long 는 해당 통화의 모든 롱 포지션의 거래량을 보여줍니다 Volumes Short 는 해당 통화의 모든 숏 포지션의 거래량을 보여줍니다 Net Long 는 순 롱 포지션의 거래량
Shepherd Harmonic Pattern
Abdullah Alrai
4.68 (59)
이 지표는 수동 및 자동 방법으로 차트에 그려진 고조파 패턴을 감지합니다. 사용자 매뉴얼은 다음 링크에서 확인할 수 있습니다. 리뷰를 작성하고 문의하면 무료 버전으로 MT4에서 제품을 시도할 수 있습니다. Gartley 및 Nenstar 패턴을 감지하는 데 사용할 수 있습니다. https://www.mql5.com/en/market/product/30181 전체 MT4 버전을 구입하려면 다음에서 구입할 수 있습니다. https://www.mql5.com/en/market/product/15212 참고 사항 지표에는 제어 패널이 있으며 모든 (차트 및 시간대) 설정을 저장합니다. 차트에서 더 많은 공간을 확보하려면 최소화할 수 있으며, 다른 분석 도구로 작업하는 것이 선호되는 경우 모든 지표 데이터를 숨기려면 닫기 버튼을 누를 수 있습니다. 이 지표를 사용하고 설정을 변경하면 이동 평균 또는 볼린저 밴드와 같은 지표를 추가하면 자동으로 템플릿을 저장하고 필요할 때 언제든지 로드할 수
TakePropips Donchian Trend Pro
Eric John Pajarillaga Aldana
4.82 (17)
TakePropips Donchian Trend Pro   (MT4)는 Donchian 채널을 사용하여 추세의 방향을 자동으로 감지하고 진입 및 퇴장 거래 신호를 제공하는 강력하고 효과적인 도구입니다! 이 다기능 지표에는 추세 스캐너, 거래 신호, 통계 패널, 스크리너, 거래 세션 및 경고 내역 대시보드가 포함됩니다. 거래 신호를 제공하고 차트 분석 시간을 절약하도록 설계되었습니다! 다음 블로그 게시물에서 사용자 설명서 및 설치 가이드를 다운로드할 수 있습니다.   https://www.mql5.com/en/blogs/post/751368 오늘 50% 할인을 받으세요! 가격이 $98에서 $49로 인하되었습니다! 전략 테스터에서 이 지표를 테스트할 수 있습니다(비주얼 모드 활성화). 실시간 차트에서 테스트하고 싶다면 저에게 메시지를 보내 7일 평가판을 받을 수도 있습니다. 자세한 내용은 설명 아래에 비디오 자습서도 제공됩니다. 질문이 있거나 도움이 필요하면 저에게 연락하십시오.
How to use Pair Trading Station Pair Trading Station is recommended for H1 time frame and you can use it for any currency pairs. To generate buy and sell signal, follow few steps below to apply Pair Trading Station to your MetaTrader terminal. When you load Pair Trading Station on your chart, Pair Trading station will assess available historical data in your MetaTrader platforms for each currency pair. On your chart, the amount of historical data available will be displayed for each currency pai
Cycle Sniper
Elmira Memish
4.41 (34)
NEW YEAR SALE PRICE FOR LIMITED TIME!!! Please contact us after your purchase and we will send you the complimentary indicators to complete the system Cycle Sniper is not a holy grail but when you use it in a system which is explained in the videos, you will feel the difference. If you are not willing to focus on the charts designed with Cycle Sniper and other free tools we provide, we recommend not buying this indicator. We recommend watching the videos about the indiactor and system before pu
ON Trade Waves Patterns Harmonic Elliot Wolfe를 소개합니다. 이는 수동 및 자동 방법을 사용하여 다양한 시장 패턴을 감지하기 위해 개발된 고급 지표입니다. 다음은 그 작동 방식입니다: 조화적 패턴: 이 지표는 차트에 나타나는 조화적 패턴을 식별할 수 있습니다. 이러한 패턴은 Scott Carney의 "Harmonic Trading vol 1 및 2"에서 설명한 것처럼 조화적 거래 이론을 연습하는 트레이더에게 중요합니다. 수동으로 그리든 자동 감지를 사용하든 ON Trade Waves Patterns가 도움을 줄 것입니다. 컨트롤 패널: 이 지표에는 사용자 친화적인 컨트롤 패널이 있습니다. 차트 및 시간 프레임 설정을 저장하여 다양한 구성 간에 쉽게 전환할 수 있습니다. 차트 공간을 최대화하려면 최소화할 수도 있습니다. 다른 분석 도구를 사용하는 것을 선호하는 경우 닫기 버튼을 클릭하여 모든 지표 데이터를 숨길 수 있습니다. 템플릿 저장: 설정을 사
XQ Indicator MetaTrader 4
Marzena Maria Szmit
3 (2)
Step into the realm of Forex trading with confidence and precision using XQ, a cutting-edge Forex indicator designed to elevate your trading game to unprecedented heights. Whether you're a seasoned trader or just stepping into the world of currency exchange,   XQ Forex Indicator   empowers you with the insights and signals needed to make informed trading decisions. The signal conditions are a combination of three indicators, and XQ Forex Indicator only display  medium and long-term trends . The
Ultimate Sniper Dashboard
Hispraise Chinedum Abraham
4.84 (25)
299달러로 할인! 추후 가격이 인상될 수 있습니다! 아래 설명을 읽어보세요! Ultimate Sniper Dashboard를 위한 최고의 엔트리 시스템: ULTIMATE DYNAMIC LEVELS. (내 제품을 확인하십시오) Ultimate Sniper Dashboard는 MT4 다중 통화 테스트 제한으로 인해 라이브 시장에서만 작동합니다. Ultimate-Sniper 대시보드를 소개합니다! HA-Sniper와 MA-Sniper를 모두 포함하는 최고의 제품입니다. 그리고 많은 특수 모드. Ultimate Sniper Dashboard는 절대 야수입니다! 초보자 또는 전문가 트레이더를 위한 최고의 솔루션! 다시 움직임을 놓치지 마세요! 단순함과 핍을 좋아하는 트레이더를 위해 특별한 제품을 준비했습니다. 본질적으로 단순한 대시보드는 여러 사용자 지정 알고리즘을 기반으로 28개의 통화 쌍을 살펴보는 모든 작업을 수행합니다. 단 하나의 차트로 전문가처럼 시장을 읽을 수 있습니다. 움직이기
ON Trade Optuma Astro
Abdullah Alrai
5 (4)
물론입니다. 아래는 제공해주신 텍스트의 한국어 번역입니다: MT4용 천문학 지표 소개: 귀하의 최상급 하늘 트레이딩 동반자 트레이딩 경험을 천체의 높이로 끌어올리기 준비가 되셨나요? MT4용 천문학 지표를 소개합니다. 이 혁신적인 도구는 복잡한 알고리즘의 힘을 활용하여 탁월한 천문학적 통찰과 정밀한 계산을 제공합니다. 정보의 우주를 손에 담다: 천문학적 데이터의 보물함을 드러내는 포괄적인 패널을 살펴보세요. 행성의 지오/헬리오센트릭 좌표, 태양/지구 거리, 크기, 길이, 별자리, 황도 좌표 및 적도 좌표, 심지어 수평 좌표 등 각각이 정밀하게 계산되고 아름답게 제시됩니다. 지표에 의해 생성된 수직선은 시간 값에 해당하여 트레이딩 여정에 우주적인 시각을 부여합니다. 행성 라인과 관계: 수정 가능한 스케일과 각도로 차트를 장식하는 행성 라인의 마법을 경험해보세요. 직관적인 컨트롤 패널을 통해 각 행성의 라인의 가시성을 손쉽게 전환할 수 있습니다. 쥰션이나 섹스타일, 사분각, 삼분각, 트
Supply and Demand Dashboard PRO
Bernhard Schweigert
4.82 (22)
현재 20% 할인! 이 대시보드는 여러 기호와 최대 9개의 타임프레임에서 작동하는 매우 강력한 소프트웨어입니다. 주요 지표(최상의 리뷰: 고급 공급 수요)를 기반으로 합니다.   Advanced Supply Demand 대시보드는 훌륭한 개요를 제공합니다. 다음과 같이 표시됩니다.  영역 강도 등급을 포함하여 필터링된 공급 및 수요 값, 영역에 대한/및 영역 내 Pips 거리, 중첩된 영역을 강조 표시하고 모든 (9) 시간 프레임에서 선택한 기호에 대해 4가지 종류의 경고를 제공합니다. 그것은 당신의 개인적인 필요에 맞게 고도로 구성 가능합니다! 당신의 혜택! 모든 트레이더에게 가장 중요한 질문: 시장에 진입하기에 가장 좋은 수준은 무엇입니까? 최고의 성공 기회와 위험/보상을 얻으려면 강력한 공급/수요 영역 내 또는 그 근처에서 거래를 시작하십시오. 손절매를 위한 최적의 장소는 어디입니까? 가장 안전하려면 강력한 수요/공급 구역 아래/위에 정
TPA True Price Action indicator reveals the true price action of the market makers through 100% non-repainting signals (except early signals mode) strictly at the close of a candle! TPA shows entries and re-entries, every time the bulls are definitely stronger than the bears and vice versa. Not to confuse with red/green candles. The shift of power gets confirmed at the earliest stage and is ONE exit strategy of several. There are available now two free parts of the TPA User Guide for our custo
PZ Day Trading
PZ TRADING SLU
3.67 (3)
This indicator detects price reversals in a zig-zag fashion, using only price action analysis and a donchian channel. It has been specifically designed for short-term trading, without repainting or backpainting at all. It is a fantastic tool for shrewd traders aiming to increase the timing of their operations. [ Installation Guide | Update Guide | Troubleshooting | FAQ | All Products ] Amazingly easy to trade It provides value on every timeframe It provides suitable SL and TP levels It impl
Please send me Direct message on MQL5 CHAT after purchasing the Indicator for Training and Installation Support There are some additional files that is important to use with the Indicator . So be sure to contact me after purchasing the Indicator So that I can add you for training and support . If you find any difficulty with installation then send me Direct message here So that I can connect with you via Anydesk or Teamview for the product installation. " Smart Order Block Indicator " to find
Ferox Breakout
Tat Dat Nguyen
The breakout algorithm is a technique based on price, price features, to shape a breakout strategy. The strategy in this indicator will not be redrawn (none-repaint indicator), it is suitable for short or long term traders In the screenshot is the EURUSD pair, these currency pairs, commodities or stocks, it have similar strength *Non-Repainting (not redrawn) *For Metatrader4 Only *Great For Scalping *Great For Swing Trading *Arrow Entry, Green is Long, Red is Short *Works On Any Timeframe *Work
Indicator : RealValueIndicator Description : RealValueIndicator is a powerful tool designed specifically for trading on the EURUSD pair. This indicator analyzes all EUR and USD pairs, calculates their real currency strength values, and displays them as a single realistic value to give you a head start on price. This indicator will tell you moves before they happen if you use it right. RealValueIndicator allows you to get a quick and accurate overview of the EURUSD currency pair tops and bottoms,
Gann Signal
Kirill Borovskii
Gann Signal is a very simple indicator at first glance, but hidden inside is many years of experience in studying W.D.Ganna methods. The indicator gives accurate BUY/SELL signals, without redrawing. The indicator is very easy to use. All you need to do is attach it to your chart and follow its recommendations. The indicator constantly analyzes the market for entry opportunities. When such an opportunity appears, the indicator gives a signal in the form of an arrow. I repeat, all signals are NOT
Order Block Indicator MT4
Diego Arribas Lopez
5 (3)
[ MT5 Version ] Order Block Indicator MT4 Order Block Indicator MT4  is currently the most accurate and customizable indicator in the market. It has been developed to facilitate the analysis of operations based on Order Blocks and Supply and Demand Zones. These zones are possible reversal points of a movement. Order Blocks indicate a possible accumulation of orders in one area. The price usually gets to reach and react strongly to those areas. The most relevant levels for this reaction are the c
Introduction Excessive Momentum Indicator is the momentum indicator to measure the excessive momentum directly from raw price series. Hence, this is an extended price action and pattern trading. Excessive Momentum Indicator was originally developed by Young Ho Seo. This indicator demonstrates the concept of Equilibrium Fractal Wave and Practical Application at the same time. Excessive Momentum detects the market anomaly. Excessive momentum will give us a lot of clue about potential reversal and
System Trend Pro
Aleksandr Makarov
System Trend Pro - This is the best trend trading indicator!!! The indicator no repaint!!!   The indicator has   MTF   mode, which adds confidence to trading on the trend (   no repaint   ). How to trade? Everything is very simple, we wait for the first signal (big arrow), then wait for the second signal (small arrow) and enter the market in the direction of the arrow. (See screens 1 and 2.) Exit on the opposite signal or take 20-30 pips, close half of it, and keep the rest until the oppo
SMCpro VIP MT4  Original Price  $620   ---  Currently Price 20% OFF ( for unlimited use )   BONUS  AUX VIP Club 2024 : Include  EA Airbag  and  Load Data History  to enhance the performance of this tool to its maximum potential  Click Here to Download Files   ( for users only )   Hello World! Introducing.. SMCpro VIP tool and Indicator for MetaTrader 4, designed to revolutionize your trading experience with the ICT Smart Money Concept. This system is meticulously crafted to empower trad
Candle Power Pro
Thushara Dissanayake
4.33 (6)
Candle Power Pro   표시기로 실제 볼륨 정보의 힘을 잠금 해제하십시오. 이 동적 도구는 각 양초의 실제 볼륨 데이터를 캡처하여 총 볼륨의 백분율로 표시합니다. 그렇게 함으로써 시장에서 구매자와 판매자 사이의 지속적인 투쟁을 식별할 수 있습니다. Candle Power Pro는 구매자와 판매자 간의 전투를 총 볼륨의 비율로 표시하여 시장 역학에 대한 귀중한 통찰력을 제공합니다. 구매자와 판매자의 거래량을 분석하여 브레이크아웃을 쉽게 확인할 수 있어 보다 정확한 진입점과 퇴장점을 확보할 수 있습니다. 또한 구매자와 판매자의 거래량을 활용하여 추세를 확인할 수 있으므로 거래 전략의 신뢰성을 높일 수 있습니다. 또한 매수자와 매도자 수의 변화를 분석하여 추세 반전을 식별할 수 있으므로 시장 변화를 한발 앞서 나갈 수 있습니다. 이 표시기는 거래 경험을 향상시키는 다양한 기능을 제공합니다. 쉽게 시각화할 수 있도록 볼륨 평균을 선으로 그리고 추가 분석을 위해 볼륨 백분율을 19
Weis Wave with Alert
Trade The Volume Waves Single Member P.C.
4.79 (19)
Rental/Lifetime Package Options and Privileges' * For optimum results the yearly or lifetime package is suggested due to live training and Discord  channel trading with the  creator! Rent Monthly Six Months   Yearly/Lifetime Weis Wave with Speed with Alert+Speed Index x x x Manual  x x x Quick Set up Video x x x Blog x x x Lifetime Updates x x x Setup and Training Material x x Free Rectangle Break Alert Tool      x Discord Access Channel "The SI traders" x 2-hour live methodology traini
MartingaleArrow
Abdulkarim Karazon
Martingale Arrow는 martingale 바이너리 옵션 거래를 위해 설계된 화살표 유형 mt4 표시기입니다. 이 화살표는 바 열기/인트라 바에 인쇄되고 경고를 제공합니다. 사용 방법: 화살표가 나타나는 순간 거래를 개시하세요. 거래가 성공했다면 다음 신호를 기다렸다가 동일한 로트를 거래하세요. 다음 신호에서 거래가 두 배의 로트를 잃고 신호가 승리할 때까지 계속 그렇게 하는 경우 재설정하고 첫 번째 거래 로트로 거래하세요. 권장 기간: 모두 최소 보증금 : 200 단위. 이 표시기 라이브는 다음을 수행하지 않습니다: 다시 칠하기/뒤로 칠하기 ------------------------------------- ------------- 매개변수: 표시 기간: 변경 시 다른 신호를 제공합니다. 지표 가격/유형 과매수/과매도 수준 경고 입력 화살표 스타일 ==========================================
A. A2SR이란 무엇입니까 ?   * 선행 기술 지표입니다(재도장 없음, 지연 없음). -- 안내 : https://www.mql5.com/en/blogs/post/734748/page4#comment_16532516 -- 및 https://www.mql5.com/en/users/yohana/blog A2SR에는 지원(수요) 및 저항(공급) 수준을 결정하는 특별한 기술이 있습니다. 우리가 인터넷에서 본 일반적인 방식과 달리 A2SR은 실제 SR 수준을 결정하는 독창적인 개념을 가지고 있습니다. 원래 기술은 인터넷에서 가져온 것이 아니며 인터넷에 게시된 적도 없습니다. A2SR은 거래 스타일에 따라 SR 수준을 자동으로 선택합니다. 시간 프레임을 변경해도 SR 레벨은 그대로 유지됩니다. 사용하는 시간 프레임에서 실제 SR을 얻지 못하기 때문입니다. A2SR은 거래를 위한 완전한 상품을 보유하고 있습니다 . 실제 지원(수요) 및 저항(공급)에 대한 진정한 개념. 뉴스 이벤트
Full STO
Roman Smoroda
전체 STO 표시기 (프리미엄, 골드, 실버의 세 가지 STO 표시기의 모든 버전 포함)-안정적인 거래 옵션은 자동 바이너리 옵션 거래를 위해 설계되었습니다.  주의 깊게 읽기!!!!! 중요 하나의 터미널에서 만기가 다른 두 개의 템플릿, 즉 18:01, 18:02의 만기가 1 분에서 15 분인 템플릿과 10 분에서 20 분의 만기가 22:00 인 템플릿을 만듭니다. 승률: 지난 5년간 71% 자금 관리: 예치금에서 0.3 이 버전의 지표는 모스크바 시간 18:01, 18:02, 22:00 거래 전용으로 설정되며 실버 및 금의 경우 1에서 15까지, 프리미엄 버전의 경우 10에서 20 분까지 만료됩니다. 신호는 양초 내부에 나타나고 커넥터를 사용하면 양초 내부에 마크 개구부를 넣으면 즉시 거래를 시작합니다. 표시기가 완전히 구성되었으므로 직접 변경할 필요가 없습니다. 설치 및 거래 !!! 확인 및 테스트없이 지표를 구입하지 마십시오. 실제 계정에서
크리스마스 40% 할인! 1월 1일에 가격이 $250로 인상됩니다! GoldenGate Entries를 소개합니다: 혁신적인 트레이딩 솔루션! GoldenGate Entries (GGE)를 사용하여 거래하는 혁신적인 방법을 발견하세요. GGE는 귀하의 거래 경험을 향상시키기 위해 디자인된 고급 지표로, 사용자에게 정확성과 자신감을 부여하는 포괄적인 기능을 제공합니다. 페어: 아무거나 (FX - 상품 - 주식 - 주식 - 암호화폐) 타임프레임: 15분에서 H1까지 주요 기능: 매수 및 매도 화살표 표시: 팝업 알림과 함께 매수 및 매도 화살표 표시를 받아 언제나 정보를 확인할 수 있습니다. GoldenGate_Algo: 시장 상황에 대한 통찰력을 얻으려면 GoldenGate_Algo를 사용하세요. 시장이 '과매도'인지 '과매수'인지 평가하는 강력한 도구입니다. 현재 트렌드 분석: 현재 보고 있는 타임프레임에서 현재 트렌드에 액세스하여 거래를 주류 시장 방
Full Forex Market View Dashboard
Opengates Success International
5 (2)
전체 외환 시장 보기 대시보드 표시기 이것은 거래자에게 시장에서 일어나는 일에 대한 전체 보기를 제공하기 위해 만들어진 사용자 지정 지표입니다. 실시간 데이터를 사용하여 시장에 액세스하고 성공적인 거래에 필요한 모든 정보를 표시합니다. 설치: 이 지표를 창 차트에 첨부하기 전에 MT4의 Market Watch 패널로 이동하여 필요하지 않거나 거래하지 않는 모든 통화 쌍을 숨기고 나머지는 그대로 두십시오. 그 이유는 FFMV 대시보드가 MT4의 Market Watch에 나타나는 모든 통화 쌍을 표시하기 때문입니다. 최대 30개 이하의 통화 쌍을 표시할 수 있습니다. MT4의 Market Watch에서 그 이상이면 FFMV 대시보드의 글꼴과 이미지가 흐려지고 변형됩니다! 제대로 표시되지 않습니다. 용법:      솔로 트레이딩      바구니 거래의 경우(방법에 대한 스크린샷 참조)      다중 주문 거래에도 사용할 수 있습니다.      자신의 거래
제작자의 제품 더 보기
Ultimate Trailing Stop EA MT5
BLAKE STEVEN RODGER
4.57 (7)
This EA Utility allows you to manage (with advanced filtering) unlimited open orders (manual or EA) with 16 trailing stop methods: fixed, percent, ATR Exit, Chandelier Exit, Moving Average, Candle High Low Exit, Bollinger Bands, Parabolic, Envelope, Fractal, Ichimoku Kijun-Sen, Alligator, Exit After X Minutes or Bars, RSI and Stochastic. The trailing stop can be either real or virtual, and you can exit fully or with a partial close percent on touch or bar close.  Moreover, you can add (overri
Ultimate Trailing Stop EA
BLAKE STEVEN RODGER
4.33 (15)
This EA Utility allows you to manage (with advanced filtering) unlimited open orders (manual or EA) with 16 trailing stop methods: fixed, percent, ATR Exit, Chandelier Exit, Moving Average, Candle High Low Exit, Bollinger Bands, Parabolic, Envelope, Fractal, Ichimoku Kijun-Sen, Alligator, Exit After X Minutes or Bars, RSI and Stochastic. The trailing stop can be either real or virtual, and you can exit fully or with a partial close percent on touch or bar close.  Moreover, you can add (overr
Ultimate MT5 to Telegram (UMT) sends controlled trades (via symbol, magic, comment) to your telegram channel. It sends open and closed trades, including pending orders and TP/SL modifications, along with chart screenshots, to any telegram channel. Additionally, you can send trade reports of open trades and summary profit/pip reports for day, week, or month. You can customize the design of the trade actions or reports with variables and emoticons.  A beautiful panel allows you to visualize all
Ultimate Trade Copier MT5
BLAKE STEVEN RODGER
5 (2)
This trade copy utility allows you to instantly and seamlessly replicate and synchronize unlimited orders from multiple master accounts to multiple slave accounts on your local machine. You can create custom channels (or portfolios) with advanced filtering capabilities to copy from multiple master accounts to multiple slave accounts. Moreover, you can tailor these channels with a range of lot sizing and trade condition options to ensure that copied trades outperform the original source. You can
Ultimate Trade Copier
BLAKE STEVEN RODGER
5 (1)
This trade copy utility allows you to instantly and seamlessly replicate and synchronize unlimited orders from multiple master accounts to multiple slave accounts on your local machine. You can create custom channels (or portfolios) with advanced filtering capabilities to copy from multiple master accounts to multiple slave accounts. Moreover, you can tailor these channels with a range of lot sizing and trade condition options to ensure that copied trades outperform the original source. You can
Chandelier Exit MT5
BLAKE STEVEN RODGER
4 (1)
Developed by Chuck LeBeau, the Chandelier Exit indicator uses the highest high / lowest low -/+ a multiple of the ATR value to draw trailing stop lines (orange under buys, magenta over sells) that advance with the trend until the trend changes direction.The value of this trailing stop is that it rapidly moves upward in response to the market action. LeBeau chose the chandelier name because "just as a chandelier hangs down from the ceiling of a room, the chandelier exit hangs down from the high
FREE
ATR Exit MT5
BLAKE STEVEN RODGER
4.75 (4)
The ATR Exit indicator uses the candle close + ATR value to draw trailing stop lines (orange under buys, magenta over sells) that advance with the trend until the trend changes direction. It uses a multiple of the Average True Range (ATR), subtracting it’s value from the close on buy, adding its value to the close on sell. Moreover, the trailing stop lines are generated to support the order’s trend direction (long or short):  In an upward trend, the long trailing stop line (orange line under bu
FREE
Chandelier Exit
BLAKE STEVEN RODGER
4 (4)
Developed by Chuck LeBeau, the Chandelier Exit indicator uses the highest high / lowest low -/+ a multiple of the ATR value to draw trailing stop lines (orange under buys, magenta over sells) that advance with the trend until the trend changes direction.The value of this trailing stop is that it rapidly moves upward in response to the market action. LeBeau chose the chandelier name because "just as a chandelier hangs down from the ceiling of a room, the chandelier exit hangs down from the high
FREE
ATR Exit
BLAKE STEVEN RODGER
4.75 (8)
The ATR Exit indicator uses the candle close + ATR value to draw trailing stop lines (orange under buys, magenta over sells) that advance with the trend until the trend changes direction. It uses a multiple of the Average True Range (ATR), subtracting it’s value from the close on buy, adding its value to the close on sell. Moreover, the trailing stop lines are generated to support the order’s trend direction (long or short):  In an upward trend, the long trailing stop line (orange line under bu
FREE
Ultimate MT5 to Telegram Public Channel sends controlled trades (via symbol, magic, comment) to a public telegram channel. It sends open and closed trades, including pending orders and TP/SL modifications, along with chart screenshots, to this public telegram channel. Additionally, you can send trade reports of open trades and summary profit/pip reports for day, week, or month. You can customize the design of the trade actions or reports with variables and emoticons.  A beautiful panel allow
FREE
Visual Order Tracking EA
BLAKE STEVEN RODGER
5 (2)
The Visual Order Tracking (VOT) EA makes trade history and performance metrics visible on the chart in four ways: 1) Draw History of closed and open trades with arrows, lines and trade result numbers (pips, $ profit, % profit, % change); 2) Trade Manager to show Open, SL and TP levels as vivid horizontal lines with dynamic specs and partial closing options; 3)  Summary Trade Panel to show sortable table of open and closed trade summaries by symbol, lots, pips, profit and advanced stats; and 4) 
Ultimate Partial Profit EA
BLAKE STEVEN RODGER
4.67 (3)
This EA Utility delivers a robust solution for managing an unlimited array of open orders, both manual and automated. It enables customizable partial profit levels utilizing metrics such as pips, ratios, ATR (Average True Range), and profit amounts for precise trade management. The utility features an advanced on-screen display, offering clear visualization of all orders and their profit levels to enhance strategic decision-making and control. To evaluate its performance and interface, the EA s
Candle High Low Exit MT5
BLAKE STEVEN RODGER
5 (2)
The Candle High Low Exit indicator uses the highest high and the lowest low of a range to draw trailing stop lines (orange under buys, magenta over sells) that advance with the trend until the trend changes direction.  Moreover, the trailing stop lines are generated to support the order’s trend direction (long or short):  In an upward trend, the long trailing stop line (orange line under buy) appears and advances upward until the close crosses under the line.  In a downward trend, the short tra
FREE
Ultimate MT4 to Telegram Public Channel sends controlled trades (via symbol, magic, comment) to a public telegram channel. It sends open and closed trades, including pending orders and TP/SL modifications, along with chart screenshots, to this public telegram channel. Additionally, you can send trade reports of open trades and summary profit/pip reports for day, week, or month. You can customize the design of the trade actions or reports with variables and emoticons.  A beautiful panel allow
FREE
Candle High Low Exit
BLAKE STEVEN RODGER
5 (2)
The Candle High Low Exit indicator uses the highest high and the lowest low of a range to draw trailing stop lines (orange under buys, magenta over sells) that advance with the trend until the trend changes direction.  Moreover, the trailing stop lines are generated to support the order’s trend direction (long or short):  In an upward trend, the long trailing stop line (orange line under buy) appears and advances upward until the close crosses under the line.  In a downward trend, the short tra
FREE
Ultimate MT4 to Telegram (UMT) sends controlled trades (via symbol, magic, comment) to your telegram channel. It sends open and closed trades, including pending orders and TP/SL modifications, along with chart screenshots, to any telegram channel. Additionally, you can send trade reports of open trades and summary profit/pip reports for day, week, or month. You can customize the design of the trade actions or reports with variables and emoticons.  A beautiful panel allows you to visualize all
Visual Order Tracking Demo
BLAKE STEVEN RODGER
5 (1)
The Visual Order Tracking (VOT) indicator makes trade history and performance metrics visible on the chart in four ways: 1)   Draw History   of closed and open trades with arrows, lines and trade result numbers (pips, $ profit, % profit, % change); 2)   Trade Manager   to show Open, SL and TP levels as vivid horizontal lines with dynamic specs and partial closing options; 3)  Summary Trade Panel   to show sortable table of open and closed trade summaries by symbol, lots, pips, profit and advance
FREE
This EA Utility allows you to manage (with advanced filtering) unlimited open orders (manual or EA) with trailing stops based on 16 methods: fixed, percent, ATR Exit, Chandelier Exit, MA, Candle High Low Exit, Bollinger Bands, Parabolic, Envelope, Fractal, Ichimoku Kijun-San, Alligator, Exit after X Minutes or Bars, RSI and Stochastics . The trailing stop can be either real or virtual, and you can exit fully or with a partial close percent on touch or bar close. Visualize all orders and their tr
FREE
The Visual Order Tracking (VOT) EA makes trade history and performance metrics visible on the chart in four ways: 1)   Draw History   of closed and open trades with arrows, lines and trade result numbers (pips, $ profit, % profit, % change); 2)   Trade Manager   to show Open, SL and TP levels as vivid horizontal lines with dynamic specs and partial closing options; 3)  Summary Trade Panel   to show sortable table of open and closed trade summaries by symbol, lots, pips, profit and advanced stats
FREE
This EA Utility allows you to manage (with advanced filtering) unlimited open orders (manual or EA) with unlimited partial profit levels based on pips, ratio, ATR, and profit. Visualize all orders and their profit levels in a sophisticated on-screen display.   Free version works on AUDJPY, USDJPY, USDCAD, NZDUSD. Full version can be found here .   Note: EA can be  run with the visual backtester to simulate trading to see how it looks and feels before purchase or for testing trade ideas.  Join
FREE
EA Schedule Launcher Demo
BLAKE STEVEN RODGER
5 (1)
It may be true that “Time waits for no one [human],” but at least now you can control the marching time of all your robots. EA Schedule Launcher (ESL) can launch and close any number of your EAs and/or indicators at custom beginning and ending times. You save your EA and/or indicator to a template and input when to open and close them. The power to control your EAs trading time window can improve both strategy performance and terminal/computer performance. Note: Limited to 5 templates. Purcha
FREE
Visual Order Tracking
BLAKE STEVEN RODGER
5 (2)
The Visual Order Tracking (VOT) indicator makes trade history and performance metrics visible on the chart in three ways: 1) Draw History of closed and open trades with arrows, lines and trade result numbers (pips, $ profit, % profit, % change); 2) Summary Trade Panel to show open and closed trade summaries by symbol, lots, pips, profit and advanced stats; and 3)  Open Trades Panel to show open trades by Symbol Ticket, Type, Lots, Profit, pips, SL pips, StopLoss, TakeProfit, Spread, Magic, Comme
EA Schedule Launcher
BLAKE STEVEN RODGER
5 (1)
It may be true that “Time waits for no one [human],” but at least now you can control the marching time of all your robots. EA Schedule Launcher (ESL) can launch and close any number of your EAs and/or indicators at custom beginning and ending times. You save your EA and/or indicator to a template and input when to open and close them. The power to control your EAs trading time window can improve both strategy performance and terminal/computer performance. Note: EA cannot be run with the visu
Promo price: $199 for the first 5 buyers.  Kana Trend EA is a short term, always-in-market trend trading system that shows great results on multiple symbols.  You can place this EA on any instrument without worry about missing out on a trend, for if there is one, it is bound to get it. It is always-in-market, trending and reversing into new trends, on small timeframes like H1, a difficult to accomplish feat in a noisy environment. You can place this EA on your account without worry about
It may be true that “Time waits for no one [human],” but at least now you can control the marching time of all your robots. EA Schedule Launcher (ESL) can launch and close any number of your EAs and/or indicators at custom beginning and ending times. You save your EA and/or indicator to a template and input when to open and close them. The power to control your EAs trading time window can improve both strategy performance and terminal/computer performance. Note: EA cannot be run with the visu
필터:
리뷰 없음
리뷰 답변