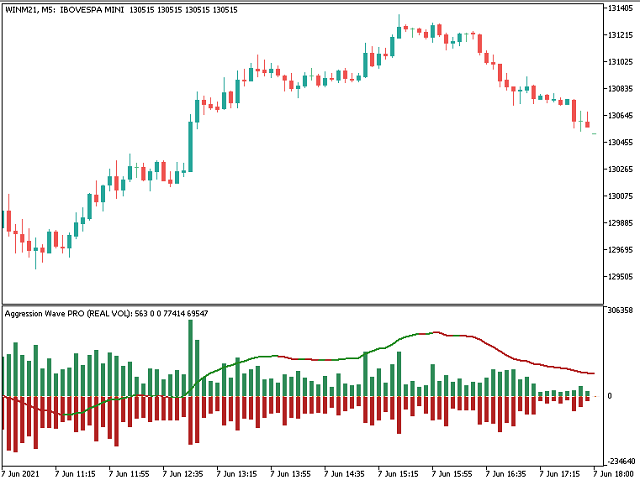
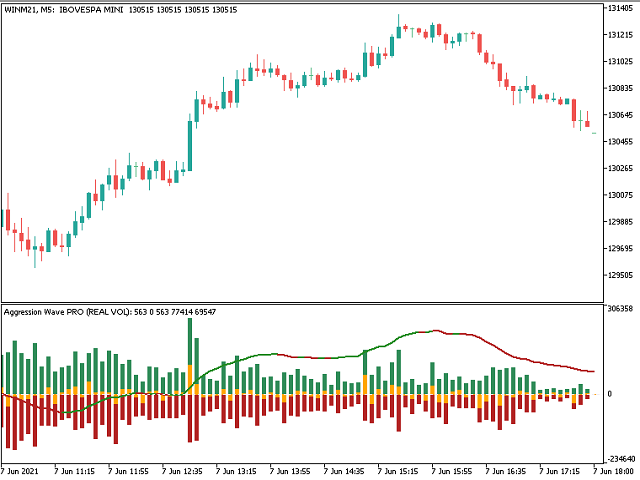
• 미리보기
  • 리뷰 (4)
  • 코멘트 (21)

Aggression Wave PRO

Aggression Wave PRO is an indicator developed to monitor the divergence, strength, and continuity of the aggression volume of sell and buy negotiations. 

The Agrression Wave PRO has features that allow you to view beyond the accumulated delta volume of the day.


Note: This indicator DOES NOT WORK for Brokers and/or Markets WITHOUT the type of aggression (BUY or SELL). Cryptocurrencies and Forex do not provide this type of information, that is, it does not work with it.


Operation

  1. It is possible to set the Volume Type:
    • Real Volume (in this mode, the volumes traded in each asset transaction will be accounted)
    • Ticks Volume (in this mode, the number of transactions of the asset will be counted.)

  2. It is possible to define the starting time of the calculations:
    • CURRENT_DAY
    • LAST_DAY
    • LAST_TWODAYS
    • LAST_FOURDAYS
    • LAST_WEEK
    • LAST_MONTH
    • LAST_6MONTHS
    • LAST_YEAR
    • LAST_2YEARS
    • ALL_AVAILABLE_DAYS

  3. It is possible to configure the Signal line:
    • Method: SMA / EMA / SMMA / LWMA 
    • Period

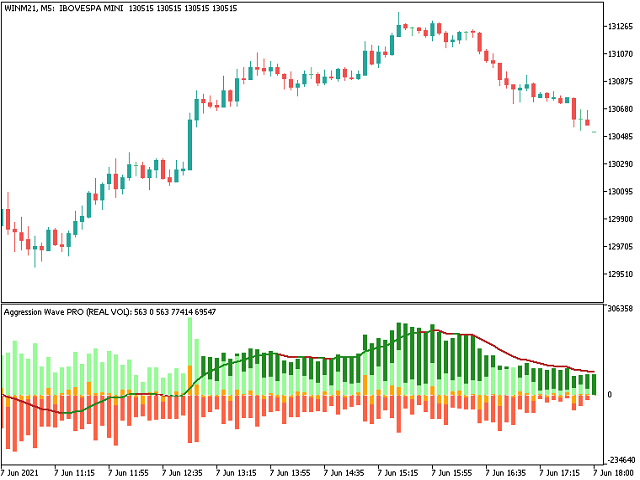
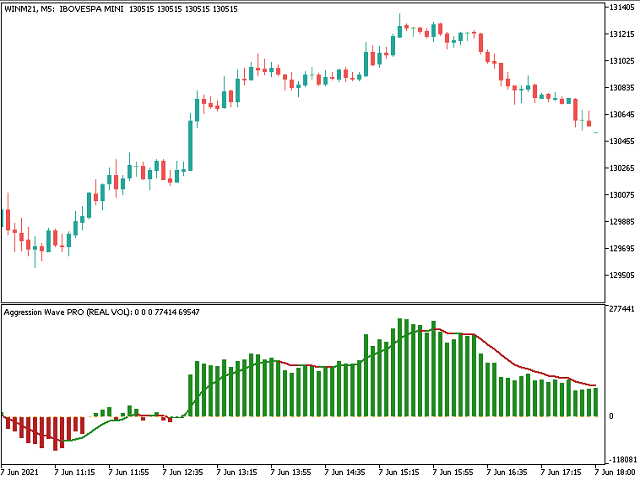
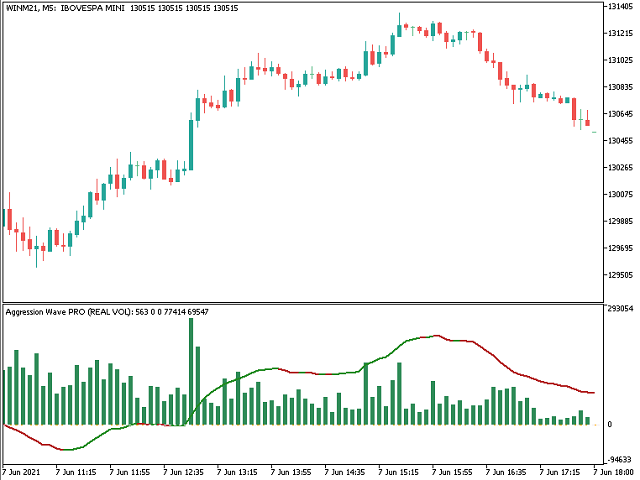
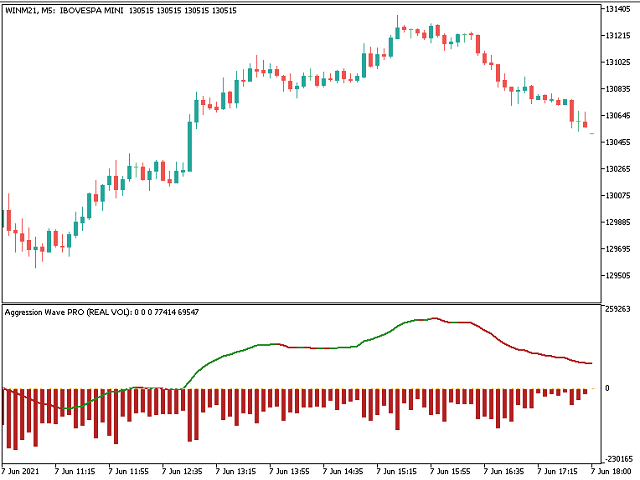
  4. It has 8 viewing modes:
    • PLOT_ALL : Plot all available information
    • PLOT_WAVE_AGGRESSION : Plots the accumulated of the Delta + the signal line of the accumulated
    • PLOT_WAVE_DELTA_AGGRESSION : Plots the accumulated of the Delta + the signal line of the accumulated + Delta
    • PLOT_BUY_AGGRESSION : Plot Buy Aggression + the signal line of the accumulated
    • PLOT_SELL_AGGRESSION :  Plot Sell Aggression + the signal line of the accumulated
    • PLOT_DELTA_AGGRESSION : Plot Delta + the signal line of the accumulated
    • PLOT_BUY_SELL_AGGRESSION :  Plot Buy Aggression  +  Sell Aggression +  the signal line of the accumulated
    • PLOT_BUY_SELL_DELTA_AGGRESSION :  Plot Buy Aggression  +  Sell Aggression + Delta +  the signal line of the accumulated

  5. It has 7 configurable alerts:
    • Aggression crosses Signal Line
    • Aggression crosses Level Zero
    • Aggression change TREND Color
    • Signal Line crosses Level Zero
    • Signal Line change TREND Color
    • Delta crosses Level Zero
    • Delta crosses Configurable Level

    • For each alert it is possible to configure:
      • Popup
      • Sound(There are 13 types of sound available.)
      • Smartphone notification
      • Popup and  Sound
      • Popup and Smartphone notification
      • Sound and Smartphone notification
      • Popup, Sound and Smartphone notification


Integration with Expert Advisors or other Indicators

  • There are 12 buffers available for access and integration with expert advisors or other indicators, the buffers of aletrs are filled even with the alerts turned off, they are
    • Buffer ID 8: Buy Aggression Value
    • Buffer ID 13: Sell Aggression Value
    • Buffer ID 18: Delta Aggression Value
    • Buffer ID 20: Signal Line Value
    • Buffer ID 22: Aggression Accumulated Value
    • Buffer ID 23: Alert 1
    • Buffer ID 24: Alert 2
    • Buffer ID 25: Alert 3
    • Buffer ID 26: Alert 4
    • Buffer ID 27: Alert 5
    • Buffer ID 28: Alert 6
    • Buffer ID 29: Alert 7

  • The Buffers referring to the 7 Alerts can contain the following values:
    • Downtrend: (-1)
    • Undefined trend: (0)
    • Uptrend: (+1)

If you still have questions, please contact me by direct message: https://www.mql5.com/en/users/robsjunqueira/


추천 제품
Rocket Trend
Andriy Sydoruk
The Rocket Trend indicator is trending. The indicator draws two-color points connected by lines along the chart. This is a trend indicator, it is an algorithmic indicator. It is easy to work and understand when a blue circle appears, you need to buy, when a red one appears, sell. The indicator is used for scalping and pipsing, and has proven itself well. Rocket Trend is available for analyzing the direction of the trend for a specific period of time. Ideal for novice traders learning the laws o
This Indicator help you to identify trends and patterns. It shows the short-term, medium-term and long-term trend at the same time on the screen. It supports every timeframe except monthly. This indicator NOT implement the ZigZag indicator, but it uses its own algorithm. Supported markets: -         Forex -         Metal -         Energies Spot -         in Energies Futures only o    US Crude Oils -         in Indices Spot only o    US Tech 100 Index o    UK 100 Index o    US Wall Street 30 I
Andrews Trend Side MT5
Andrew Fedotov
3 (2)
추세 측면 - 추세를 결정하기 위한 기술적 지표입니다. 그것은 몇 가지 본격적인 거래 전략의 집합입니다. 표시기는 고급 추세 필터링 시스템을 사용하고 통계 패널이 있으며 진입 및 퇴장 수준을 계산하고 동적 후행 정지 수준을 계산합니다. 모든 유형의 기호에 적합하며 신호와 결과를 다시 그리지 않습니다. 전문적인 추세 거래를 위한 포괄적인 도구입니다. Trend Side 지표 세트에는 다중 통화 및 다중 시간대 추세 스캐너인 Andrews Trend Scanner, 통화 강도 분석기, 가능한 반전을 분석하는 다중 시간대 추세 분석기도 포함됩니다. 하나의 제품에 세 가지 추세 분석기가 내장되어 있습니다. 표시기를 구입한 후 무료 Andrews Trend Scanner 표시기 키트를 받으려면 저에게 연락하십시오. 표시기 및 모든 추가 패널은 전체 지침에 자세히 설명되어 있습니다. 이 매뉴얼은 또한 지표, 모든 입력 변수 및 신호 필터링을 통한 거래 전략에 대해 자세히 설명합니다.  
Ugenesys AI MT5
Odaine Ramon Mcmillan
uGenesys AI - 90% Accurate Daytrading Indicator Introducing the ultimate forex trading indicator system, uGenesys AI, powered by cutting-edge AI technology and advanced analytical techniques, including Time-Series Analysis and Genetic Algorithms. Our AI-powered trading system leverages the power of time-series analysis to identify trends and patterns in historical price data, allowing traders to make informed predictions about future market movements. By analyzing vast amounts of data, our sys
Mega Indicator MT5
Szymon Palczynski
Price reach indicator. It also serves as the perfect term for supports and resistance. I use it in two experts. The basic tool for professional trading. The indicator analyzes the last 500 bar and uses this to determine the levels ( but it doesn't predict the future ) . Personally, I use it on TF H1.  It is very simple. Four lines on chart and that's all. Only two input parameters.  Thousands of indicators. Why this? Is good ? No! Is very good. Please test the indicator prior to purchasing. You
Upgraded - Stars added to indentify Areas you can scale in to compound on your entry  when buying or selling version 2.4 Upgraded Notifications and alerts added version 2.3 *The indicator is suitable for all pairs fromm  Deriv pairs (Vix,jump,boom & crash indices) , Currencies, cryptos , stocks(USA100, USA30 ), and metals like gold etc. How does it work? Increasing the period make it more stable hence will only focus on important entry points However  lowering the period will mean the indica
Supply Demand Ranger
Krzysztof Janusz Stankiewic
5 (2)
The indicator draws supply and demand zones. The zone timeframe can be set independently of the chart timeframe. For instance, it is possible to set M5 zones on an H4 chart. The importance of zones can be adjusted using the zone strength parameter. Demand zones are displayed if at least one candle in the range of the zone is entirely above the zone. Similarly, supply zones are displayed if at least one candle within the zone is entirely below the zone.
이 표시기는 거래자의 요구 사항에 따라 차트를 더 깔끔하게 만들기 위해 활성화/비활성화할 수 있는 최대 6개 레벨을 표시합니다. 이 6단계는 높음과 낮음의 2세트로 구성되어 있습니다. 각 세트에 대해 다른 시간대를 선택할 수 있습니다. 가격이 일일, 주간 또는 월간 고가에 도달할 때 일반적으로 5분과 같은 더 작은 시간 프레임에서 거부를 나타내는 것으로 간주되므로 이전 고가 반전 전략을 기반으로 합니다. 특징 : - 단일 차트에서 최대 6개의 시간대 고저를 추적합니다. - 이 수준, 메일, 푸시 또는 터미널 알림에 대한 알림을 설정합니다. 가격이 이러한 수준에 도달하면 즉시 알림을 받게 됩니다. - 선 스타일, 너비, 색상 등을 포함한 레벨 스타일 사용자 정의 - Shift : 2일차 또는 3일차의 High Low를 추적하거나 조사하고 싶으십니까? 두 번째 막대의 높음 낮음에 대해 2로, 세 번째 막대의 높음 낮음에 대해 3으로 이동을 설정할 수 있습니
First trend PRO
Evgeny Raspaev
Трендовый индикатор который подойдет как для новичка, так и для профессионального трейдера. Алгоритм индикатора отфильтровывает незначительные колебания цены при этом выделяет основные трендовые движения.  First trend PRO подойдет для неопытных трейдеров. Индикатор показывает точки входа и текущее направление движения цены. Благодаря этому вы всегда будите в курсе текущего положения дел на рынке.  Преимущества First trend PRO : First trend PRO подходит для всех символов Meta Trader 5: валют, мет
Price action is among the most popular trading concepts. A trader who knows how to use price action the right way can often improve his performance and his way of looking at charts significantly. However, there are still a lot of misunderstandings and half-truths circulating that confuse traders and set them up for failure. Using PA Trend Reversal will be possible to identify high probability exhaustion moves of a trend. Features The indicator gives alerts in real-time when the conditions are me
Bu indikatör Deriv firmasındaki Boom ve Crash çiftlerinde spike hareketlerini tespit etmek ve işleme girmek için kullanılır. Kullanılan çiftler Boom300, Boom500, Boom1000, Crash300, Crash500, Crash1000. İndikatör, beklenen yönde ok işareti verdiği zaman işleme girilir ve indikatörün gösterdiği destek/direnç bölgelerine Stop Loss koyulmalıdır. İndikatör yeniden boyama(repaint) yapmaz. Trend takibi için değil, spike yönünde işleme girmek için kullanılır. Tavisye edilen; sadece spike yönünde işlem
평면 및 추세를 결정하기 위한 표시기. 가격이 2개의 히스토그램과 2개의 선(빨간색 및 파란색) 중 하나보다 낮으면 판매 영역입니다. 이 버전의 표시기를 구매할 때 하나의 실제 계정과 하나의 데모 계정에 대한 MT4 버전 - 선물로(수신하려면 개인 메시지를 작성하세요)! 가격이 2개의 히스토그램과 2개의 선(빨간색 및 파란색) 중 하나보다 높으면 구매 영역입니다. MT4 버전: https://www.mql5.com/en/market/product/3793 가격이 두 라인 사이 또는 히스토그램 영역에 있으면 시장에 명확한 추세가 없습니다. 간단히 말해서 시장은 평평합니다. 표시기의 작업은 스크린샷에 더 명확하게 표시됩니다. 지표는 선행 데이터를 얻는 데 사용할 수 있습니다. 또는 현재 추세의 상태를 확인합니다.
Swing Point Volume
Thalles Nascimento De Carvalho
Swing Point Volume, the indicator that signals weakness and strength at the tops and bottoms. This indicador can be for used the Wyckoff Method. Information provided; - Swing on customized ticks. - Volume and points in each balance sheet. - Percentage of Displacement. - Sound alert option on top and bottom breaks. - Volume in ticks and Real Volume. - Volume HL (extreme) or (opening and closing) - Customized volume shapes.
TrendDetect
Pavel Gotkevitch
The Trend Detect indicator combines the features of both trend indicators and oscillators. This indicator is a convenient tool for detecting short-term market cycles and identifying overbought and oversold levels. A long position can be opened when the indicator starts leaving the oversold area and breaks the zero level from below. A short position can be opened when the indicator starts leaving the overbought area and breaks the zero level from above. An opposite signal of the indicator can
KT CCI Alerts MT5
KEENBASE SOFTWARE SOLUTIONS
KT CCI Alerts is a personal implementation of the Commodity Channel Index (CCI) oscillator that provide signals and alerts on four custom events: When CCI enter in an overbought zone. When CCI exit from an overbought zone. When CCI enter in an oversold zone. When CCI exit from an oversold zone. Features A perfect choice for traders who speculate the CCI movements within an overbought/oversold zone. Lightly coded without using extensive memory and resources. It implements all Metatrader alerts
Your Trend Friend
Luigi Nunes Labigalini
The trend is your friend! Look at the color of the indicator and trade on that direction. It does not  repaint. After each candle is closed, that's the color of the trend. You can focus on shorter faster trends or major trends, just test what's most suitable for the symbol and timeframe you trade. Simply change the "Length" parameter and the indicator will automatically adapt. You can also change the color, thickness and style of the lines. Download and give it a try! There are big movements
Enhance your trading strategy and optimize your market entries with the Power MA Rectifier Indicator, now available for sale on the MetaTrader 5 (MT5) Market platform. This innovative indicator combines the power of Moving Averages (MA) with a rectification algorithm, providing traders with valuable insights to make informed trading decisions. Key Features: Moving Averages Integration : The Power MA Rectifier Indicator leverages Moving Averages to analyze market trends, helping traders identify
Based on the trading model/strategy/system of gold double-position hedging and arbitrage launched by Goodtrade Brokers, problems encountered in daily operations: 1. Account B immediately places an order immediately following account A. 2: After account A places an order, account B will automatically copy the stop loss and take profit. 3: Account A closes the position of Account B and closes the position at the same time. 4: When account B closes the position, account A also closes the position.
This indicator builds upon the previously posted Nadaraya-Watson smoothers. Here we have created an envelope indicator based on Kernel Smoothing with integrated alerts from crosses between the price and envelope extremities. Unlike the Nadaraya-Watson estimator, this indicator follows a contrarian methodology. Please note that by default this indicator can be subject to repainting. Users can use a non-repainting smoothing method available from the settings. The triangle labels are designed
Owl Smart Levels MT5
Sergey Ermolov
4.47 (36)
MT4 버전  |  FAQ Owl Smart Levels Indicator 는 Bill Williams 의 고급 프랙탈, 시장의 올바른 파동 구조를 구축하는 Valable ZigZag, 정확한 진입 수준을 표시하는 피보나치 수준과 같은 인기 있는 시장 분석 도구를 포함하는 하나의 지표 내에서 완전한 거래 시스템입니다. 시장과 이익을 취하는 장소로. 전략에 대한 자세한 설명 표시기 작업에 대한 지침 고문-거래 올빼미 도우미의 조수 개인 사용자 채팅 ->구입 후 나에게 쓰기,나는 개인 채팅에 당신을 추가하고 거기에 모든 보너스를 다운로드 할 수 있습니다 힘은 단순함에 있습니다! Owl Smart Levels 거래 시스템은 사용하기 매우 쉽기 때문에 전문가와 이제 막 시장을 연구하고 스스로 거래 전략을 선택하기 시작한 사람들 모두에게 적합합니다. 전략 및 지표에는 눈에 보이지 않는 비밀 공식 및 계산 방법이 없으며 모든 전략 지표는 공개되어 있습니다. Owl Smart Levels를
Simple and fast MACD oscillator with MACD and signal lines and two-color histogram. I wasn't happy with the Meta Trader MACD oscillator as it's not immediate to read and the other ones I tried felt a bit laggy or added unneeded features on top, so I decide to make one that feels familiar to me. I hope you will find it useful! Contact me for any issues or bugs and I will try to help the best I can.
This indicator contains Pivot Levels of: Traditional Fibonacci Woodie Classic Demark Camarilla  Calculation periods can be set to auto / Daily / Weekly / Monthly / Yearly.  Number of Levels are editable.  Options to hide level labels and price labels.  Pivots Points are price levels chartists can use to determine intraday support and resistance levels. Pivot Points use the previous days Open, High, and Low to calculate a Pivot Point for the current day. Using this Pivot Point as the base, three
대칭 삼각형, 비대칭 삼각형 또는 직각 삼각형과 같은 삼각형 패턴, 상승 쐐기 또는 하강 쐐기와 같은 쐐기 패턴, 확장 패턴 및 추세 채널에 대한 패턴 탐색기 이 지표는 과거의 패턴과 현재의 패턴을 탐색하며, 수동으로 추세선이나 삼각형을 그려 시간을 절약하고 차트에 가장 좋은 패턴을 그리는 자동 분석에 사용하려는 사람들에게 가장 적합한 지표입니다. 특징 : - 최적의 패턴을 조정하고 찾기 위해 즉시 ZigZag 확장 깊이를 변경하는 패널 - 패턴을 지그재그의 이전 막대로 다시 이동하여 과거에 발생한 일을 탐색하고 추세선이 존중되는지 여부를 탐색하고 가격 동작을 이해할 수 있습니다. 이 지표를 사용하여 이전의 과거 패턴을 탐색하고 분석하고 학습하여 마스터 전략을 도출합니다. - 전환 버튼에서 추세 채널 또는 추세선에서 쐐기 또는 삼각형 모드로 즉시 전환 - 패턴이 변경되지 않도록 일시 중지하고 경고에 대한 가격 터치를 계속 확인합니다. - 레벨 터치에 대
Make Your Own Index
Biswarup Banerjee
Creating an Index: Importance, Customization, and Weighting Options for MT5 Trading Indicator Designing your index is crucial for efficient symbol tracking in the world of trading. With a powerful MT5 trading indicator, you gain the flexibility to construct an index that suits your preferences, whether it's an equal weighted or custom weighted one. Unlike widely-known indexes like the S&P 500, which heavily favor certain winners, this indicator empowers you to curate a basket of symbols and assi
Breakout Lines MT5
Carl Gustav Johan Ekstrom
Technical Analysis is a roadmap that allows you to see where you have been and where you are going. Martin Armstrong's  Breakout Lines  introduces an unconventional form of technical analysis to your charts, crafted to capture the market's trajectory and swift accelerations or declines. The sharper the angle of the breakout line, the stronger the inclination for the market to swiftly rally or decline in that direction. The breakout line denotes the cyclical boundaries of price, a critical press
Cycles Forecast
Pooriya Alirezaee
This indicator is based on a mathematical formula and an ANN combined, designed to make a model(using previous prices) of the most recent market condition (any chart*) in order to use the model as a forecasting tool. *This indicator can operate on any chart/timeframe, but it's suggested you use multiple timeframes for each trade because this method relies solely on the time factor, you can not use this indicator to predict price volatility, but if it's fit correctly it will show you when the nex
WanaScalper
Isaac Wanasolo
1 (1)
A scalping indicator based on mathematical patterns, which on average gives signals with relatively small SL, and also occasionally helps to catch big moves in the markets (more information in the video) This indicator has three main types of notifications: The first type warns of a possible/upcoming signal on the next bar The second type indicates the presence of a ready signal to enter the market/open a position The third type is for SL and TP levels - you will be notified every time price r
My Trendline
Ashok Kumar Singha
My Trendline is an Indicator based on Upper and Lower Trendline which will Plot Automatically into the Chart. This Indicator will perfectly indicate you the Trend of the Market. It can be use in any Time Frame. The Indicator will automatically adjust according to the Current Time Frame. Steps to Setup the Indicator: Install the Custom Indicator; Set all the Inputs, Line Color, Width and Styles etc. (Can use the Default Setting also); Set visualization to All Timeframe; and DONE It ca
I recommend you to read the  product's blog  (manual) from start to end so that it is clear from the beginning what the indicator offers. This multi time frame and multi symbol supply and demand zone dashboard indicator sends alerts when the price has reached a supply/demand zone. It is also possible to use it to be alerted about regular double tops/bottoms instead of zones. It can be used with all time frames from M1 to MN. Maximum 9 time frames can be shown in the dashboard at the same time. 
Price DNA MT5
Ruben Octavio Gonzalez Aviles
Price DNA는 복합비율 가중이동평균을 사용해 시차를 줄이고 추세를 조기에 감지할 수 있는 추세 지표입니다. 이 지표는 다시 칠하지 않으며 모든 기간의 모든 금융상품에 적용할 수 있습니다. Price DNA는 어떻게 작동하나요? 표시기는 차트에 현재 거래의 방향을 나타내는 여러 개의 파동을 표시합니다. 녹색 또는 빨간색 파동 5개는 각각 강한 강세 또는 약세 추세를 나타냅니다. 개별 트레이딩 스타일에 따라 모든 파동 또는 특정 수의 파동이 추세 반전을 나타낼 때 포지션을 개시 또는 청산하도록 선택할 수 있습니다. 상승 및 하락 파동 수는 항상 단말기 왼쪽 상단에 표시됩니다. 설정 각 개별 DNA 파동의 주기를 조정하여 더 공격적이거나 더 신중한 트레이딩 스타일에 맞게 가격 DNA 인디케이터를 조정할 수 있습니다. 웨이브 1 기간: 첫 번째 웨이브의 기간 웨이브 2 기간: 두 번째 물결의 기간 제3파 기간: 세 번째 물결의 기간 제4파 기간: 네 번째 물결의 기간 제5파 기
이 제품의 구매자들이 또한 구매함
Atomic Analyst MT5
Issam Kassas
3.64 (11)
우선적으로 언급할 점은이 거래 지표가 다시 그리지 않고 지연되지 않으며 이를 통해 수동 및 로봇 거래 모두에 이상적이라는 점입니다. Atomic Analyst는 가격의 강도와 모멘텀을 활용하여 시장에서 더 나은 이점을 찾는 PA Price Action Indicator입니다. 고급 필터를 장착하여 잡음과 거짓 신호를 제거하고 거래 잠재력을 높이는 데 도움이 됩니다. 복잡한 지표의 다중 레이어를 사용하여 Atomic Analyst는 차트를 스캔하고 복잡한 수학적 계산을 간단한 신호와 색상으로 변환하여 초보 트레이더가 이해하고 일관된 거래 결정을 내릴 수 있도록합니다. "Atomic Analyst"는 새로운 및 경험이 풍부한 트레이더를위한 종합적인 거래 솔루션입니다. 프리미엄 지표와 최고 수준의 기능을 하나의 거래 전략에 결합하여 모든 종류의 트레이더에 대한 다재다능한 선택지가되었습니다. 인트라데이 거래 및 스캘핑 전략 : 빠르고 정확한 일일 거래 및 단기 거래를 위해 설계
우선 이 거래 시스템이 리페인팅, 리드로잉 및 레이그 인디케이터가 아니라는 점을 강조하는 것이 중요합니다. 이는 수동 및 로봇 거래 모두에 이상적인 것으로 만듭니다. "스마트 트렌드 트레이딩 시스템 MT5"은 새로운 및 경험이 풍부한 트레이더를 위해 맞춤형으로 제작된 종합적인 거래 솔루션입니다. 10개 이상의 프리미엄 인디케이터를 결합하고 7개 이상의 견고한 거래 전략을 특징으로 하여 다양한 시장 조건에 대한 다목적 선택이 가능합니다. 트렌드 추종 전략: 효과적인 트렌드 추이를 타기 위한 정확한 진입 및 손절 관리를 제공합니다. 반전 전략: 잠재적인 트렌드 반전을 식별하여 트레이더가 범위 시장을 활용할 수 있게 합니다. 스캘핑 전략: 빠르고 정확한 데이 트레이딩 및 단기 거래를 위해 설계되었습니다. 안정성: 모든 인디케이터가 리페인팅, 리드로잉 및 레이그가 아니므로 신뢰할 수 있는 신호를 보장합니다. 맞춤화: 개별 거래 선호도를 고려한 맞춤형 전략을 지원합니다. 최상의 전략을 찾는
Quantum Trend Sniper
Bogdan Ion Puscasu
5 (37)
소개       Quantum Trend Sniper Indicator는   추세 반전을 식별하고 거래하는 방식을 변화시키는 획기적인 MQL5 지표입니다! 13년 이상의 거래 경험을 가진 숙련된 트레이더 팀이 개발한       Quantum Trend Sniper 표시기       매우 높은 정확도로 추세 반전을 식별하는 혁신적인 방법으로 거래 여정을 새로운 차원으로 끌어올리도록 설계되었습니다. ***Quantum Trend Sniper Indicator를 구입하면 Quantum Breakout Indicator를 무료로 받을 수 있습니다!*** Quantum Trend Sniper Indicator는 추세 반전을 식별하고 세 가지 이익실현 수준을 제안할 때 경고, 신호 화살표를 제공합니다. 초보자 거래자와 전문 거래자 모두에게 적합합니다. Quantum EA 채널:       여기를 클릭하세요 MT4 버전:       여기를 클릭하세요
FX Volume MT5
Daniel Stein
4.94 (17)
모닝 브리핑을 통해 세부 정보와 스크린샷으로 매일 시장 업데이트를 받으세요 여기 mql5 및 텔레그램에서 FX 거래량은 브로커의 관점에서 시장 심리에 대한 실제 통찰력을 제공하는 최초이자 유일한 거래량 지표입니다. 브로커와 같은 기관 시장 참여자가 외환 시장에서 어떤 포지션을 취하고 있는지에 대한 훌륭한 통찰력을 COT 보고서보다 훨씬 빠르게 제공합니다. 차트에서 이 정보를 직접 확인하는 것은 트레이딩의 진정한 판도를 바꾸고 획기적인 솔루션입니다. 다음과 같은 고유한 시장 데이터 인사이트의 이점 비율 는 통화의 매수/매도 포지션 비율을 백분율로 표시 비율 변화 는 선택한 기간 내 매수 비율과 비율 변화를 표시 총 거래량 는 해당 통화의 총 거래량(롱 및 숏)을 로트 단위로 보여줍니다 Volumes Long 는 해당 통화의 모든 롱 포지션의 거래량을 보여줍니다 Volumes Short 는 해당 통화의 모든 숏 포지션의 거래량을 보여줍니다 Net Long 는 순 롱 포지션의 거래량
RelicusRoad Pro MT5
Relicus LLC
4.81 (21)
이제 $ 147 (몇 가지 업데이트 후 $ 499 증가) - 무제한 계정 (PCS 또는 MACS) RelicusRoad 사용 설명서 + 교육 비디오 + 비공개 Discord 그룹 액세스 + VIP 상태 시장을 보는 새로운 방법 RelicusRoad는 외환, 선물, 암호화폐, 주식 및 지수에 대한 세계에서 가장 강력한 거래 지표로서 거래자에게 수익성을 유지하는 데 필요한 모든 정보와 도구를 제공합니다. 우리는 초보자부터 고급까지 모든 거래자가 성공할 수 있도록 기술적 분석 및 거래 계획을 제공합니다. 미래 시장을 예측할 수 있는 충분한 정보를 제공하는 핵심 거래 지표입니다. 우리는 차트에서 말이 안 되는 여러 지표 대신 완전한 솔루션을 믿습니다. 타의 추종을 불허하는 매우 정확한 신호, 화살표 + 가격 조치 정보를 표시하는 올인원 표시기입니다. 강력한 AI를 기반으로 하는 RelicusRoad는 누락된 정보와 도구를 제공하여 교육하고 성공적인 트레이더인 트레이딩 전문
FX Power MT5 NG
Daniel Stein
5 (4)
모닝 브리핑 여기 mql5 와 텔레그램에서 FX Power MT5 NG 는 오랫동안 인기 있는 통화 강도 측정기인 FX Power의 차세대 버전입니다. 이 차세대 강도 측정기는 무엇을 제공합니까? 기존 FX Power에서 좋아했던 모든 것 PLUS GOLD/XAU 강도 분석 더욱 정밀한 계산 결과 개별 구성 가능한 분석 기간 더 나은 성능을 위한 사용자 정의 가능한 계산 한도 특별 멀티더 많은 것을보고 싶은 사람들을위한 특별한 다중 인스턴스 설정 모든 차트에서 좋아하는 색상을위한 끝없는 그래픽 설정 수많은 알림 옵션, 중요한 것을 다시는 놓치지 않도록 Windows 11 및 macOS 스타일의 둥근 모서리가 있는 새로운 디자인 마법처럼 움직이는 인디케이터 패널 FX 파워 키 특징 모든 주요 통화의 완전한 강세 이력 모든 시간대에 걸친 통화 강세 이력 모든 브로커 및 차트에서 고유 계산 결과 100% 신뢰할 수있는 실시간100 % 신뢰할 수있는 실시간 계산-> 다시 칠하지 않음
Advanced Supply Demand MT5
Bernhard Schweigert
4.53 (15)
현재 33% 할인! 초보자나 전문 트레이더를 위한 최고의 솔루션! 이 보조지표는 우리가 다수의 독창적 기능과 새로운 공식을 통합한 독특하고 고품질이며 저렴한 거래 도구입니다. 이 업데이트를 통해 이중 시간대를 표시할 수 있습니다. 더 높은 TF를 표시할 수 있을 뿐만 아니라 차트 TF와 더 높은 TF 모두를 표시할 수 있습니다: 중첩 영역 표시. 모든 Supply Demand 트레이더들이 좋아할 것입니다. :) 중요한 정보 공개 Advanced Supply Demand의 잠재력을 극대화하려면 다음을 방문하십시오. https://www.mql5.com/ko/blogs/post/720245   진입 또는 목표의 명확한 트리거 포인트를 정확히 찾아냄으로 해서 거래가 어떻게 개선될지 상상해 보십시오. 새로운 알고리즘을 기반으로 매수자와 매도자 간의 잠재적인 불균형을 훨씬 더 쉽게 분간할 수 있습니다. 왜냐하면 가장 강한 공급영역과 가장 강한 수요 영역과 과거에 어떻게 진행 되었는지를(이
우선적으로, 이 거래 도구는 전문적인 거래에 이상적인 비-다시 그리기 및 지연되지 않는 지표입니다.  스마트 가격 액션 컨셉트 인디케이터는 신규 및 경험 많은 트레이더 모두에게 매우 강력한 도구입니다. Inner Circle Trader Analysis 및 Smart Money Concepts Trading Strategies와 같은 고급 거래 아이디어를 결합하여 20가지 이상의 유용한 지표를 하나로 결합합니다. 이 인디케이터는 스마트 머니 컨셉트에 중점을 두어 대형 기관의 거래 방식을 제공하고 이동을 예측하는 데 도움을 줍니다.  특히 유동성 분석에 뛰어나 기관이 어떻게 거래하는지 이해하는 데 도움을 줍니다. 시장 트렌드를 예측하고 가격 변동을 신중하게 분석하는 데 탁월합니다. 귀하의 거래를 기관 전략에 맞추어 시장의 동향에 대해 더 정확한 예측을 할 수 있습니다. 이 인디케이터는 시장 구조를 분석하고 중요한 주문 블록을 식별하고 다양한 패턴을 인식하는 데 뛰어납니다. 
XQ Indicator MetaTrader 5
Marzena Maria Szmit
5 (1)
Step into the realm of Forex trading with confidence and precision using XQ, a cutting-edge Forex indicator designed to elevate your trading game to unprecedented heights. Whether you're a seasoned trader or just stepping into the world of currency exchange, XQ Forex Indicator empowers you with the insights and signals needed to make informed trading decisions. The signal conditions are a combination of three indicators, and XQ Forex Indicator only display  medium and long-term trends . The ind
Volume by Price MT5
Brian Collard
5 (3)
The Volume by Price Indicator for MetaTrader 5 features Volume Profile and Market Profile TPO (Time Price Opportunity). Get valuable insights out of currencies, equities and commodities data. Gain an edge trading financial markets. Volume and TPO histogram bar and line charts. Volume Footprint charts. TPO letter and block marker charts including split structures. Versatile segmentation and compositing methods. Static, dynamic and flexible ranges with relative and/or absolute visualizations. Lay
소개       Quantum Breakout PRO   , 브레이크아웃 존 거래 방식을 변화시키는 획기적인 MQL5 지표! 13년 이상의 거래 경험을 가진 숙련된 트레이더 팀이 개발한       퀀텀 브레이크아웃 PRO       혁신적이고 역동적인 브레이크아웃 존 전략으로 거래 여정을 새로운 차원으로 끌어올리도록 설계되었습니다. Quantum Breakout Indicator는 5개의 이익 목표 영역이 있는 브레이크아웃 영역의 신호 화살표와 브레이크아웃 상자를 기반으로 한 손절 제안을 제공합니다. 초보자 거래자와 전문 거래자 모두에게 적합합니다. Quantum EA 채널:       여기를 클릭하세요 중요한! 구매 후 설치 매뉴얼을 받으려면 개인 메시지를 보내주십시오. 추천: 기간: M15 통화쌍: GBPJPY, EURJPY, USDJPY,NZDUSD, XAUUSD 계정 유형: 스프레드가 매우 낮은 ECN, Raw 또는 Razor 브로커 시간: GM
ICT, SMC, SMART MONEY CONCEPTS, SMART MONEY, Smart Money Concept, Support and Resistance, Trend Analysis, Price Action, Market Structure, Order Blocks, BOS/CHoCH,   Breaker Blocks ,  Momentum Shift,   Supply&Demand Zone/Order Blocks , Strong Imbalance,   HH/LL/HL/LH,    Fair Value Gap, FVG,  Premium  &   Discount   Zones, Fibonacci Retracement, OTE, Buy Side Liquidity, Sell Side Liquidity, BSL/SSL Taken, Equal Highs & Lows, MTF Dashboard, Multiple Time Frame, BigBar, HTF OB, HTF Market Structure
Entry Points Pro for MT5
Yury Orlov
4.54 (157)
다시 색을 칠하지 않고 거래에 진입할 수 있는 정확한 신호를 제공하는 MT5용 지표입니다. 외환, 암호화폐, 금속, 주식, 지수 등 모든 금융 자산에 적용할 수 있습니다. 매우 정확한 추정값을 제공하고 매수와 매도의 가장 좋은 시점을 알려줍니다. 하나의 시그널로 수익을 내는 지표의 예와 함께 비디오 (6:22)시청하십시오! 대부분의 거래자는 Entry Points Pro 지표의 도움으로 첫 거래 주 동안 트레이딩 결과를 개선합니다. 저희의   Telegram Group 을 구독하세요! Entry Points Pro 지표의 좋은점. 재도색이 없는 진입 신호 신호가 나타나고 확인되면(시그널 캔들이 완성된 경우) 신호는 더 이상 사라지지 않습니다. 여타 보조지표의 경우 신호를 표시한 다음 제거되기 때문에 큰 재정적 손실로 이어집니다. 오류 없는 거래 게시 알고리즘을 통해 트레이드(진입 또는 청산)를 할 이상적인 순간을 찾을 수 있으며, 이를 통해 이를 사용하는 모든 거래자의
ON Trade Gann Squares MT5
Abdullah Alrai
5 (1)
간 스퀘어 지표는 W.D. 간이 쓴 "시장 예측을 위한 수학적 공식" 기사에 기반한 강력한 시장 분석 도구입니다. 이 도구는 수학적 개념과 간 이론을 사용하여 정확한 시장 분석을 수행합니다. 144, 90, 52의 제곱과 9의 제곱을 사용합니다. 또한 의 9의 제곱근 및 해당 제곱의 채널 및 스타 패턴과의 관련성을 통합합니다. 사용자 메뉴얼 및 적용: 이 지표를 사용하기 전에 사용자 메뉴얼을 읽고 질문이 있을 경우 문의하시기 바랍니다. 전체 메뉴얼은 웹사이트에서 제공됩니다. MT5의 전체 버전을 구매하거나 MT4의 무료 버전을 테스트할 수 있습니다. 두 버전 모두 링크에서 확인하실 수 있습니다. 주요 기능 및 기능: 간 스퀘어 지표는 정확한 결정을 위해 기하학적 개념과 간 이론을 활용하는 시장 분석을 위한 포괄적인 도구 집합을 제공합니다. 주요 기능은 다음과 같습니다. 9의 제곱 분석:   이 지표는 9의 제곱에 대한 수평 선, 스타 패턴, 그리드 및 간 팬을 그릴 수 있습니다. 간
TrendMaestro5
Stefano Frisetti
note: this indicator is for METATRADER4, if you want the version for METATRADER5 this is the link:  https://www.mql5.com/it/market/product/108106 TRENDMAESTRO recognizes a new TREND in the bud, he never makes mistakes. The certainty of identifying a new TREND is priceless. DESCRIPTION TRENDMAESTRO identifies a new TREND in the bud, this indicator examines the volatility, volumes and momentum to identify the moment in which there is an explosion of one or more of these data and therefore the mome
Blahtech Supply Demand MT5
Blahtech Limited
4.57 (14)
Was: $299  Now: $99   Supply Demand uses previous price action to identify potential imbalances between buyers and sellers. The key is to identify the better odds zones, not just the untouched ones. Blahtech Supply Demand indicator delivers functionality previously unavailable on any trading platform. This 4-in-1 indicator not only highlights the higher probability zones using a multi-criteria strength engine, but also combines it with multi-timeframe trend analysis, previously confirmed swings
TPSproTREND PrO MT5
Roman Podpora
5 (5)
TPSpro TRENDPRO  - is a trend indicator that automatically analyzes the market and provides information about the trend and each of its changes, as well as giving signals for entering trades without redrawing! The indicator uses each candle, analyzing them separately. referring to different impulses - up or down impulse. Exact entry points into transactions for currencies, crypto, metals, stocks, indices!  -  Version MT4                  DETAILED DESCRIPTION        /       TRADING SETUPS       
Gartley Hunter Multi
Siarhei Vashchylka
5 (5)
Gartley Hunter Multi - An indicator for searching for harmonic patterns simultaneously on dozens of trading instruments and on all classic timeframes: (m1, m5, m15, m30, H1, H4, D1, Wk, Mn). Manual (Be sure to read before purchasing) | Version for MT4 Advantages 1. Patterns: Gartley, Butterfly, Shark, Crab. Bat, Alternate Bat, Deep Crab, Cypher 2. Simultaneous search for patterns on dozens of trading instruments and on all classic timeframes 3. Search for patterns of all possible sizes. Fr
TrendDecoder Premium MT5
Christophe, Pa Trouillas
5 (1)
이제 메타트레이더에서 사용 가능 범위 및 다음 가능한 움직임 식별       |      추세의 초기 신호와 강도를 확인하세요       |      반전 전 명확한 출구 확보       |      가격이 테스트 할 피보 레벨 파악 비추적, 비지연 지표 - 수동 및 자동 거래에 이상적 - 모든 자산 및 모든 시간 단위에 적합 - 출시 시 50% 할인   - 이후 >> $149로 복귀 구매 후   이 채널로 문의 하여 권장 설정을 확인하세요. MT4 버전:   여기를 클릭하세요 BladeSCALPER 및 PowerZONES 로 전체 방법을 확인하세요. 어떤 서비스인가요? 트렌드디코더는 추세 모니터링을 간단하고 쉽게 하기 위한 여러 혁신 기술의 집약체입니다. 투영 추세선(투영 추세선)   - 다가오는 추세의 속도 기준 실시간 추세선과 투영 추세선 비교   - 시장이 이전과 같은 방향으로 움직이고 있는지, 아니면 둔화되고 있는지? 실시간 추세선 교차   - 추세가 궤
Blahtech Market Profile MT5
Blahtech Limited
5 (8)
Was: $249  Now: $99   Market Profile defines a number of day types that can help the trader to determine market behaviour. A key feature is the Value Area, representing the range of price action where 70% of trading took place. Understanding the Value Area can give traders valuable insight into market direction and establish the higher odds trade. It is an excellent addition to any system you may be using. Inspired by Jim Dalton’s book “Mind Over Markets”, this indicator is designed to suit the
Golden Spikes Detector
Batsirayi L Marango
5 (1)
Golden Spikes Detector This indicator is based on an advanced strategy primarily for trading spikes on Boom and Crash Indices. Complex algorithms were implemented to detect high probability entries only. It alerts on potential Buy and Sell entries. To trade spikes on the Deriv or Binary broker, only take Buy Boom and Sell Cash alerts. It was optimised to be loaded on 5-minute timeframe although multiple timeframe analysis is done in the background. Features ·             Desktop pop up and sound
Matrix Arrow Indicator MT5
Juvenille Emperor Limited
5 (14)
매트릭스 화살표 표시기 MT5 는 외환, 상품, 암호 화폐, 지수, 주식과 같은 모든 기호/도구에 사용할 수 있는 100% 다시 칠하지 않는 다중 기간 표시기를 따르는 고유한 10 in 1 추세입니다.  Matrix Arrow Indicator MT5 는 다음과 같은 최대 10개의 표준 지표에서 정보와 데이터를 수집하여 초기 단계에서 현재 추세를 결정합니다. 평균 방향 이동 지수(ADX) 상품 채널 지수(CCI) 클래식 하이켄 아시 캔들 이동 평균 이동 평균 수렴 발산(MACD) 상대 활력 지수(RVI) 상대 강도 지수(RSI) 포물선 SAR 스토캐스틱 오실레이터 윌리엄스의 백분율 범위 모든 지표가 유효한 매수 또는 매도 신호를 제공하면 강력한 상승/하락 추세를 나타내는 다음 캔들/막대가 시작될 때 해당 화살표가 차트에 인쇄됩니다. 사용자는 사용할 표시기를 선택하고 각 표시기의 매개변수를 개별적으로 조정할 수 있습니다. 매트릭스 화살표 표시기 MT5는 선택한 표시기에서만 정보를 수
IX Power MT5
Daniel Stein
5 (2)
IX Power는   마침내 FX Power의 탁월한 정밀도를 외환이 아닌 기호에도 적용했습니다. 좋아하는 지수, 주식, 원자재, ETF, 심지어 암호화폐까지 단기, 중기, 장기 추세의 강도를 정확하게 파악할 수 있습니다. 단말기가 제공하는   모든 것을 분석할   수 있습니다. 사용해 보고 트레이딩   타이밍이 크게 향상되는   것을 경험해 보세요. IX Power 주요 특징 단말기에서 사용 가능한 모든 거래 심볼에 대해 100% 정확한 비재도장 계산 결과 제공 사전 구성 및 추가적으로 개별 구성 가능한 강도 분석 기간의 드롭다운 선택 가능 이메일, 메시지, 모바일 알림을 통한 다양한 알림 옵션 제공 EA 요청을 위한 액세스 가능한 버퍼 더 나은 성능을 위한 사용자 지정 가능한 계산 한도 더 많은 것을 보고 싶은 사용자를 위한 특별 다중 인스턴스 설정 모든 차트에서 좋아하는 색상을 위한 무한한 그래픽 설정 가능 Windows 11 및 macOS 스타일의 둥
Golden Gate Algo MT5
James David Lane
4 (6)
크리스마스 40% 할인! 1월 1일에 가격이 $250로 인상됩니다! GoldenGate Entries를 소개합니다: 혁신적인 트레이딩 솔루션! GoldenGate Entries (GGE)를 사용하여 거래하는 혁신적인 방법을 발견하세요. GGE는 귀하의 거래 경험을 향상시키기 위해 디자인된 고급 지표로, 사용자에게 정확성과 자신감을 부여하는 포괄적인 기능을 제공합니다. 페어: 아무거나 (FX - 상품 - 주식 - 주식 - 암호화폐) 타임프레임: 15분에서 H1까지 주요 기능: 매수 및 매도 화살표 표시: 팝업 알림과 함께 매수 및 매도 화살표 표시를 받아 언제나 정보를 확인할 수 있습니다. GoldenGate_Algo: 시장 상황에 대한 통찰력을 얻으려면 GoldenGate_Algo를 사용하세요. 시장이 '과매도'인지 '과매수'인지 평가하는 강력한 도구입니다. 현재 트렌드 분석: 현재 보고 있는 타임프레임에서 현재 트렌드에 액세스하여 거래를 주류 시장 방
Legacy of Gann for MT5
Pavel Zamoshnikov
5 (4)
The indicator very accurately determines the levels of the possible end of the trend and profit fixing. The method of determining levels is based on the ideas of W.D.Gann, using an algorithm developed by his follower Kirill Borovsky. Extremely high reliability of reaching levels (according to K. Borovsky  - 80-90%) Indispensable for any trading strategy – every trader needs to determine the exit point from the market! Precisely determines targets on any timeframes and any instruments (forex, met
Bill Williams Advanced
Siarhei Vashchylka
5 (3)
Bill Williams Advanced is designed for automatic chart analysis using Bill Williams' "Profitunity" system. The indicator analyzes four timeframes at once. Manual (Be sure to read before purchasing) Advantages 1. Automatically analyzes the chart using the "Profitunity" system of Bill Williams. The found signals are placed in a table in the corner of the screen. 2. Equipped with a trend filter based on the Alligator indicator. Most of the system signals are recommended to be used only accordi
Trend Forecaster
Alexey Minkov
5 (3)
The Trend Forecaster indicator utilizes a unique proprietary algorithm to determine entry points for a breakout trading strategy. The indicator identifies price clusters, analyzes price movement near levels, and provides a signal when the price breaks through a level. The Trend Forecaster indicator is suitable for all financial assets, including currencies (Forex), metals, stocks, indices, and cryptocurrencies. You can also adjust the indicator to work on any time frames, although it is recommen
Professional Scalping Tool on Deriv Attention! The indicator will be sold in limited quantities!!! Description: This trading indicator is designed for professional traders focused on scalping. Designed with the market in mind, it provides highly accurate spike trading signals. It works on the M1 timeframe and supports the following symbols: Boom 300 Index, Boom 500 Index, Boom 1000 Index, Crash 300 Index, Crash 500 Index, Crash 1000 Index. Functional Features: - Direction: - Trading is ca
The 123 Pattern is one of the most popular, powerful and flexible chart patterns. The pattern is made up of three price points: a bottom, a peak or valley, and a Fibonacci retracement between 38.2% and 71.8%. A pattern is considered valid when the price breaks beyond the last peak or valley, moment at which the indicator plots an arrow, rises an alert, and the trade can be placed. [ Installation Guide | Update Guide | Troubleshooting | FAQ | All Products ] Clear trading signals Customizable c
Quantum Heiken Ashi PRO MT5
Bogdan Ion Puscasu
4.5 (8)
시장 동향에 대한 명확한 통찰력을 제공하도록 설계된 Heiken Ashi 양초는 노이즈를 필터링하고 잘못된 신호를 제거하는 기능으로 유명합니다. 혼란스러운 가격 변동에 작별을 고하고 더 매끄럽고 신뢰할 수 있는 차트 표현을 만나보세요. Quantum Heiken Ashi PRO를 정말 독특하게 만드는 것은 전통적인 촛대 데이터를 읽기 쉬운 색상 막대로 변환하는 혁신적인 공식입니다. 빨간색과 녹색 막대는 각각 약세와 강세 추세를 우아하게 강조하여 잠재적 진입점과 퇴장점을 매우 정확하게 파악할 수 있습니다. Quantum EA 채널:       여기를 클릭하세요 MT4 버전:       여기를 클릭하세요 이 놀라운 지표는 다음과 같은 몇 가지 주요 이점을 제공합니다. 선명도 향상: Heiken Ashi 바는 가격 변동을 완화하여 시장 추세를 보다 명확하게 나타내므로 유리한 거래 기회를 쉽게 식별할 수 있습니다. 소음 감소: 종종 잘못된 신호로 이어지는 불규칙한 가격 변동
제작자의 제품 더 보기
Candle Timer Countdown
JETINVEST
4.78 (65)
캔들 타이머 카운트다운은 현재 막대가 닫히고 새 막대가 형성되기까지 남은 시간을 표시합니다. 시간 관리에 사용할 수 있습니다. MT4 버전은 여기 ! 기능 하이라이트 현지 시간이 아닌 서버 시간을 추적합니다. 구성 가능한 텍스트 색상 및 글꼴 크기 기호 일일 변동의 선택적 시각화 CPU 사용량을 줄이기 위해 최적화 입력 매개변수 일별 편차 표시: 참/거짓 텍스트 글꼴 크기 텍스트 색상 여전히 질문이 있는 경우 다이렉트 메시지로 저에게 연락하십시오.   https://www.mql5.com/ko/users/robsjunqueira/ 이것이 우리가 지속적으로 발전 할 수있는 유일한 방법이기 때문에 개선을위한 제안에 부담없이 문의하십시오. 또한 당사의 다른 지표 및 전문 고문에 대해 알아보십시오. 다양한 유형의 자산을 거래할 수 있는 다양한 상품이 있음을 알 수 있습니다.
FREE
MACD Intraday Trend
JETINVEST
4.75 (44)
MACD 장중 추세는 1960년대 Gerald Appel이 만든 원본 MACD를 개조하여 개발한 지표입니다. 수년간의 거래를 통해 MACD의 매개변수를 피보나치 비율로 변경함으로써 추세 움직임의 연속성을 더 잘 표현함으로써 가격 추세의 시작과 끝을 보다 효율적으로 감지할 수 있다는 것이 관찰되었습니다. 가격 추세를 감지하는 효율성으로 인해 상단과 하단의 차이를 매우 명확하게 식별하여 거래 기회를 더 잘 활용할 수도 있습니다. 구성 가능한 기능과 경고가 있는 전문가용 버전을 사용해 보십시오: MACD Intraday Trend PRO 특징 모든 통화 쌍에서 작동 모든 시간대에 작동 Renko 차트와 함께 작동 여전히 질문이 있는 경우 다이렉트 메시지로 저에게 연락하십시오.   https://www.mql5.com/ko/users/robsjunqueira/
FREE
캔들 타이머 카운트다운은 현재 막대가 닫히고 새 막대가 형성되기까지 남은 시간을 표시합니다. 시간 관리에 사용할 수 있습니다. MT5 버전은 여기 ! 기능 하이라이트 현지 시간이 아닌 서버 시간을 추적합니다. 구성 가능한 텍스트 색상 및 글꼴 크기 기호 일일 변동의 선택적 시각화 CPU 사용량을 줄이기 위해 최적화 입력 매개변수 일별 편차 표시: 참/거짓 텍스트 글꼴 크기 텍스트 색상 여전히 질문이 있는 경우 다이렉트 메시지로 저에게 연락하십시오.   https://www.mql5.com/ko/users/robsjunqueira/ 이것이 우리가 지속적으로 발전 할 수있는 유일한 방법이기 때문에 개선을위한 제안에 부담없이 문의하십시오. 또한 당사의 다른 지표 및 전문 고문에 대해 알아보십시오. 다양한 유형의 자산을 거래할 수 있는 다양한 상품이 있음을 알 수 있습니다.
FREE
Tabajara VWAP Ogro RSJ
JETINVEST
4.82 (33)
Setup Tabajara는 "월스트리트의 OGRO"로 알려진 브라질 상인이 만들었습니다. 이 설정의 아이디어는 거래자에게 현재 가격 추세와 그래프에서 찾아야 하는 작업 유형을 나타내는 것입니다. 작업 이것은 오전 10시 40분까지 양초와 VWAP를 닫는 위치를 지정하고 그 이후에 4가지 색상으로 양초를 칠하는 20주기의 산술 평균으로 수행합니다. 녹색 -> 가격 상승 추세 (구매 진입점 검색) 검은색 -> 강세 추세에서 가격 수정(구매 진입점 검색) 빨간색 -> 하락 추세에 있는 가격 (매도 진입점 검색) 흰색 -> 하락세 시 가격 조정 (판매 진입점 검색) 또한 스크립트에 다음 표시기를 넣었습니다. 8 기간의 지수 평균: 단기 가격 움직임 식별 50개 기간의 산술 평균: 중기 가격 움직임 식별 80 기간의 지수 평균: 중기 가격 움직임 식별 200개 기간의 산술 평균: 장기 가격 움직임 식별 여전히 질문이 있는 경우 다이렉트 메시지로 저에게 연락하십시오: https:
FREE
Pivot Point Fibo RSJ
JETINVEST
4.29 (17)
피봇 포인트 Fibo RSJ는 피보나치 비율을 사용하여 당일의 지지선과 저항선을 추적하는 지표입니다. 이 멋진 지표는 피보나치 비율을 사용하여 피벗 포인트를 통해 최대 7단계의 지지와 저항을 생성합니다. 가격이 작업의 가능한 진입/종료 지점을 인식할 수 있는 이 지원 및 저항의 각 수준을 어떻게 존중하는지 환상적입니다. 특징 최대 7단계 지원 및 7단계 저항 레벨의 색상을 개별적으로 설정 입력 피벗 유형 피벗 피보 RSJ1 = 피보 비율 1 계산 피벗 피보 RSJ2 = 피보 비율 2 계산 피벗 Fibo RSJ3 = Fibo 비율 3 계산 피벗 피보 클래식 = 클래식 피벗 계산 최소 피벗 수준 피벗 3 레벨 피벗 4 레벨 피벗 5 레벨 6단계 피벗 피벗 7 레벨 여전히 질문이 있는 경우 다이렉트 메시지로 저에게 연락하십시오: https://www.mql5.com/ko/users/robsjunqueira/
FREE
캔들 카운터는 그 날의 첫 캔들부터 캔들 개수를 출력하는 인디케이터입니다. 오늘의 첫 번째 양초는 숫자 1이 되며 새 양초는 이 개수에서 1씩 증가합니다. 입력 매개변수 짝수, 홀수 또는 모두에서 선택 촛불에서 숫자 인쇄까지의 거리 텍스트 글꼴 크기 텍스트 글꼴 색상 여전히 질문이 있는 경우 다이렉트 메시지로 저에게 연락하십시오.   https://www.mql5.com/ko/users/robsjunqueira/ ----------------- 이것이 우리가 지속적으로 발전 할 수있는 유일한 방법이기 때문에 개선을위한 제안에 부담없이 문의하십시오. 또한 당사의 다른 지표 및 전문 고문에 대해 알아보십시오. 다양한 유형의 자산을 거래할 수 있는 다양한 상품이 있음을 알 수 있습니다.
FREE
MACD Intraday Trend MT4
JETINVEST
4.61 (18)
MACD 장중 추세는 1960년대 Gerald Appel이 만든 원본 MACD를 개조하여 개발한 지표입니다. 수년간의 거래를 통해 MACD의 매개변수를 피보나치 비율로 변경함으로써 추세 움직임의 연속성을 더 잘 표현함으로써 가격 추세의 시작과 끝을 보다 효율적으로 감지할 수 있다는 것이 관찰되었습니다. 가격 추세를 감지하는 효율성으로 인해 상단과 하단의 차이를 매우 명확하게 식별하여 거래 기회를 더 잘 활용할 수도 있습니다. 구성 가능한 기능과 경고가 있는 전문가용 버전을 사용해 보십시오:   MACD Intraday Trend PRO 특징 모든 통화 쌍에서 작동 모든 시간대에 작동 Renko 차트와 함께 작동 여전히 질문이 있는 경우 다이렉트 메시지로 저에게 연락하십시오.   https://www.mql5.com/ko/users/robsjunqueira/
FREE
Delta Aggression Volume PRO is an indicator developed to monitor the strength and continuity of the aggression volume of sell and buy negotiations. Note: This indicator DOES NOT WORK for Brokers and/or Markets WITHOUT the type of aggression (BUY or SELL). Cryptocurrencies and Forex do not provide this type of data, that is, it does not work with them. O Delta Agrression Volume PRO has features that allow you to view beyond the delta volume of the day. Operation Multi symbols  (those who pro
Weis Waves RSJ
JETINVEST
4.67 (9)
The Weis Waves RSJ Indicator sums up volumes in each wave. This is how we receive a bar chart of cumulative volumes of alternating waves. Namely the cumulative volume makes the Weis wave charts unique. It allows comparing the relation of the wave sequence characteristics, such as correspondence of the applied force (expressed in the volume) and received result (the price progress). If you still have questions, please contact me by direct message:  https://www.mql5.com/en/users/robsjunqueira/
FREE
피봇 포인트 Fibo RSJ는 피보나치 비율을 사용하여 당일의 지지선과 저항선을 추적하는 지표입니다. 이 멋진 지표는 피보나치 비율을 사용하여 피벗 포인트를 통해 최대 7단계의 지지와 저항을 생성합니다. 가격이 작업의 가능한 진입/종료 지점을 인식할 수 있는 이 지원 및 저항의 각 수준을 어떻게 존중하는지 환상적입니다. 특징 최대 7단계 지원 및 7단계 저항 레벨의 색상을 개별적으로 설정 입력 피벗 유형 피벗 피보 RSJ1 = 피보 비율 1 계산 피벗 피보 RSJ2 = 피보 비율 2 계산 피벗 Fibo RSJ3 = Fibo 비율 3 계산 피벗 피보 클래식 = 클래식 피벗 계산 최소 피벗 수준 피벗 3 레벨 피벗 4 레벨 피벗 5 레벨 6단계 피벗 피벗 7 레벨 여전히 질문이 있는 경우 다이렉트 메시지로 저에게 연락하십시오: https://www.mql5.com/ko/users/robsjunqueira/
FREE
Tabajara Ogro
JETINVEST
4.75 (12)
Setup Tabajara was created by a Brazilian trader known as  "The OGRO of Wall Street" . The idea of this setup is to indicate to the trader the current trend of prices and  the type of operation should be looked for in the graph. Operation It does this through the relation of the closing price position and the     of 20 periods, by painting the candles in 4 possible colors : Green -> Price rising in upward trend (Search entry points for PURCHASE) Black -> Price correcting in Bullish Trend
FREE
VWAP Fibo Bands RSJ
JETINVEST
4.91 (11)
VWAP Fibo Bands RSJ is an indicator that traces the lines of the daily VWAP and from it creates bands using Fibonacci proportions. This spectacular indicator creates 10 band levels through the selected VWAP period using Fibonacci ratios. It is fantastic how the prices respect each level of the bands, where it is possible to realize that almost every time the price closes above / below a level of the bands he will seek the next one. If close above will seek to reach the level above and if close
FREE
MACD Intraday Trend PRO는 1960년대 Gerald Appel이 만든 원본 MACD를 개조하여 개발한 지표입니다. 수년간의 거래를 통해 MACD의 매개변수를 피보나치 비율로 변경함으로써 추세 움직임의 연속성을 더 잘 표현함으로써 가격 추세의 시작과 끝을 보다 효율적으로 감지할 수 있다는 것이 관찰되었습니다. 가격 추세를 감지하는 효율성으로 인해 상단과 하단의 차이를 매우 명확하게 식별하여 거래 기회를 더 잘 활용할 수도 있습니다. 특징 표시기 MACD Intraday Trend PRO는 모든 통화 쌍, 모든 시간대 및 Renko 차트에서 작동합니다. 5가지 모드를 선택하여 추세 감지 속도를 설정할 수 있습니다. 가장 빠른 빠른 정상 느린 가장 느림 자원 6개의 구성 가능한 경고가 있습니다. MACD는 신호 라인에서 후퇴 MACD가 신호선을 넘다 MACD는 레벨 0을 교차 신호선이 레벨 0을 넘습니다. MACD 변경 트렌드 색상 신호선 변경 TRE
Trend WIN B3
JETINVEST
5 (4)
Trend WIN B3는 MT5 플랫폼용으로 제작된 전문 거래 시스템으로 BRAZIL B3의 MINI FUTURE INDEX(WIN)와 함께 작동하도록 최적화되어 있습니다. 시스템은 여러 시간대(1M, 5M, 15M, 30M, H1, H4, D1)에서 Fuzzy Logic을 사용하여 계산에 따라 각 시간대에 가중치를 적용하여 가격 추세를 식별합니다. 추세를 파악한 후 시스템은 평균 변동성에 따라 STOP 주문(BUY 또는 SELL)을 포지셔닝하고, 포지션이 열리면 EA는 항상 이익 극대화를 추구하는 트레일링 스톱(trailing stop)을 통해 거래를 수행합니다. 주요 특징 마틴게일을 사용하지 않음 그리드를 사용하지 않음 Fuzzy 알고리즘으로 계산된 추세를 그래프에 표시 모든 시간대에 작동 구성 가능한 운영 시간 구성 가능한 개방 GAP 제어 구성 가능한 로트 증대 동적 모드 4개의 구성 가능한 트레일링 스톱 레벨 제품 설명서와 동영상이 있는 블로그에 접속하여 더 자세한
MACD Intraday Trend PRO는 1960년대 Gerald Appel이 만든 원본 MACD를 개조하여 개발한 지표입니다. 수년간의 거래를 통해 MACD의 매개변수를 피보나치 비율로 변경함으로써 추세 움직임의 연속성을 더 잘 표현함으로써 가격 추세의 시작과 끝을 보다 효율적으로 감지할 수 있다는 것이 관찰되었습니다. 가격 추세를 감지하는 효율성으로 인해 상단과 하단의 차이를 매우 명확하게 식별하여 거래 기회를 더 잘 활용할 수도 있습니다. 특징 표시기 MACD Intraday Trend PRO는 모든 통화 쌍, 모든 시간대 및 Renko 차트에서 작동합니다. 5가지 모드를 선택하여 추세 감지 속도를 설정할 수 있습니다. 가장 빠른 빠른 정상 느린 가장 느림 자원 6개의 구성 가능한 경고가 있습니다. MACD는 신호 라인에서 후퇴 MACD가 신호선을 넘다 MACD는 레벨 0을 교차 신호선이 레벨 0을 넘습니다. MACD 변경 트렌드 색상 신호선 변경 TRE
Vwap RSJ
JETINVEST
4.93 (14)
VWAP RSJ is an indicator that plots the Hourly, Daily, Weekly and Monthly  VWAP Lines. Large institutional buyers and   mutual funds   use the VWAP ratio to help move into or out of stocks with as small of a market impact as possible. Therefore, when possible, institutions will try to buy below the VWAP, or sell above it. This way their actions push the price back toward the average, instead of away from it. Based on this information I developed this indicator that combines 4 types of VWAP T
FREE
This simple indicator paints with a darker color on the volume bar when the quantity traded is above the average of select number of periods of the volume itself, highlighting the moments when there was a large volume of deals above the average. It is also possible to use a configuration of four colors where the color tone shows a candle volume strength. The indicator defaults to the simple average of 20 periods, but it is possible to change to other types of averages and periods. If you like
FREE
This indicator calculates the difference between the SELL aggression and the BUY aggression that occurred in each Candle, plotting the balance of each one graphically. Note: This indicator DOES NOT WORK for Brokers and/or Markets WITHOUT the type of aggression (BUY or SELL). Be sure to try our   Professional   version with configurable features and alerts:   Delta Agression Volume PRO Settings Aggression by volume (Real Volume) or by number of trades (Tick Volume) Start of the Aggression De
FREE
Aggression Wave RSJ
JETINVEST
4.38 (8)
This indicator sums up the difference between the sells aggression and the buys aggression that occurred in each Candle, graphically plotting the waves of accumulation of the aggression volumes.   Through these waves an exponential average is calculated that indicates the direction of the business flow. Note: This indicator DOES NOT WORK for Brokers and/or Markets WITHOUT the type of aggression (BUY or SELL).   Be sure to try our Professional version with configurable features and alerts:  Agr
FREE
Funcionamento: O Painel  Netting Panel RSJ  funciona com   qualquer ativo   e em   qualquer tempo gráfico . Ele funciona em contas do tipo " Netting " e " Hedge ", mas gerencia apenas uma posição por ativo, por isso o nome   Netting.   Se ele for executado em contas do tipo " Hedge ", ele fará o gerenciamento e proteção   apenas da posição mais antiga , ou seja, da primeira posição que foi aberta por ele. Em contas " Netting " quando os botões " SELL " ou " BUY " forem pressionados,   ocorrer
FREE
Volume By Color RSJ
JETINVEST
4.5 (4)
This simple indicator paints with a darker color on the volume bar when the quantity traded is above the average of select number of periods of the volume itself, highlighting the moments when there was a large volume of deals above the average. It is also possible to use a configuration of four colors where the color tone shows a candle volume strength. The indicator defaults to the simple average of 20 periods, but it is possible to change to other types of averages and periods. If you like
FREE
RENKO PRICE ACTION ATR은 각 BRICK이 사용자가 선택한 기간의 ATR을 통해 계산된 크기를 갖는 Renko Chart의 구성을 통해 개발된 "Expert Advisor"입니다. Renko 차트는 사소한 가격 변동을 걸러내도록 설계되어 거래자가 중요한 추세에 더 쉽게 집중할 수 있습니다. 가격 추세를 감지하는 효율성으로 인해 지지와 저항, 상단 및 하단 다이버전스를 명확하게 식별하여 거래 기회를 더 잘 활용할 수도 있습니다. 작업 RENKO PRICE ACTION ATR은 모든 통화 쌍에서 작동합니다. RENKO PRICE ACTION ATR은 실시간 업데이트 성능이 뛰어납니다. 설정 ATR 계산 기간: RENKO PRICE ACTION ATR이 ATR의 평균을 적용하고 각 BRICK의 크기를 계산/재계산하기 위해 사용자가 선택한 기간입니다. ATR 계산 평균 기간: 각 BRICK에 대한 크기 계산을 수행하기 위해 RENKO PRICE ACTION ATR에
지표 공급 수요 RSJ PRO는 그래프에 "공급" 및 "수요" 영역을 계산하고 표시하여 영역 유형(약함, 강함, 확인됨, 입증됨)을 식별하고 영역을 다시 테스트하는 경우 몇 번인지 보여줍니다. 재시험했다. "공급" 구역은 수요보다 공급이 더 많이 발생하여 가격을 낮추는 가격 구역입니다. "수요" 구역은 공급보다 많은 수요가 발생하여 가격을 상승시키는 가격 구역입니다. 구성 가능한 기능 및 경고가 포함된 전문가용 버전을 사용해 보십시오: Suppy Demand RSJ PRO 구역 분류 약함: 다시 테스트할 경우 위반될 가능성이 있는 가격 영역입니다. 강함: 추세의 방향을 변경했고 그렇게 빨리 재시험될 가능성이 없는 가격 영역. 검증됨: 최대 1~3번의 재테스트가 있었지만 가격이 해당 영역을 깰 수 없는 강한 가격 영역. 입증됨: 3회 이상의 재시험이 있었지만 가격이 해당 지역을 돌파하지 못한 강한 가격 영역. Broken/Turncoat: 지지의 경우 저항이 되고 지지
지표 공급 수요 RSJ PRO는 그래프에 "공급" 및 "수요" 영역을 계산하고 표시하여 영역 유형(약함, 강함, 확인됨, 입증됨)을 식별하고 영역을 다시 테스트하는 경우 몇 번인지 보여줍니다. 재시험했다. "공급" 구역은 수요보다 공급이 더 많이 발생하여 가격을 낮추는 가격 구역입니다. "수요" 구역은 공급보다 많은 수요가 발생하여 가격을 상승시키는 가격 구역입니다. 구역 분류 약함: 다시 테스트할 경우 위반될 가능성이 있는 가격 영역입니다. 강함: 추세의 방향을 변경했고 그렇게 빨리 재시험될 가능성이 없는 가격 영역. 검증됨: 최대 1~3번의 재테스트가 있었지만 가격이 해당 영역을 깰 수 없는 강한 가격 영역. 입증됨: 3회 이상의 재시험이 있었지만 가격이 해당 지역을 돌파하지 못한 강한 가격 영역. Broken/Turncoat: 지지의 경우 저항이 되고 지지의 경우 저항이 되는 깨지는 가격 영역입니다. 설정 시각적 설정: 약한 영역 표시: 약한 영역으로 분류된 영역이 표시
Trend WDO B3
JETINVEST
5 (2)
Trend WDO B3는 MT5 플랫폼용으로 제작된 전문 거래 시스템으로 BRAZIL B3의 MINI DOLAR INDEX(WDO)와 함께 작동하도록 최적화되어 있습니다. 시스템은 여러 시간대(1M, 5M, 15M, 30M, H1, H4, D1)에서 Fuzzy Logic을 사용하여 계산에 따라 각 시간대에 가중치를 적용하여 가격 추세를 식별합니다. 추세를 파악한 후 시스템은 평균 변동성에 따라 STOP 주문(BUY 또는 SELL)을 포지셔닝하고, 포지션이 열리면 EA는 항상 이익 극대화를 추구하는 트레일링 스톱(trailing stop)을 통해 거래를 수행합니다. 주요 특징 마틴게일을 사용하지 않음 그리드를 사용하지 않음 Fuzzy 알고리즘으로 계산된 추세를 그래프에 표시 모든 시간대에 작동 구성 가능한 운영 시간 구성 가능한 개방 GAP 제어 구성 가능한 로트 증대 동적 모드 4개의 구성 가능한 트레일링 스톱 레벨 제품 설명서와 동영상이 있는 블로그에 접속하여 더 자세한 정
SniperBot EURUSD
JETINVEST
5 (1)
EA는 변동성, 스프레드, 빈도 및 타이밍을 사용하여 거래 시기를 결정합니다. EA는 지정가 주문 방법을 사용하여 포지션을 엽니다. 이 경우 Slippage는 항목을 실행할 때 기껏해야 긍정적일 것입니다. EA는 시스템의 초점이 자본을 보호하면서 돈을 버는 것이므로 Trailing Take Profit 논리를 사용합니다. 대부분의 거래는 저격 헤드샷처럼 빠르게 마감됩니다. 주요 특징 마틴게일을 사용하지 않습니다 그리드를 사용하지 않음 최적화된 통화 쌍: EURUSD 기간: M5 주의 사항: 이 EA는 롤오버 전 몇 분부터 롤오버 후 몇 분까지 하루에 일정 범위의 시간 동안만 거래합니다. .set 파일이 필요하지 않으며 모든 설정이 EA에 저장됩니다. 브로커가 접미사(예: XXXXXX.a)를 사용하는 경우 EA가 자동으로 식별하므로 걱정하지 않아도 됩니다. 설치하는 방법 이 시스템은 독립형이며 VPS에서 지속적으로 실행되어야 합니다. 낮은 스프레드 ECN 브로커에서 EA를
Sniper Major
JETINVEST
5 (1)
EA는 변동성, 스프레드, 빈도 및 타이밍을 사용하여 거래 시기를 결정합니다. EA는 지정가 주문 방법을 사용하여 포지션을 엽니다. 이 경우 Slippage는 항목을 실행할 때 기껏해야 긍정적일 것입니다. EA는 시스템의 초점이 자본을 보호하면서 돈을 버는 것이므로 Trailing Take Profit 논리를 사용합니다. 대부분의 거래는 저격 헤드샷처럼 빠르게 마감됩니다. 주요 특징 마틴게일을 사용하지 않습니다 그리드를 사용하지 않음 최적화된 통화 쌍: EURUSD | GBPUSD | 엔엔 | USDCHF 기간: M5 주의 사항: 이 EA는 롤오버 전 몇 분부터 롤오버 후 몇 분까지 하루에 일정 범위의 시간 동안만 거래합니다. 하나의 차트 설정: 모든 최적화된 기호를 거래하려면 하나의 차트만 있으면 됩니다. 여러 통화 쌍 지원 .set 파일이 필요하지 않으며 모든 설정이 EA에 저장됩니다. 브로커가 접미사(예: XXXXXX.a)를 사용하는 경우 EA가 자동으로 식별하므로 걱정하
JetBot
JETINVEST
This is an EXPERT with a FOCUS on LEARNING and PROFESSIONAL DEVELOPMENT!!! The idea of this product is to commercialize the source code, allowing those who want to develop their own robots, or start a professional activity developing customized experts, to have a reference source code that helps them in the learning and development process. This source code will be increased, that is, new functionalities will be created, thus allowing the project to continue evolving. For every 10 sales a new v
필터:
Wesley Bezerra Mota
302
Wesley Bezerra Mota 2021.07.06 20:13 
 

사용자가 평가에 대한 코멘트를 남기지 않았습니다

JETINVEST
245910
개발자의 답변 Roberto Sant Ana Junqueira 2021.07.06 20:14
Obrigado
Fabio_Novaes
175
Fabio_Novaes 2021.06.30 21:34 
 

사용자가 평가에 대한 코멘트를 남기지 않았습니다

JETINVEST
245910
개발자의 답변 Roberto Sant Ana Junqueira 2021.06.30 21:34
Tks
Marilise Ravaglio Da Cunha Junqueira
386
 

사용자가 평가에 대한 코멘트를 남기지 않았습니다

JETINVEST
245910
개발자의 답변 Roberto Sant Ana Junqueira 2021.07.26 21:53
Obrigado
Robson Souza
122
Robson Souza 2021.06.30 14:53 
 

사용자가 평가에 대한 코멘트를 남기지 않았습니다

JETINVEST
245910
개발자의 답변 Roberto Sant Ana Junqueira 2021.06.30 15:07
Hi Robson, tks for your review.
리뷰 답변