• 미리보기
  • 리뷰 (5)
  • 코멘트

Netting Panel RSJ

4.5


Funcionamento:

O Painel Netting Panel RSJ funciona com qualquer ativo e em qualquer tempo gráfico.

Ele funciona em contas do tipo "Netting" e "Hedge", mas gerencia apenas uma posição por ativo, por isso o nome Netting. Se ele for executado em contas do tipo "Hedge", ele fará o gerenciamento e proteção apenas da posição mais antiga, ou seja, da primeira posição que foi aberta por ele.

Em contas "Netting" quando os botões "SELL" ou "BUY" forem pressionados, ocorrerá incremento ou decremento da posição. No caso do incremento em que ocorra preço médio, indiferente se à favor ou contra a posição atual, o Painel fará automaticamente os ajustes necessários sempre baseado nas configurações atuais feitas pelo o usuário.

Em contas "Hedge" quando os botões "SELL" ou "BUY" forem pressionados, ocorrerá a abertura de novas posições, sem que afete a posição atual que está sendo gerenciada pelas configurações do usuário. Caso a posição atual na conta do tipo "Hedge" seja fechada e existam uma ou mais posições abertas pelo Painel no mesmo ativo, automaticamente o Painel irá gerenciar a posição mais antiga.

O Painel Netting Panel RSJ possui os seguintes recursos:

  • Variação em % do ativo atual com relação ao seu fechamento do dia anterior.
  • Contador regressivo para fechamento do candle atual (baseado no timeframe do gráfico atual).
  • Valores de "BID" e "ASK" do ativo atual.
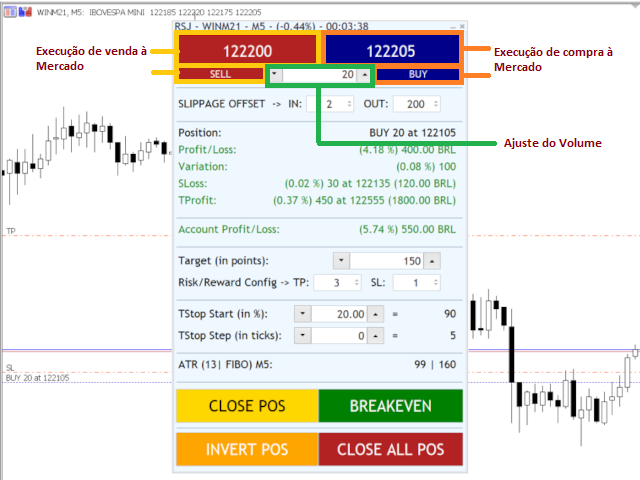
  • Configuração no tamanho do lote aplicado nas operações de compra e venda.
  • Botões de compra e venda à mercado.
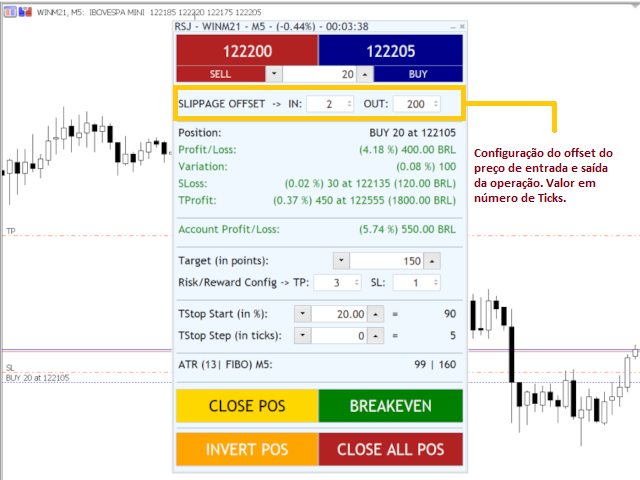
  • Configuração do offset máximo (podendo ser positivo ou negativo) do preço no momento da execução da ordem à mercado.
  • Detalhes da posição atual em gerenciamento (Verde em lucro ou vermelho em prejuízo) :
    • Tipo da posição ("BUY" / "SELL") informando o tamanho em lotes e o preço da mesma.
    • Variação da posição em % com relação ao Saldo da Conta, e valor do lucro ou prejuízo na moeda corrente do ativo.
    • Variação em % e em pontos com relação ao preço de entrada da posição. 
    • Valor do Stop Loss atual com as seguintes informações:
      • Variação em % do preço de entrada.
      • Número de pontos à partir do preço de entrada.
      • Preço de ativação do Stop Loss
      • Valor estimado do lucro ou prejuízo caso seja executado o Stop Loss na moeda corrente do ativo.
    • Valor do Take Profit atual com as seguintes informações :
      • Variação em % do preço de entrada.
      • Número de pontos à partir do preço de entrada.
      • Preço de ativação do Take Profit
      • Valor estimado do lucro caso seja executado o Take Profit na moeda corrente do ativo.
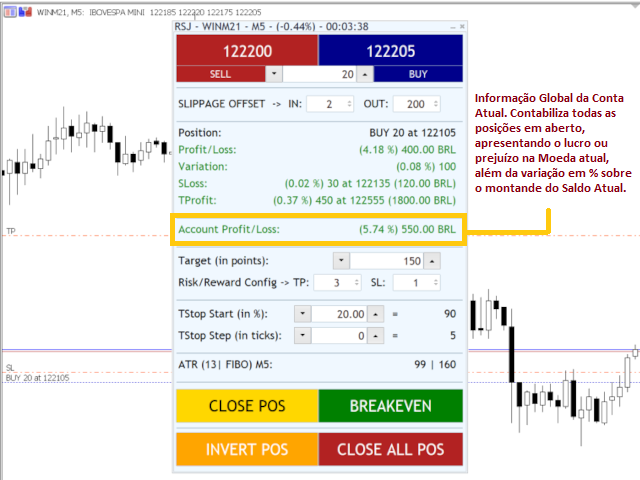
    • Contabilização global do lucro ou prejuízo atual da conta. Soma de todos os resultados das posições em aberto de todos os ativos na conta atual. (Verde em lucro ou vermelho em prejuízo)
    • Configuração do objetivo em pontos do Target da operação à ser aberta.
    • Configuração do Risk & Reward da operação à ser aberta. Esta configuração é um multiplicador a ser aplicado sobre o objetivo configurado no Target. Ela configurará o Take Profit e o Stop Loss.
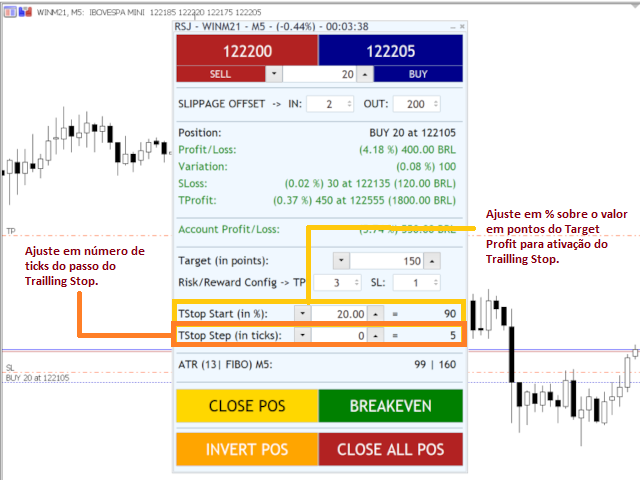
    • Configuração do Trailling Stop em % calculado sobre o Take Profit configurado da operação.
    • Configuração do Step do Trailling Stop caso ele seja ativado.
      • Informação do indicador ATR (Average True Range) automaticamente a cada ciclo de 1 minuto feito sobre o timeframe do gráfico atual e pelo período configurado pelo usuário. Apresenta uma sugestão de ATR FIBO multiplicado pelo fator padrão de Fibonacci.
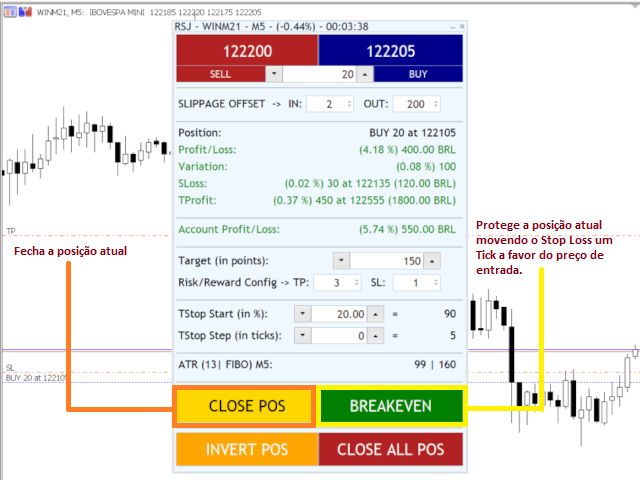
      • Botão de fechamento da posição atual.
      • Botão de proteção da posição atual chamado "Breakeven". Só irá funcionar se o preço estiver pelo menos um TICK distante e positivo na posição atual.
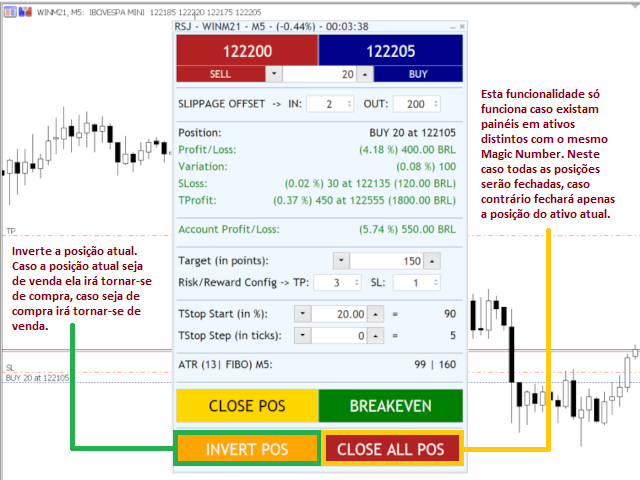
      • Botão de inversão da posição. Transforma um posição vendida em comprada e uma posição comprada em vendida.
      • Botão de fechamento de todas as posições. No caso de contas "Netting" caso o Painel esteja aberto em vários ativos utilizando o mesmo "Magic Number", também chamado de EA ID, fechará todas as posições abertas por este ID. No caso de contas "Hedge" ele fechará todas as posições abertas no ativo atual, mas apenas as que foram abertas pelo Painel.


      리뷰 5
      Renan Fernandes Souza
      178
      Renan Fernandes Souza 2021.07.15 11:00 
       

      Esta boleta é uma ferramenta essencial para o trader que quer otimizar as suas operações. Parabéns Roberto, ficou muito bom.

      Fabio_Novaes
      175
      Fabio_Novaes 2021.06.30 21:40 
       

      show demais.

      Nitirojn Vichaikasampong
      97
      Nitirojn Vichaikasampong 2021.07.25 07:36 
       

      good

      추천 제품
      DataFeeder
      Joao Paulo Euko
      5 (1)
      Hi you, I need your help! Be my Patron, let's make it possible! https://www.patreon.com/joaopeuko https://github.com/Joaopeuko/Mql5-Python-Integration Esse Expert Advisor copia os dados("symbol,last,bid,ask") dos ativos que foram colocados na lista e só funciona enquanto o mercado esta aberto. Esse EA não é um link DDE ou RTD, as informações não são passadas em tempo real ao excel. O EA tem um delay de 30 segundos e o Excel tem um delay de 1 minuto. A vantagem desse EA é que ele dispen
      FREE
      PANEL OF TOPOS AND HISTORICAL BACKGROUNDS   This is a panel that does not open orders only manages all Symbols and calculates the tops and bottoms and presents the calculation in relation to the top and bottom in 5 Years, 2 Months and 1 Week. It is ideal for filtering the pairs that are in the good regions to operate. You can filter the range and choose whether to consider the body or shadow of the candle in the monthly. Good luck...
      FREE
      Steady Bands3
      Roberto Tavares
      Equidistant bands indicator with calculated moving average, allows you to configure the band size and can be used freely as an entry / exit indicator. Buffer 0 = price, buffer 1 = upper band, buffer 2 = lower band. you can also configure the periods of moving averages used in the calculations and also the shift to previous bars in addition to the price that can CLOSE (default) or OPEN. Excellent for fast daily moving pairs and frequent returns.
      FREE
      Graphic Alignment Context
      Ricardo Alexandre Laurentino
      The Graphic Alignment Context (GAC) Technical Indicator measures the vertical difference of the simple average price of a financial instrument in the context of three different timeframes determined by a defined number of bars or candles (periods) to determine the strength of the buy or sell trend. sale. Ascending average prices indicate Buying strength (1), Descending average prices indicate Selling strength (-1) and any scenario different from the previous two conditions indicates Neutrality
      FREE
      Donchian Pro
      Paulo Henrique Faquineli Garcia
      5 (1)
      The Donchian Channel Channels are among the most popular tools of technical analysis, as they visually convey to the analyst the limits within which most price movement tends to occur. Channel users know that valuable information can be obtained at any time, whether prices are in the central region of a band or close to one of the border lines. One of the best known techniques to explore these concepts is Bollinger Bands. However, John Bollinger was not the only one to research the applicatio
      FREE
      SOSTrading
      Giglienio Fagner Dantas Araujo
      4.25 (4)
      Com este indicador é possível demarcar os candles que compõem uma determinada faixa de horário, além de destacar a primeira barra e o fechamento do horário demarcado. Além da funcionalidade citada, ainda é possível visualizar por meio de um painel que pode ser ativado nas propriedades do indicado e na tecla "p" do teclado as variações diárias considerando o dia e a faixa de horário demarcada, além de simular a variação em porcentagem e valores determinada pela função "cursor em cruz" (CTRL+F, b
      FREE
      FT ADX Color Candles
      FELIPE MISAEL MORAES KRUGER
      4.83 (6)
      Trading can be quite tiring when you need to look at several things at the same time. Format of candles, supports, resistances, schedules, news and indicators. This tool aims to facilitate the analysis of the ADX indicator. It colors the candles based on the levels of the indicator and the DI lines. The period, the limit of the indicator and the colors of the candles are customizable. You can also place a visual aid on the lower right side of the graph to view the values of ADX, DI + and
      FREE
      BetterTickVolume
      Zoltan Nemet
      5 (2)
      Market tops are characterized by Volume Climax Up bars, High Volume Churn and Low Volume Up bars (also called Testing). Market bottoms are characterized by Volume Climax Down bars, High Volume Churn and Low Volume Down bars (Testing). Pullbacks, in either up or down trends, are similar to market topping or bottoming patterns, but shorter in duration and with simpler volume patterns.
      FREE
      Exchange Chart Free
      Cesar Afif rezende Oaquim
      Exchange Chart Free   The ease of observing the market anytime, anywhere Exchange chart is the software for the professional trader to follow what happens in the financial market in real time. Developed by those in the market, it keeps up with the latest research on successful traders who show that the best, the ones who get consistent results use few types of chart configurations, in several different symbols. All market watch passing through your chart Exchange chart makes all the symbol
      FREE
      Strong movement levels
      Nikolay Mitrofanov
      5 (2)
      Looks for strong price movements and draws levels upon their completion. You determine the strength of the movement yourself by specifying in the settings the number of points and the number of candles of the same color in a row in one direction. There are 2 types of building in the settings: extrenum - high / low close - close price You can also adjust the number of displayed levels and the number of candles for calculations. By default, the settings indicate 5 levels for 360 candles.
      FREE
      LT Price Change
      Thiago Duarte
      4.88 (16)
      This is an informant indicator, very simple. It shows how much the price has chanded in percentage in certain period (month, week, day and actual period). It is discreet and small, does not visually posslute the chart. If your MT is not on portuguese idiom the indicator will automatically change to english. Check out our most complete tool for the market, the Trade Panel:  https://www.mql5.com/en/market/product/42658 If you have any suggestion or find any bug, please, contact us. Enjoy! This i
      FREE
      Market Momentum
      Flavio Javier Jarabeck
      3.86 (7)
      The Market Momentum indicator is based on the Volume Zone Oscillator (VZO), presented by Waleed Aly Khalil in the 2009 edition of the International Federation of Technical Analysts journal, and presents a fresh view of this market valuable data that is oftenly misunderstood and neglected: VOLUME. With this new approach of "seeing" Volume data, traders can infer more properly market behavior and increase their odds in a winning trade. "The VZO is a leading volume oscillator; its basic usefulnes
      FREE
      Colored Adaptive Moving Average AMA
      Flavio Javier Jarabeck
      4.75 (8)
      If you like to use traditional Moving Averages (like SMAs and EMAs) to provide your trades for dynamic levels of Support and Resistance, you will love the Adaptive Moving Average (AMA). Created in 1995 by Perry Kaufman and presented to the world in his book " Smarter   Trading :  Improving   Performance   in   Changing   Markets ", the Adaptive Moving Average (also known as KAMA - Kaufman Adaptive Moving Average) has the goal to be the perfect companion for following a trend without noise, but s
      FREE
      Girassol Sunflower MT5 Indicator
      Saullo De Oliveira Pacheco
      4.29 (7)
      This is the famous Sunflower indicator for Metatrader5. This indicator marks possible tops and bottoms on price charts. The indicator is free, so you can use and share at will :D. If you are looking for a professional programmer for Metatrader5, please contact me on my Instagram profile: Instagram: @saullo_algotrader have good trades. ......................
      FREE
      Activity Power
      Zoltan Nemet
      5 (4)
      Multi time frame, multy currency special swing volume indicator with engulfing waves too. Simpler to use compare to Weis Wave. User don't need to adjust wave size. Just use of the basic or the upper time frames. As a multi time frame indikator user can do  very complex time frame analysyses. As well as a multy currency indicator one can make market sector-segment analysyses. Use with Wckoff principles.
      FREE
      Cybertrade Keltner Channels
      Emanuel Andriato
      4.67 (3)
      Cybertrade Keltner Channels - MT5 Created by Chester Keltner, this is a volatility indicator used by technical analysis. It is possible to follow the trend of financial asset prices and generate support and resistance patterns. In addition, envelopes are a way of tracking volatility in order to identify opportunities to buy and sell these assets. It works on periods longer than the period visible on the chart. All values ​​are available in the form of buffers to simplify possible automations.
      FREE
      Stop Loss with Profit Free Version*. Complete Version here. This utility / expert for MetaTrader 5 modifies the stop loss of all your operations dynamically and automatically to ensure the minimum benefits you want, and be able to operate with or without Take Profit. Maximize your benefits, by being able to trade with Unlimited Take Profit. You will ensure the number of minimum points you want to earn in each operation and the stop loss will be adjusted as long as the benefit of the oper
      FREE
      DMC Average Volume
      Deibson Carvalho
      4 (1)
      516/5000 Average volume indicator to calculate the average volume for a given period. Useful as a filter to measure the strength of a trend, or false breaks in support or resistance. It does not give a signal to buy or sell, it only acts as a filter to avoid entering into transactions with a drop in volume, or below-average volume, which may indicate disinterest in trading at the price level. It has only the parameters of period, method of calculating the average and type of volume.
      FREE
      Demo Version of Strategy Manager Plus ! This Demo is a simply view of the Dashboard with the followings strategy :    - if SMA 6 is upper than SMA 18 --> Blue color    - if SMA 6 is lower than SMA 18 --> Red Color No need of the external GUI, Load configuration is not available, no manual trading is available. Visit  https://www.mql5.com/en/market/product/46420  for full version !
      FREE
      Free automatic Fibonacci is an indicator that automatically plots a Fibonacci retracement based on the number of bars you select on the BarsToScan setting in the indicator. The Fibonacci is automatically updated in real time as new highest and lowest values appears amongst the selected bars. You can select which level values to be displayed in the indicator settings. You can also select the color of the levels thus enabling the trader to be able to attach the indicator several times with differe
      FREE
      VWAP Simple
      Deibson Carvalho
      4 (32)
      The Volume Weighted Average Price is similar to a moving average, except volume is included to weight the average price over a period.    Volume-Weighted Average Price [VWAP] is a dynamic, weighted average designed to more accurately reflect  a security’s true average price over a given period . Mathematically, VWAP is the summation of money (i.e., Volume x Price) transacted divided by the total volume over any time horizon, typically from market open to market close. VWAP reflects the capital
      FREE
      Color Trend
      Bruno Goncalves Mascarenhas
      Combining the best of Price Action , Directional Movement , and Divergence / Convergence analysis, the Candle Color Trend is the easy and reliable way to identify the direction of the trend. The indicator automatically paints the candles according to the premise that the upward trend is defined by prices that form a series of ascending tops and bottoms. On the other hand, the downward trend is defined by prices that form a series of descending tops and bottoms. Color Trend is certainly one
      FREE
      Distance from Moving Average
      Leonardo Sposina
      5 (1)
      This indicator measures the largest distance between a price (high or low) and a moving average. It also shows the average distance above and below the moving average. It may come in handy for strategies that open reverse positions as price moves away from a moving average within a certain range, awaiting it to return so the position can be closed. It just works on any symbol and timeframe. Parameters: Moving average period : Period for moving average calculation. Moving average method : You can
      30 USD
      Measures the average price and Maximum Stop Loss accepted, adjustable Measures too the projected average price (For Pending entrys), in case you have a open position and pending orders to scale in shows how much it will increase or decrease the average price after fullfilling that pending orders! It shows too the Stop Loss based on the projected average entry, how much it has to be stoped out to fullfill your risk management, after fullfilling that pending orders
      FREE
      Supports And Resistances Lines
      Francisco Gomes Da Silva
      4.84 (25)
      지원 및 저항 구역 표시기 MT5 이 표시기는 상단과 하단을 자동으로 식별하는 방법을 알고 있습니다. 이 지지선과 저항선 표시기는 상단과 하단을 기준으로 지지선과 저항선을 만듭니다. 지지선과 저항선을 만드는 방법. 자동 지지선과 저항선을 만드는 지표입니다. 지표로 지원 수준을 찾는 방법 이 표시기는 자동으로 상단과 하단을 찾습니다. 지그재그(ZigZag)가 자동으로 바닥을 생성하거나 새로운 바닥을 이전 바닥보다 낮게 만들 때마다 표시기가 자동으로 지지선을 생성하므로 표시기가 자동으로 화면에 자동 지지선을 그립니다. 저항선을 만드는 방법. 지그재그(ZigZag)가 새로운 최고점이나 최고점을 이전 최고점보다 높게 만들 때마다 표시기가 지지선을 생성하는 것과 같은 방식으로 자동으로 저항선을 생성하므로 표시기가 자동으로 새로운 저항을 생성하므로 사용자가 상단과 하단 레벨이 어디에 있는지 걱정해야 합니다. 이 지표는 트레이더가 차트에 지지와 저항을 표시할 수 있는 쉬운 방법입니다. 상단 표시
      FREE
      Trendline mt5 indicator
      David Muriithi
      3 (1)
      Are you tired of drawing trendlines every time you're analyzing charts? Or perhaps you would like more consistency in your technical analysis. Then this is for you. This indicator will draw trend lines automatically when dropped on a chart. How it works Works similar to standard deviation channel found on mt4 and mt5. It has 2 parameters: 1. Starting Bar 2. Number of bars for calculation The   starting bar   is the bar which drawing of the trend lines will begin, while the   number of bars for c
      FREE
      This indicator uses a different approach from the previous version to get it's trendlines. This method is derived from Orchard Forex, and the process of making the indicator is demonstrated in there video   https://www.youtube.com/watch?v=mEaiurw56wY&t=1425s . The basic idea behind this indicator is it draws a   tangent line   on the highest levels and lowest levels of the bars used for calculation, while ensuring that the lines don't intersect with the bars in review (alittle confusing? I kno
      FREE
      Super Trend eu
      Emin Ulucanli
      5 (2)
      SUPERTREND; It is a trend following indicator based on the SuperTrend ATR created by Olivier Seban. It can be used to detect changes in trend direction and locate stops. When the price falls below the indicator curve, it turns red and indicates a downtrend. Conversely, when the price moves above the curve, the indicator turns green, indicating an uptrend. Like other indicators, it works well on SuperTrend when used in conjunction with other indicators such as MACD, parabolik SAR, Bollinger Band
      FREE
      Bar Color Trend
      Germano Chagas
      4.5 (10)
      Combining the best of Price Action , Directional Movement , and Divergence/Convergence analysis, Candle Color Trend is a easy and reliable way to identify trend direction. The indicator automatically paints the candles according to the assumption that an uptrend is defined by prices that form a series of higher highs and higher lows. In contrast, a downtrend is defined by prices that form a series of lower highs and lower lows. Additionally, ADX Wilder indicator is used to measure trend weakness
      FREE
      ISolz StochRSI
      Iqrar Hussain
      Ever wanted to use StochRSI on MetaTrader5 Terminal which you see and use on TradingView? Now you can use same StochRSI indicator in your MetaTrader5 and enjoy more time in Trading.. You can change StochRSI settings if you want to change and it will be ready to use for you... Now you will not go anywhere to use only indicator there... Open charts , load Indicator this Indicator and you are ready to do analysis in MetaTrader5 and Put Trades when you feel okay with your analysis.
      FREE
      이 제품의 구매자들이 또한 구매함
      Trade Assistant MT5
      Evgeniy Kravchenko
      4.45 (143)
      거래당 위험 계산, 라인을 사용한 손쉬운 신규 주문, 부분 청산 기능을 통한 주문 관리, 7가지 유형의 트레일링 스탑 및 기타 유용한 기능을 제공합니다. 주의, 응용 프로그램은 전략 테스터에서 작동하지 않습니다. 설명 페이지에서 데모 버전을 다운로드할 수 있습니다.  Manual, Description, Download demo 라인 기능       - 차트에 개시선, 손절매, 차익실현을 표시합니다. 이 기능을 사용하면 새로운 주문을 쉽게 하고 개봉 전에 추가 특성을 볼 수 있습니다. 위기 관리       -       위험 계산 기능은 설정된 위험과 손절매 주문의 크기를 고려하여 새 주문의 볼륨을 계산합니다. 이를 통해 손절매 크기를 설정하고 동시에 설정된 위험을 존중할 수 있습니다. 로트 계산 버튼 - 위험 계산을 활성화/비활성화합니다. 필요한 위험 값은 위험 필드에 0에서 100 사이의 백분율 또는 예금 통화로 설정됩니다. 설정 탭에서 위험 계산 옵션을 선택합니다.
      100 USD
      가격이 순식간에 변할 수 있는 시장에서 주문은 가능한 한 간단해야 한다고 생각하십니까? Metatrader에서는 주문을 열 때마다 시작 가격, 손절매 및 이익실현 및 거래 규모를 입력하는 창을 열어야 합니다. 금융 시장 거래에서 자본 관리는 초기 예금을 유지하고 곱하기 위해 필수적입니다. 따라서 주문을 하고 싶을 때 얼마나 큰 거래를 열어야 하는지 궁금할 것입니다. 이 단일 거래에서 위험을 감수해야 하는 예치금의 비율은 얼마입니까? 이 거래에서 얼마나 많은 이익을 얻을 수 있으며 위험 대비 이익 비율은 얼마입니까? 거래 규모를 설정하기 전에 거래 규모가 어떻게 되어야 하는지에 대한 질문에 대한 답을 얻기 위해 필요한 계산을 수행합니다. 이 모든 작업을 자동으로 수행하는 도구가 있다고 상상해 보십시오. 차트를 열고 시장 분석을 하고 진입점, 방어점(손절매) 및 목표(이익 실현)를 수평선으로 표시하고 마지막에 위험 수준을 정의합니다. 이 거래에서 감당할 수 있는 가용 자본의 %로, 이
      99 USD
      TradePanel MT5
      Alfiya Fazylova
      4.87 (87)
      Trade Panel은 빠르고 편리하게 거래를 하고 주문을 올바르게 관리할 수 있도록 도와주는 다기능 거래 도우미입니다. 이 유틸리티에는 거래를 위한 50개 이상의 기능이 포함되어 있으며 대부분의 거래 작업을 자동화할 수 있습니다. 각 거래 전에 위험을 계산할 필요가 없으며 유틸리티가 모든 것을 자체적으로 계산합니다. 위험 비율을 한 번만 지정하면 유틸리티가 최적의 로트를 선택하여 각 거래에 이 위험을 적용합니다. 레벨을 돌파하거나 주어진 시간에 도달하는 것과 같은 특정 이벤트를 기다릴 필요가 없습니다. 유틸리티에 대한 작업을 설치하기만 하면 됩니다. 지정된 이벤트가 발생하면 유틸리티 자체에서 필요한 거래 작업을 수행합니다. 예를 들어 패널은 가격이 수준을 넘을 때 주문을 열거나 지정된 시간에 주문을 닫습니다. 미결 주문에 대해 걱정할 필요가 없습니다. 유틸리티에는 필요한 모든 주문 지원 기능이 있습니다. 유틸리티는 주문에 후행 정지를 적용하거나 정지 손실을 손익분기점으로 이동하거나
      70 USD
      Fast Copy MT5
      Pavel Kolchin
      4.73 (94)
      이 프로그램을 사용하면 다른 MetaTrader 4와 MetaTrader 5 계정 간의 거래를 가능한 한 빠르고 쉽게 원하는 방향과 수량으로 로컬로 복사할 수 있습니다. 직관적인 인터페이스를 통해 추가 설명을 읽지 않고도 프로그램의 주요 설정을 빠르게 이해할 수 있으며 강력한 기능 까다로운 사용자의 요구도 만족시킬 것입니다. 이 프로그램은 "Windows PC" 및 "Windows VPS"에서 작동하도록 설계되었습니다. 모든 유형의 복사가 가능합니다. MT4 - MT5 MT4 - MT4 MT5 - MT5 MT5 - MT4 *다른 MT4 - MT5 단말기 간에 복사하려면 Fast Copy MT4+ Fast Copy MT5의 두 가지 버전을 구입해야 합니다. 주요 기능 트랜잭션 송수신을 위한 하나의 도구(복사기): 프로그램에서 [마스터] 또는 [슬레이브] 작동 모드를 선택할 수 있습니다. 하나의 제공자[마스터]는 트랜잭션을 여러 수신자[슬레이브]의 계정에 복사할 수 있습니다. 하나의
      55 USD
      Local Trade Copier EA MT5
      Juvenille Emperor Limited
      5 (43)
      Local Trade Copier EA MT5 를 사용하여 매우 빠른 거래 복사 경험을 해보세요. 1분 안에 간편하게 설정할 수 있으며, 이 거래 복사기를 사용하면 Windows 컴퓨터 또는 Windows VPS에서 여러 개의 MetaTrader 터미널 간에 거래를 0.5초 미만의 초고속 복사 속도로 복사할 수 있습니다. 초보자든 전문가든   Local Trade Copier EA MT5 는 다양한 옵션을 제공하여 사용자의 특정 요구에 맞게 맞춤 설정할 수 있습니다. 이는 수익 잠재력을 높이려는 모든 사람을 위한 최고의 솔루션입니다. 지금 사용해보시고 이것이 왜 시장에서 가장 빠르고 쉬운 무역용 복사기인지 알아보세요! 팁: 여기 에서 데모 계정에서 Local Trade Copier EA MT5 데모 버전을 다운로드하여 사용해 볼 수 있습니다. 다운로드한 무료 데모 파일을 MT5 >> File >> Open Data Folder >> MQL5 >> Experts 폴더에 붙여넣고
      50 USD
      Mentfx Mmanage mt5
      Anton Jere Calmes
      4.2 (5)
      Drag and Drop Trade Manager. Draw your entry and have the tool calculate the rest. Advanced targeting and close portions of a trade directly available in tool (manage trades while you sleep). Market order or limit order on either side with factored spread. Just draw the entry, the tool does the rest. Hotkey setup to make it simple. Draw where you want to enter, and the stop loss, the tool calculates all necessary risk with your desired % risk. Check out the video for a breakdown of how it looks
      300 USD
      The product will copy all telegram signal to MT5 ( which you are member) , also it can work as remote copier.  Easy to set up, copy order instant, can work with almost signal formats, image signal,  s upport to translate other language to English Work with all type of channel or group, even channel have "Restrict Saving Content", work with  multi channel, multi MT5 Work as remote copier: with signal have ticket number, it will copy exactly via ticket number. Support to backtest signal. How to s
      219 USD
      한 번의 클릭으로 거래할 수 있는 거래 패널.   위치 및 주문 작업!   차트 또는 키보드에서 거래. 거래 패널을 사용하면 차트에서 클릭 한 번으로 거래하고 표준 MetaTrader 컨트롤보다 30배 빠르게 거래 작업을 수행할 수 있습니다. 거래자의 삶을 더 쉽게 만들고 거래자가 훨씬 빠르고 편리하게 거래 활동을 수행할 수 있도록 도와주는 매개변수 및 기능의 자동 계산. 차트의 무역 거래에 대한 그래픽 팁 및 전체 정보. 열기 및 닫기, 반전 및 잠금, 부분 닫기/오토로트. 가상/실제 손절매/이익 실현/후행 정지/손익분기점, 주문 그리드 ... MetaТrader 5   의 주요 주문 거래 컨트롤 패널: 구매, 판매, 구매 중지, 구매 제한, 판매 중지, 판매 제한, 닫기, 삭제, 수정, 후행 중지, 손절매, 이익 실현. 5 탭   : 포지션 작업, 보류 중인 주문 작업, 계정 정보 작업, 시그널 패널, 총 이익 마감. 연결 МetaТrader 4 터미널용   이 패널 Vir

      50 USD
      Trade Manager to help you quickly enter and exit trades while automatically calculating your risk. Trades can be managed automatically and the account performance metrics can be visualised in a graph. These features make this panel ideal for all manual traders and it helps to enhance the MetaTrader 5 platform. MT4 Version , User Guide The Trade Manager does not work in the strategy tester. For a demo please message me Risk Management Automatic adjustment of risk based on % or $ Option to use
      80 USD
      Unlimited Trade Copier Pro MT5 is a tool to copy trade remotely between multiple MT4/MT5 accounts at different computers/locations over internet. This is an ideal solution for signal provider, who want to share his trade with the others globally on his own rules. One provider can copy trades to multiple receivers and one receiver can get trade from multiple providers as well. The provider can even set the subscription expiry for each receiver, so that receiver will not be able to receive the sig
      299 USD
      MT5 to Telegram Signal Provider 는 사용하기 쉽고 완전히 커스터마이즈 가능한 유틸리티로, 특정 신호를 Telegram의 채팅, 채널 또는 그룹으로 전송하고, 귀하의 계정을 신호 제공자 로 만듭니다. 경쟁 제품과 달리 DLL 임포트를 사용하지 않습니다. [ 매뉴얼 ] [ MT4 버전 ] [ 디스코드 버전 ] [ 텔레그램 채널 ] 설정 단계별 사용자 가이드 가 제공됩니다. 텔레그램 API에 대한 지식은 필요하지 않습니다; 개발자가 제공하는 모든 것이 필요합니다. 주요 특징 구독자에게 보낸 주문 상세 정보를 커스터마이즈할 수 있습니다. 예를 들어, 브론즈, 실버, 골드와 같은 계층 구독 모델을 만들 수 있습니다. 골드 구독에서는 모든 신호를 받습니다. id, 심볼, 또는 코멘트로 주문을 필터링할 수 있습니다. 주문이 실행된 차트의 스크린샷이 포함됩니다 보낸 스크린샷에 닫힌 주문을 그려 추가 검증을 합니다 새 주문 메시지를 보내기 전에 포지션을 조정할 수 있도
      59 USD
      Auto Trade Copier MT5 is designed to copy trades between multiple MT4/MT5 accounts/terminals with 100% accuracy. The provider and receiver accounts must be on the same PC/VPS. With this tool, you can act as either a provider (source) or a receiver (destination). All trading actions will be copied from the provider to the receiver with no delay. This version can be used on MT5 accounts only. For MT4 accounts, you must use Auto Trade Copier. Reference: If you need to copy between different locatio
      79 USD
      YuClusters
      Yury Kulikov
      4.93 (43)
      Attention: You can view the program operation in the free version  YuClusters DEMO .  YuClusters is a professional market analysis system. The trader has unique opportunities to analyze the flow of orders, trade volumes, price movements using various charts, profiles, indicators, and graphical objects. YuClusters operates on data based on Time&Sales or ticks information, depending on what is available in the quotes of a financial instrument. YuClusters allows you to build graphs by combining da
      285 USD
      Trade Dashboard MT5
      Fatemeh Ameri
      5 (12)
      Tired of complex order placement and manual calculations? Trade Dashboard is your solution. With its user-friendly interface, placing orders becomes effortless, by a single click, you can open trades, set stop loss and take profit levels, manage trade lot size, and calculate risk to reward ratios, allowing you to only focus on your strategy. Say goodbye to manual calculations and streamline your trading experience with Trade Dashboard. By purchasing this product you are entitled to receive one
      80 USD
      Advanced trading tool: One click smart orders that execute under your conditions Developed by trader for trading community:  position size calculator (lot size), open position after price action, strategy builder, set and forget trading, mobile notifications... Risk Management -  Risk percentage position size calculator, gain percentage, target risk reward ratio, spread and commissions are included in calculations 7 Advanced order types  - Set and forget trading with price action automation (O
      98 USD
      Equity Shield mt5
      Vladimir Stepanov
      5 (3)
      Expert Advisor 는 지속 으로 자산 을 모니터링 하고 의 입력 에 따라 규칙 을 준수 하여 못한 손실 로부터 귀하의 계정 을 보호 합니다 합니다.   규칙을 위반하면 EA는 모든 거래를 닫습니다.   특정 비율 또는 금전 적 손실로 거래 를 마감 하거나 비율 또는 금전 적 이익 으로 마감 하도록 하도록 를 설정 할 수 있습니다.   이 유틸리티는 프롭 트레이딩 챌린지에서 무승부를 낮게 유지하고 자산을 보호하는 데 매욋한! 내   신호 지원 및 사은품은 구매 후 연락주세요. 매개변수: 1 페어만 해당: 관리하려는 페어에 Equity Guard Equity Shield는 터미널의 모든 쌍을 제어합니다 TP at money (0: Off): TP in money SL at money (0:꺼짐): SL in money 계정 자본에서 %의TP: TP는 계정의 X% 이익으로 거래를 마감합니다. SL at % 시작하는 방법: 하나의 단일 차트에만 EA 로드 설정 사용자 지정
      45 USD
      Oracle
      Denis Sotnikov
      5 (2)
      Эксперт - торговый помощник, созданный по одноимённой торговой стратегии Оракул в сотрудничестве с ее автором Нео. Определяет на графиках в автоматическом режиме разворотные импульсные модели и строит по ним Вилки Нео - авторский инструмент, позволяющий определять циклы движения цены и указывающий на ожидаемую цель TakeProfit . Поиск ведется на всех заданных периодах графиков одновременно с фильтрацией совпадений. Осуществляется фильтрация неверных Вилок с указанием кода ошибки. Утилита имеет
      299 USD
      VR Watch list and Linker MT5
      Vladimir Pastushak
      4.83 (6)
      VR Watch list and Linker  – professional screener of financial instruments, designed for manual and semi-automatic search for the most liquid financial instruments in the MetaTrader 5 terminal. SCREENER ADVISOR DOES NOT WORK IN STRATEGY TESTER!!! How to get a trial version with a test period, instructions, training, read the blog https://www.mql5.com/ru/blogs/post/723833 . The screener links open charts to its own market overview, when changing the financial instrument in the market overview, th
      98 USD
      Trade Manager EA for MT5
      Odaine Ramon Mcmillan
      4 (6)
      Marketkeys Trade Manager: Your trusted partner on the journey to becoming a successful Forex trader. Imagine this: You're sitting at your desk, watching the market. The adrenaline is pumping. You've done your analysis, and you're ready to make your move. But the what-ifs are nagging at you. What if you overtrade? What if you exceed your risk limit? That's where our Trade Manager comes in. With its easy-to-use interface, it becomes an extension of you, automating the complex tasks and freeing yo
      30 USD
      Trade Assistant 38 in 1
      Makarii Gubaydullin
      4.92 (12)
      다기능 도구: 로트 계산기, 가격 조치, R/R 비율, 무역 관리자, 공급 및 수요 영역을 포함한 65개 이상의 기능 데모 버전   |   사용자 매뉴얼   |   MT5 버전 이 유틸리티는 전략 테스터에서 작동하지 않습니다.   여기에서 데모   버전을 다운로드하여 제품을 테스트할 수 있습니다. Contact me   질문/개선 아이디어가 있는 경우/버그가 발견된 경우   저에게 연락 하십시오. 거래 프로세스를 간소화, 가속화 및 자동화하십시오. 이 대시보드로 표준 터미널 기능을 확장하십시오. 유틸리티는 외환, 주식, 지수, 암호화폐 등 모든 거래 수단에서 작동합니다. 1. 새로운 거래 열기 : 로트/리스크/RR 계산: 1. Lot 계산기 (리스크 규모에 따른 거래량 계산) 2. 리스크 계산기 (로트 규모에 따른 리스크 금액) 3. 위험/보상 비율(RR) 4. 주문에 대한 활성화 트리거 + StopLimit 구매 / StopLimit 판매 5. 가상 SL / TP 레벨
      139 USD
      UTM Manager는 빠르고 효율적인 거래 실행을 제공하는 직관적이고 사용하기 쉬운 도구입니다. 눈에 띄는 기능 중 하나는 스프레드를 완전히 무시하고 양초 가격으로 거래할 수 있는 "스프레드 무시" 모드입니다(예: LTF에서 더 높은 스프레드 쌍을 거래할 수 있고 스프레드로 인해 거래에서 제외되는 것을 방지할 수 있음). UTM Manager의 또 다른 주요 측면은 고유한 로컬 거래 복사기로 각 브로커에서 다양한 거래 전략 및 설정(예: 다양한 TP, BE 및 위험 규칙)을 실행할 수 있는 유연성을 허용합니다. 거래 실행: 빠르고 효율적인 거래 실행: 차트에서 진입 및 손절매 가격을 클릭하여 쉽게 거래를 입력하거나 원클릭 고정 손절매 크기 기능을 사용하십시오. 자동 로트 크기 계산: 로트는 미리 정의된 위험 설정을 기반으로 계산되며 위치가 드래그하여 수정될 때 다시 계산됩니다. 하나 또는 여러 위치를 동시에 처리하는 기능. 이익 실현 및 손익분기점: 유연한 이익 실현 설정: 특
      90 USD
      Trade copier MT5
      Alfiya Fazylova
      4.41 (22)
      Trade Copier는 거래 계정 간의 거래를 복사하고 동기화하도록 설계된 전문 유틸리티입니다. 복사는 공급자의 계정/단말기에서 동일한 컴퓨터 또는 vps에 설치된 수신자의 계정/단말기로 발생합니다. 구매하기 전에 데모 계정에서 데모 버전을 테스트할 수 있습니다. 데모 버전 여기 . 전체 지침 여기 . 주요 기능 및 이점: 복사기는 "МТ5> МТ5", "МТ4> МТ5", "МТ5> МТ4" 복사를 지원합니다. 복사기는 데모 계정 > 실 계정, 실 계정 > 데모 계정, 데모 계정 > 데모 계정 및 실제 계정 > 실 계정 복사를 지원합니다. 복사기는 읽기 전용 암호가 적용된 투자자 계정에서 복사를 지원합니다. 하나의 공급자 터미널은 여러 수신 터미널로 트랜잭션을 보낼 수 있고 하나의 수신 터미널은 여러 공급자 터미널에서 트랜잭션을 수신할 수 있습니다. 복사기는 귀하 또는 귀하의 고문이 거래하는 동일한 터미널에서 작동할 수 있습니다. 높은 복사 속도(0.5초 미만). 복사기에는 간편
      40 USD
      Easy Order PRO MT5
      Yoshiki Takeuchi
      5 (2)
      개요 이동 라인만으로도 로트는 손실 컷 금액을 작성하여 자동으로 계산됩니다. 8 개의 통화 다음에 따라 계산할 수 있습니다. (USD, EUR, GBP, JPY, AUD, NZD, CHF, NZD) 고정 금액 또는 균형 비율을 선택할 수 있습니다. 위험 보상을 계산합니다. 시장 주문, 제한 주문 및 정지 주문이 자동으로 적용됩니다. FX, CFD 및 암호화 통화를 지원합니다. 주목 "무료 데모"는 작동하지 않습니다. 다음 페이지에서 데모 버전을 다운로드 할 수 있습니다.    https://www.mql5.com/en/blogs/post/750010 자세한 도구 설명은 위의 링크를 참조하십시오.
      30 USD
      Everything for chart Technical Analysis indicator mt5 in one tool Draw your supply demand zone with rectangle and support resistance with trendline and get alerts to mobile phone or email alert -  Risk reward indicator mt5 Video tutorials and manuals   here .  Find contacts on my   profile . 1.   Extended rectangles and trendlines Object will be extended to the right edge of the chart when price will draw new candles on chart. This is rectangle extender or trendline extender. 2. Price touch a
      88 USD
      Exp COPYLOT CLIENT for MT5
      Vladislav Andruschenko
      3.94 (16)
      MT5용 트레이드 복사기는 metaТrader 5 플랫폼용 트레이드 복사기입니다   . 그것은 사이의   외환 거래를 복사합니다       모든 계정   COPYLOT MT5 버전의 경우   MT5   -   MT5, MT4   -   MT5 (또는 COPYLOT MT4 버전의 경우   MT4 -   MT4 MT5   -  MT4) 믿을 수 있는 복사기! МТ4 터미널에서 거래를 복사할 수도 있습니다(   МТ4   -   МТ4, МТ5   -   МТ4   ):   COPYLOT CLIENT for MT4 이 버전은 МТ5   -   МТ5, МТ4   -   МТ5   터미널 간을 포함합니다. 거래 복사기는 2/3/10 터미널 사이의 거래/포지션을 복사하기 위해 만들어졌습니다. 데모 계정 및 투자 계정에서 복사가 지원됩니다. 프로그램은 여러 터미널 바인딩에서 실행할 수 있습니다. 하나의 계정에서 거래되는 다양한 투자자 계정 거래의 동기화 장치로 사용하십시오. - COPYLOT
      50 USD
      Seconds Chart MT5
      Boris Sedov
      4.44 (9)
      Seconds Chart — timeframes in seconds for MetaTrader 5. The utility allows you to create charts in the MetaTrader 5 terminal with a timeframe in seconds. The timeframe on such a chart is set in seconds, not in minutes or hours. Thus, you can create charts with a timeframe less than M1. For example, S15 is a timeframe with a period of 15 seconds. You can apply indicators, Expert Advisors and scripts to the resulting chart. You get a fully functional chart on which you can work just as well as on
      30 USD
      FTMO Sniper 7
      Vyacheslav Izvarin
      Dedicated for FTMO and other Prop Firms Challenges 2020-2023 Trade only GOOD and checked PROP FIRMS  Default parameters for Challenge $100,000 Best results on GOLD and US100  Use any Time Frame Close all deals and Auto-trading  before  US HIGH NEWS, reopen 2 minutes after Close all deals and Auto-trading  before Weekend at 12:00 GMT+3  Friday Recommended time to trade 09:00-21:00 GMT+3 For Prop Firms MUST use special  Protector  https://www.mql5.com/en/market/product/94362 ------------------
      3 500 USD
      Comprehensive on chart trade panel with the unique ability to be controllable from mobile as well. Plus has a library of downloadable configuration, e.g. exit rules, extra panel buttons, pending order setup and more. Please see our product video. Works with all symbols not just currency pairs. Features On chart panel plus controllable from free app for Windows, iPhone and Android Built-in script engine with library of downloadable configuration, e.g. add 'Close All Trades in Profit' button, exit
      99 USD
      News Trade EA MT5
      Konstantin Kulikov
      4.44 (9)
      제가 몇 년 동안 사용하고 있는 유용한 로봇을 소개드립니다. 반자동뿐만 아니라 자동 모드로도 사용할 수 있습니다. 본 프로그램에는 경제 캘린더의 뉴스별로 유연한 거래 설정이 포함되어 있습니다. 전략 테스터에서 확인할 수 없습니다. 진짜 작업뿐입니다. 터미널 설정에서 허용된 URL 목록에 뉴스 사이트를 추가해야 합니다. 서비스>설정 > 조언자>를 클릭합니다. "다음 URL에 대해 WebRequest 허용:" 확인란을 선택합니다. 다음을 추가합니다 (공백 삭제): https://  ec.forexprostools.com/ 자동 모드 시 기본 설정 관리: https://www.mql5.com/ko/signals/1447007 . 동일한 결과를 얻으려면 임의 기간 (기간이 얼마정도인지 상관 없음)의 GBPUSD 차트에 전문가를 첨부하십시오. 이 전문가를 위해 고유 설정 세트를 만들 때 블로그의 모든 매개변수에 대한 설명을 참조하십시오: https://www.mql5.com/en
      97 USD
      거래 패널은 주문 관리로 제한됩니다. 버튼을 사용하여 열거나 사용자가 열 수 있습니다. 컬렉션에서 간단하고 편리합니다. 모든 구매자를 보완합니다. Gold Stuff 표시기와 함께 사용하는 것이 좋습니다. 단일 주문으로 거래를 설정하고 거리가 있는 그리드를 구축하십시오. 표준 그리드를 만들려면 10000과 같이 큰 거리를 설정하기만 하면 됩니다. 실시간 결과는 여기에서 볼 수 있습니다. 설정 및 개인 보너스를 받으려면 구매 후 즉시 저에게 연락하십시오!   설정 새 시리즈 열기 - 새 주문 시리즈의 온/오프 시작. Lot miltiplier - 다음 주문에 대한 로트 승수. TP - 핍으로 이익을 얻습니다. SL - 손절매, 첫 주문부터 핍 단위. 트레일 시작 - 트레일링 스톱 활성화. 트레일 스텝 - 트레일링 스톱을 활성화할 때 가격으로부터의 거리. DD 감소 알고리즘 - 수익이 있는 마지막 주문이 손실이 있는 첫 번째 주문 시리즈와 마감될 때 손실 감소 알고리즘입
      50 USD
      제작자의 제품 더 보기
      Candle Timer Countdown
      JETINVEST
      4.79 (57)
      캔들 타이머 카운트다운은 현재 막대가 닫히고 새 막대가 형성되기까지 남은 시간을 표시합니다. 시간 관리에 사용할 수 있습니다. MT4 버전은 여기 ! 기능 하이라이트 현지 시간이 아닌 서버 시간을 추적합니다. 구성 가능한 텍스트 색상 및 글꼴 크기 기호 일일 변동의 선택적 시각화 CPU 사용량을 줄이기 위해 최적화 입력 매개변수 일별 편차 표시: 참/거짓 텍스트 글꼴 크기 텍스트 색상 여전히 질문이 있는 경우 다이렉트 메시지로 저에게 연락하십시오.   https://www.mql5.com/ko/users/robsjunqueira/ 이것이 우리가 지속적으로 발전 할 수있는 유일한 방법이기 때문에 개선을위한 제안에 부담없이 문의하십시오. 또한 당사의 다른 지표 및 전문 고문에 대해 알아보십시오. 다양한 유형의 자산을 거래할 수 있는 다양한 상품이 있음을 알 수 있습니다.
      FREE
      MACD Intraday Trend
      JETINVEST
      4.74 (39)
      MACD 장중 추세는 1960년대 Gerald Appel이 만든 원본 MACD를 개조하여 개발한 지표입니다. 수년간의 거래를 통해 MACD의 매개변수를 피보나치 비율로 변경함으로써 추세 움직임의 연속성을 더 잘 표현함으로써 가격 추세의 시작과 끝을 보다 효율적으로 감지할 수 있다는 것이 관찰되었습니다. 가격 추세를 감지하는 효율성으로 인해 상단과 하단의 차이를 매우 명확하게 식별하여 거래 기회를 더 잘 활용할 수도 있습니다. 구성 가능한 기능과 경고가 있는 전문가용 버전을 사용해 보십시오: MACD Intraday Trend PRO 특징 모든 통화 쌍에서 작동 모든 시간대에 작동 Renko 차트와 함께 작동 여전히 질문이 있는 경우 다이렉트 메시지로 저에게 연락하십시오.   https://www.mql5.com/ko/users/robsjunqueira/
      FREE
      캔들 타이머 카운트다운은 현재 막대가 닫히고 새 막대가 형성되기까지 남은 시간을 표시합니다. 시간 관리에 사용할 수 있습니다. MT5 버전은 여기 ! 기능 하이라이트 현지 시간이 아닌 서버 시간을 추적합니다. 구성 가능한 텍스트 색상 및 글꼴 크기 기호 일일 변동의 선택적 시각화 CPU 사용량을 줄이기 위해 최적화 입력 매개변수 일별 편차 표시: 참/거짓 텍스트 글꼴 크기 텍스트 색상 여전히 질문이 있는 경우 다이렉트 메시지로 저에게 연락하십시오.   https://www.mql5.com/ko/users/robsjunqueira/ 이것이 우리가 지속적으로 발전 할 수있는 유일한 방법이기 때문에 개선을위한 제안에 부담없이 문의하십시오. 또한 당사의 다른 지표 및 전문 고문에 대해 알아보십시오. 다양한 유형의 자산을 거래할 수 있는 다양한 상품이 있음을 알 수 있습니다.
      FREE
      MACD Intraday Trend PRO는 1960년대 Gerald Appel이 만든 원본 MACD를 개조하여 개발한 지표입니다. 수년간의 거래를 통해 MACD의 매개변수를 피보나치 비율로 변경함으로써 추세 움직임의 연속성을 더 잘 표현함으로써 가격 추세의 시작과 끝을 보다 효율적으로 감지할 수 있다는 것이 관찰되었습니다. 가격 추세를 감지하는 효율성으로 인해 상단과 하단의 차이를 매우 명확하게 식별하여 거래 기회를 더 잘 활용할 수도 있습니다. 특징 표시기 MACD Intraday Trend PRO는 모든 통화 쌍, 모든 시간대 및 Renko 차트에서 작동합니다. 5가지 모드를 선택하여 추세 감지 속도를 설정할 수 있습니다. 가장 빠른 빠른 정상 느린 가장 느림 자원 6개의 구성 가능한 경고가 있습니다. MACD는 신호 라인에서 후퇴 MACD가 신호선을 넘다 MACD는 레벨 0을 교차 신호선이 레벨 0을 넘습니다. MACD 변경 트렌드 색상 신호선 변경 TRE
      77 USD
      Pivot Point Fibo RSJ
      JETINVEST
      4.29 (17)
      피봇 포인트 Fibo RSJ는 피보나치 비율을 사용하여 당일의 지지선과 저항선을 추적하는 지표입니다. 이 멋진 지표는 피보나치 비율을 사용하여 피벗 포인트를 통해 최대 7단계의 지지와 저항을 생성합니다. 가격이 작업의 가능한 진입/종료 지점을 인식할 수 있는 이 지원 및 저항의 각 수준을 어떻게 존중하는지 환상적입니다. 특징 최대 7단계 지원 및 7단계 저항 레벨의 색상을 개별적으로 설정 입력 피벗 유형 피벗 피보 RSJ1 = 피보 비율 1 계산 피벗 피보 RSJ2 = 피보 비율 2 계산 피벗 Fibo RSJ3 = Fibo 비율 3 계산 피벗 피보 클래식 = 클래식 피벗 계산 최소 피벗 수준 피벗 3 레벨 피벗 4 레벨 피벗 5 레벨 6단계 피벗 피벗 7 레벨 여전히 질문이 있는 경우 다이렉트 메시지로 저에게 연락하십시오: https://www.mql5.com/ko/users/robsjunqueira/
      FREE
      Tabajara VWAP Ogro RSJ
      JETINVEST
      4.81 (31)
      Setup Tabajara는 "월스트리트의 OGRO"로 알려진 브라질 상인이 만들었습니다. 이 설정의 아이디어는 거래자에게 현재 가격 추세와 그래프에서 찾아야 하는 작업 유형을 나타내는 것입니다. 작업 이것은 오전 10시 40분까지 양초와 VWAP를 닫는 위치를 지정하고 그 이후에 4가지 색상으로 양초를 칠하는 20주기의 산술 평균으로 수행합니다. 녹색 -> 가격 상승 추세 (구매 진입점 검색) 검은색 -> 강세 추세에서 가격 수정(구매 진입점 검색) 빨간색 -> 하락 추세에 있는 가격 (매도 진입점 검색) 흰색 -> 하락세 시 가격 조정 (판매 진입점 검색) 또한 스크립트에 다음 표시기를 넣었습니다. 8 기간의 지수 평균: 단기 가격 움직임 식별 50개 기간의 산술 평균: 중기 가격 움직임 식별 80 기간의 지수 평균: 중기 가격 움직임 식별 200개 기간의 산술 평균: 장기 가격 움직임 식별 여전히 질문이 있는 경우 다이렉트 메시지로 저에게 연락하십시오: https:
      FREE
      Sniper Major
      JETINVEST
      5 (1)
      EA는 변동성, 스프레드, 빈도 및 타이밍을 사용하여 거래 시기를 결정합니다. EA는 지정가 주문 방법을 사용하여 포지션을 엽니다. 이 경우 Slippage는 항목을 실행할 때 기껏해야 긍정적일 것입니다. EA는 시스템의 초점이 자본을 보호하면서 돈을 버는 것이므로 Trailing Take Profit 논리를 사용합니다. 대부분의 거래는 저격 헤드샷처럼 빠르게 마감됩니다. 주요 특징 마틴게일을 사용하지 않습니다 그리드를 사용하지 않음 최적화된 통화 쌍: EURUSD | GBPUSD | 엔엔 | USDCHF 기간: M5 주의 사항: 이 EA는 롤오버 전 몇 분부터 롤오버 후 몇 분까지 하루에 일정 범위의 시간 동안만 거래합니다. 하나의 차트 설정: 모든 최적화된 기호를 거래하려면 하나의 차트만 있으면 됩니다. 여러 통화 쌍 지원 .set 파일이 필요하지 않으며 모든 설정이 EA에 저장됩니다. 브로커가 접미사(예: XXXXXX.a)를 사용하는 경우 EA가 자동으로 식별하므로 걱정하
      247 USD
      캔들 카운터는 그 날의 첫 캔들부터 캔들 개수를 출력하는 인디케이터입니다. 오늘의 첫 번째 양초는 숫자 1이 되며 새 양초는 이 개수에서 1씩 증가합니다. 입력 매개변수 짝수, 홀수 또는 모두에서 선택 촛불에서 숫자 인쇄까지의 거리 텍스트 글꼴 크기 텍스트 글꼴 색상 여전히 질문이 있는 경우 다이렉트 메시지로 저에게 연락하십시오.   https://www.mql5.com/ko/users/robsjunqueira/ ----------------- 이것이 우리가 지속적으로 발전 할 수있는 유일한 방법이기 때문에 개선을위한 제안에 부담없이 문의하십시오. 또한 당사의 다른 지표 및 전문 고문에 대해 알아보십시오. 다양한 유형의 자산을 거래할 수 있는 다양한 상품이 있음을 알 수 있습니다.
      FREE
      MACD Intraday Trend MT4
      JETINVEST
      4.71 (17)
      MACD 장중 추세는 1960년대 Gerald Appel이 만든 원본 MACD를 개조하여 개발한 지표입니다. 수년간의 거래를 통해 MACD의 매개변수를 피보나치 비율로 변경함으로써 추세 움직임의 연속성을 더 잘 표현함으로써 가격 추세의 시작과 끝을 보다 효율적으로 감지할 수 있다는 것이 관찰되었습니다. 가격 추세를 감지하는 효율성으로 인해 상단과 하단의 차이를 매우 명확하게 식별하여 거래 기회를 더 잘 활용할 수도 있습니다. 구성 가능한 기능과 경고가 있는 전문가용 버전을 사용해 보십시오:   MACD Intraday Trend PRO 특징 모든 통화 쌍에서 작동 모든 시간대에 작동 Renko 차트와 함께 작동 여전히 질문이 있는 경우 다이렉트 메시지로 저에게 연락하십시오.   https://www.mql5.com/ko/users/robsjunqueira/
      FREE
      피봇 포인트 Fibo RSJ는 피보나치 비율을 사용하여 당일의 지지선과 저항선을 추적하는 지표입니다. 이 멋진 지표는 피보나치 비율을 사용하여 피벗 포인트를 통해 최대 7단계의 지지와 저항을 생성합니다. 가격이 작업의 가능한 진입/종료 지점을 인식할 수 있는 이 지원 및 저항의 각 수준을 어떻게 존중하는지 환상적입니다. 특징 최대 7단계 지원 및 7단계 저항 레벨의 색상을 개별적으로 설정 입력 피벗 유형 피벗 피보 RSJ1 = 피보 비율 1 계산 피벗 피보 RSJ2 = 피보 비율 2 계산 피벗 Fibo RSJ3 = Fibo 비율 3 계산 피벗 피보 클래식 = 클래식 피벗 계산 최소 피벗 수준 피벗 3 레벨 피벗 4 레벨 피벗 5 레벨 6단계 피벗 피벗 7 레벨 여전히 질문이 있는 경우 다이렉트 메시지로 저에게 연락하십시오: https://www.mql5.com/ko/users/robsjunqueira/
      FREE
      Trend WIN B3
      JETINVEST
      5 (4)
      Trend WIN B3는 MT5 플랫폼용으로 제작된 전문 거래 시스템으로 BRAZIL B3의 MINI FUTURE INDEX(WIN)와 함께 작동하도록 최적화되어 있습니다. 시스템은 여러 시간대(1M, 5M, 15M, 30M, H1, H4, D1)에서 Fuzzy Logic을 사용하여 계산에 따라 각 시간대에 가중치를 적용하여 가격 추세를 식별합니다. 추세를 파악한 후 시스템은 평균 변동성에 따라 STOP 주문(BUY 또는 SELL)을 포지셔닝하고, 포지션이 열리면 EA는 항상 이익 극대화를 추구하는 트레일링 스톱(trailing stop)을 통해 거래를 수행합니다. 주요 특징 마틴게일을 사용하지 않음 그리드를 사용하지 않음 Fuzzy 알고리즘으로 계산된 추세를 그래프에 표시 모든 시간대에 작동 구성 가능한 운영 시간 구성 가능한 개방 GAP 제어 구성 가능한 로트 증대 동적 모드 4개의 구성 가능한 트레일링 스톱 레벨 제품 설명서와 동영상이 있는 블로그에 접속하여 더 자세한
      347 USD
      Weis Waves RSJ
      JETINVEST
      4.63 (8)
      The Weis Waves RSJ Indicator sums up volumes in each wave. This is how we receive a bar chart of cumulative volumes of alternating waves. Namely the cumulative volume makes the Weis wave charts unique. It allows comparing the relation of the wave sequence characteristics, such as correspondence of the applied force (expressed in the volume) and received result (the price progress). If you still have questions, please contact me by direct message:  https://www.mql5.com/en/users/robsjunqueira/
      FREE
      Tabajara Ogro
      JETINVEST
      4.75 (12)
      Setup Tabajara was created by a Brazilian trader known as  "The OGRO of Wall Street" . The idea of this setup is to indicate to the trader the current trend of prices and  the type of operation should be looked for in the graph. Operation It does this through the relation of the closing price position and the     of 20 periods, by painting the candles in 4 possible colors : Green -> Price rising in upward trend (Search entry points for PURCHASE) Black -> Price correcting in Bullish Trend
      FREE
      VWAP Fibo Bands RSJ
      JETINVEST
      4.91 (11)
      VWAP Fibo Bands RSJ is an indicator that traces the lines of the daily VWAP and from it creates bands using Fibonacci proportions. This spectacular indicator creates 10 band levels through the selected VWAP period using Fibonacci ratios. It is fantastic how the prices respect each level of the bands, where it is possible to realize that almost every time the price closes above / below a level of the bands he will seek the next one. If close above will seek to reach the level above and if close
      FREE
      MACD Intraday Trend PRO는 1960년대 Gerald Appel이 만든 원본 MACD를 개조하여 개발한 지표입니다. 수년간의 거래를 통해 MACD의 매개변수를 피보나치 비율로 변경함으로써 추세 움직임의 연속성을 더 잘 표현함으로써 가격 추세의 시작과 끝을 보다 효율적으로 감지할 수 있다는 것이 관찰되었습니다. 가격 추세를 감지하는 효율성으로 인해 상단과 하단의 차이를 매우 명확하게 식별하여 거래 기회를 더 잘 활용할 수도 있습니다. 특징 표시기 MACD Intraday Trend PRO는 모든 통화 쌍, 모든 시간대 및 Renko 차트에서 작동합니다. 5가지 모드를 선택하여 추세 감지 속도를 설정할 수 있습니다. 가장 빠른 빠른 정상 느린 가장 느림 자원 6개의 구성 가능한 경고가 있습니다. MACD는 신호 라인에서 후퇴 MACD가 신호선을 넘다 MACD는 레벨 0을 교차 신호선이 레벨 0을 넘습니다. MACD 변경 트렌드 색상 신호선 변경 TRE
      77 USD
      SniperBot EURUSD
      JETINVEST
      5 (1)
      EA는 변동성, 스프레드, 빈도 및 타이밍을 사용하여 거래 시기를 결정합니다. EA는 지정가 주문 방법을 사용하여 포지션을 엽니다. 이 경우 Slippage는 항목을 실행할 때 기껏해야 긍정적일 것입니다. EA는 시스템의 초점이 자본을 보호하면서 돈을 버는 것이므로 Trailing Take Profit 논리를 사용합니다. 대부분의 거래는 저격 헤드샷처럼 빠르게 마감됩니다. 주요 특징 마틴게일을 사용하지 않습니다 그리드를 사용하지 않음 최적화된 통화 쌍: EURUSD 기간: M5 주의 사항: 이 EA는 롤오버 전 몇 분부터 롤오버 후 몇 분까지 하루에 일정 범위의 시간 동안만 거래합니다. .set 파일이 필요하지 않으며 모든 설정이 EA에 저장됩니다. 브로커가 접미사(예: XXXXXX.a)를 사용하는 경우 EA가 자동으로 식별하므로 걱정하지 않아도 됩니다. 설치하는 방법 이 시스템은 독립형이며 VPS에서 지속적으로 실행되어야 합니다. 낮은 스프레드 ECN 브로커에서 EA를
      137 USD
      Trend WDO B3
      JETINVEST
      5 (2)
      Trend WDO B3는 MT5 플랫폼용으로 제작된 전문 거래 시스템으로 BRAZIL B3의 MINI DOLAR INDEX(WDO)와 함께 작동하도록 최적화되어 있습니다. 시스템은 여러 시간대(1M, 5M, 15M, 30M, H1, H4, D1)에서 Fuzzy Logic을 사용하여 계산에 따라 각 시간대에 가중치를 적용하여 가격 추세를 식별합니다. 추세를 파악한 후 시스템은 평균 변동성에 따라 STOP 주문(BUY 또는 SELL)을 포지셔닝하고, 포지션이 열리면 EA는 항상 이익 극대화를 추구하는 트레일링 스톱(trailing stop)을 통해 거래를 수행합니다. 주요 특징 마틴게일을 사용하지 않음 그리드를 사용하지 않음 Fuzzy 알고리즘으로 계산된 추세를 그래프에 표시 모든 시간대에 작동 구성 가능한 운영 시간 구성 가능한 개방 GAP 제어 구성 가능한 로트 증대 동적 모드 4개의 구성 가능한 트레일링 스톱 레벨 제품 설명서와 동영상이 있는 블로그에 접속하여 더 자세한 정
      347 USD
      Vwap RSJ
      JETINVEST
      4.92 (13)
      VWAP RSJ is an indicator that plots the Hourly, Daily, Weekly and Monthly  VWAP Lines. Large institutional buyers and   mutual funds   use the VWAP ratio to help move into or out of stocks with as small of a market impact as possible. Therefore, when possible, institutions will try to buy below the VWAP, or sell above it. This way their actions push the price back toward the average, instead of away from it. Based on this information I developed this indicator that combines 4 types of VWAP T
      FREE
      This simple indicator paints with a darker color on the volume bar when the quantity traded is above the average of select number of periods of the volume itself, highlighting the moments when there was a large volume of deals above the average. It is also possible to use a configuration of four colors where the color tone shows a candle volume strength. The indicator defaults to the simple average of 20 periods, but it is possible to change to other types of averages and periods. If you like
      FREE
      RENKO PRICE ACTION ATR은 각 BRICK이 사용자가 선택한 기간의 ATR을 통해 계산된 크기를 갖는 Renko Chart의 구성을 통해 개발된 "Expert Advisor"입니다. Renko 차트는 사소한 가격 변동을 걸러내도록 설계되어 거래자가 중요한 추세에 더 쉽게 집중할 수 있습니다. 가격 추세를 감지하는 효율성으로 인해 지지와 저항, 상단 및 하단 다이버전스를 명확하게 식별하여 거래 기회를 더 잘 활용할 수도 있습니다. 작업 RENKO PRICE ACTION ATR은 모든 통화 쌍에서 작동합니다. RENKO PRICE ACTION ATR은 실시간 업데이트 성능이 뛰어납니다. 설정 ATR 계산 기간: RENKO PRICE ACTION ATR이 ATR의 평균을 적용하고 각 BRICK의 크기를 계산/재계산하기 위해 사용자가 선택한 기간입니다. ATR 계산 평균 기간: 각 BRICK에 대한 크기 계산을 수행하기 위해 RENKO PRICE ACTION ATR에
      47 USD
      This indicator calculates the difference between the SELL aggression and the BUY aggression that occurred in each Candle, plotting the balance of each one graphically. Note: This indicator DOES NOT WORK for Brokers and/or Markets WITHOUT the type of aggression (BUY or SELL). Be sure to try our   Professional   version with configurable features and alerts:   Delta Agression Volume PRO Settings Aggression by volume (Real Volume) or by number of trades (Tick Volume) Start of the Aggression De
      FREE
      Aggression Wave RSJ
      JETINVEST
      4.38 (8)
      This indicator sums up the difference between the sells aggression and the buys aggression that occurred in each Candle, graphically plotting the waves of accumulation of the aggression volumes.   Through these waves an exponential average is calculated that indicates the direction of the business flow. Note: This indicator DOES NOT WORK for Brokers and/or Markets WITHOUT the type of aggression (BUY or SELL).   Be sure to try our Professional version with configurable features and alerts:  Agr
      FREE
      Volume By Color RSJ
      JETINVEST
      4.5 (4)
      This simple indicator paints with a darker color on the volume bar when the quantity traded is above the average of select number of periods of the volume itself, highlighting the moments when there was a large volume of deals above the average. It is also possible to use a configuration of four colors where the color tone shows a candle volume strength. The indicator defaults to the simple average of 20 periods, but it is possible to change to other types of averages and periods. If you like
      FREE
      Delta Aggression Volume PRO is an indicator developed to monitor the strength and continuity of the aggression volume of sell and buy negotiations. Note: This indicator DOES NOT WORK for Brokers and/or Markets WITHOUT the type of aggression (BUY or SELL). Cryptocurrencies and Forex do not provide this type of data, that is, it does not work with them. O Delta Agrression Volume PRO has features that allow you to view beyond the delta volume of the day. Operation Multi symbols  (those who pro
      77 USD
      지표 공급 수요 RSJ PRO는 그래프에 "공급" 및 "수요" 영역을 계산하고 표시하여 영역 유형(약함, 강함, 확인됨, 입증됨)을 식별하고 영역을 다시 테스트하는 경우 몇 번인지 보여줍니다. 재시험했다. "공급" 구역은 수요보다 공급이 더 많이 발생하여 가격을 낮추는 가격 구역입니다. "수요" 구역은 공급보다 많은 수요가 발생하여 가격을 상승시키는 가격 구역입니다. 구성 가능한 기능 및 경고가 포함된 전문가용 버전을 사용해 보십시오: Suppy Demand RSJ PRO 구역 분류 약함: 다시 테스트할 경우 위반될 가능성이 있는 가격 영역입니다. 강함: 추세의 방향을 변경했고 그렇게 빨리 재시험될 가능성이 없는 가격 영역. 검증됨: 최대 1~3번의 재테스트가 있었지만 가격이 해당 영역을 깰 수 없는 강한 가격 영역. 입증됨: 3회 이상의 재시험이 있었지만 가격이 해당 지역을 돌파하지 못한 강한 가격 영역. Broken/Turncoat: 지지의 경우 저항이 되고 지지
      47 USD
      Aggression Wave PRO is an indicator developed to monitor the divergence, strength, and continuity of the aggression volume of sell and buy negotiations.  The  Agrression Wave PRO   has features that allow you to view beyond the accumulated delta volume of the day. Note: This indicator DOES NOT WORK for Brokers and/or Markets WITHOUT the type of aggression (BUY or SELL). Cryptocurrencies and Forex do not provide this type of information, that is, it does not work with it. Operation It is pos
      77 USD
      지표 공급 수요 RSJ PRO는 그래프에 "공급" 및 "수요" 영역을 계산하고 표시하여 영역 유형(약함, 강함, 확인됨, 입증됨)을 식별하고 영역을 다시 테스트하는 경우 몇 번인지 보여줍니다. 재시험했다. "공급" 구역은 수요보다 공급이 더 많이 발생하여 가격을 낮추는 가격 구역입니다. "수요" 구역은 공급보다 많은 수요가 발생하여 가격을 상승시키는 가격 구역입니다. 구역 분류 약함: 다시 테스트할 경우 위반될 가능성이 있는 가격 영역입니다. 강함: 추세의 방향을 변경했고 그렇게 빨리 재시험될 가능성이 없는 가격 영역. 검증됨: 최대 1~3번의 재테스트가 있었지만 가격이 해당 영역을 깰 수 없는 강한 가격 영역. 입증됨: 3회 이상의 재시험이 있었지만 가격이 해당 지역을 돌파하지 못한 강한 가격 영역. Broken/Turncoat: 지지의 경우 저항이 되고 지지의 경우 저항이 되는 깨지는 가격 영역입니다. 설정 시각적 설정: 약한 영역 표시: 약한 영역으로 분류된 영역이 표시
      77 USD
      필터:
      Nitirojn Vichaikasampong
      97
      Nitirojn Vichaikasampong 2021.07.25 07:36 
       

      good

      JETINVEST
      213805
      개발자의 답변 Roberto Sant Ana Junqueira 2021.07.25 13:36
      tks
      Renan Fernandes Souza
      178
      Renan Fernandes Souza 2021.07.15 11:00 
       

      Esta boleta é uma ferramenta essencial para o trader que quer otimizar as suas operações. Parabéns Roberto, ficou muito bom.

      JETINVEST
      213805
      개발자의 답변 Roberto Sant Ana Junqueira 2021.07.25 13:36
      Muito obrigado.
      Fabio_Novaes
      175
      Fabio_Novaes 2021.06.30 21:40 
       

      show demais.

      JETINVEST
      213805
      개발자의 답변 Roberto Sant Ana Junqueira 2021.06.30 23:09
      tks
      Marilise Ravaglio Da Cunha Junqueira
      386
       

      사용자가 평가에 대한 코멘트를 남기지 않았습니다

      JETINVEST
      213805
      개발자의 답변 Roberto Sant Ana Junqueira 2021.06.30 15:59
      Tks for your review.
      FLX700
      16
      FLX700 2021.06.05 16:49 
       

      Roberto, em primeiro lugar parabéns pelo excelente trabalho. Sua ferramenta é excelente, na minha opinião ela é indiscutivelmente a melhor entre as gratuitas, eu a avalio com 4.5 de 5. Gostaria de fazer 3 sugestões/críticas para o aprimoramento da mesma. Eu senti falta de um recurso que para mim é o mais importante que é abrir ordens pelo risco e não apenas por lote. Gostaria de ter a opção "RISK %" pois no meu modo trabalhar essa opção é essencial. Outra coisa que sinto muita falta é o stop e gain poderem ser baseados no ATR o que facilita bastante no gerenciamento. E a terceira é apenas um pequeno detalhe. Acho que a boleta poderia ser um pouco mais estreita, pois acho que ela ocupa muito espaço. Espero que esse comentário possa ajudar nos aprimoramentos futuros. No mais, parabéns pelo trabalho. Forte abraço e sucesso!

      JETINVEST
      213805
      개발자의 답변 Roberto Sant Ana Junqueira 2021.06.05 16:56
      Bom dia. Muito obrigado pelos comentários. Vou rever sobre ser mais estreita, pois na verdade testei com vários ativos de forex, crypto e os daqui do Brasil, e dependendo (principalmente no Dólar e Índice) do tamanho de lote o espaço mínimo era este para que todas as informações ficassem bem visíveis sem ter que reduzir a fonte. Sobre as outras opções elas vão existir na versão PRO que lançarei nos próximos dias.
      리뷰 답변