Renko Ultimate
- 지표
- Paulo Henrique Faquineli Garcia
- 버전: 1.6
- 업데이트됨: 9 6월 2021
- 활성화: 5
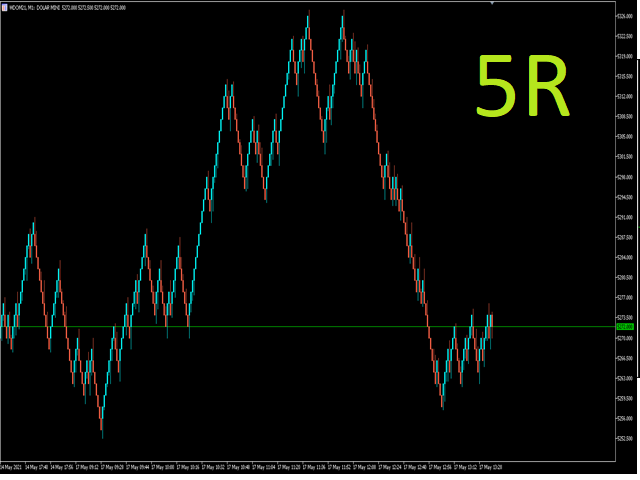
This indicator creates the perfect RENKO for you to work with timeless types of Candles! Due to RENKO characteristics of timeless, the indicator adjusts trading arrows (otherwise they would be lost) and leaves them exactly where the negotiation occurred in Renko Candles! In addition, this indicator shows exactly the division between days, in order to make it clear to user where each trading session started and ended!
Important details:
- The automatically generated RENKO has an accuracy of up to 95% for small renkos (5R) and 100% accuracy for larger Renkos (from 10R) when compared to RENKO's own platforms (ProfitChart, TradingVIEW etc);
- The RENKO generated during trading hours is 100% accurate because it uses the trades ticks received on user platform as a data source!
- If you want to generate a REAL History, just go to "Strategy Tester" and run on "EVERY TICK IS BASED ON A REAL TICK";
- Unlike ALL others available on the MT5, this RENKO is ABSURDELY FAST and RELIABLE!
- Parameter "BACKUP" save Renko History for even fast initialization on next call!
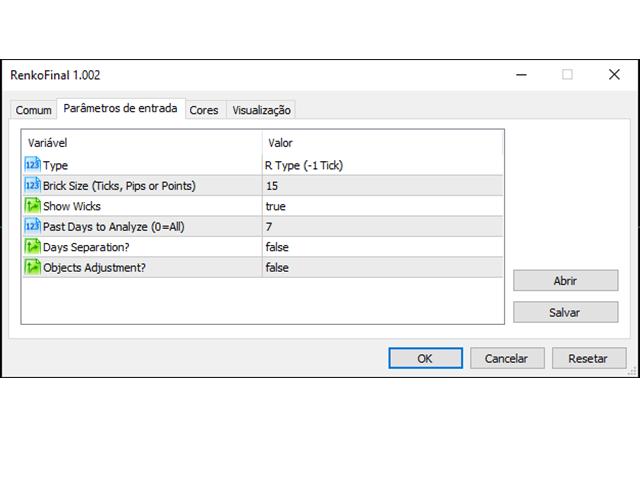
It has the following variables:
- Renko types (Ticks, Points, Pips or R);
- Show Wicks (yes / no);
- Renko size;
- How many days of history?
- Show Day Separation?
- Manage Trading ARROWS?
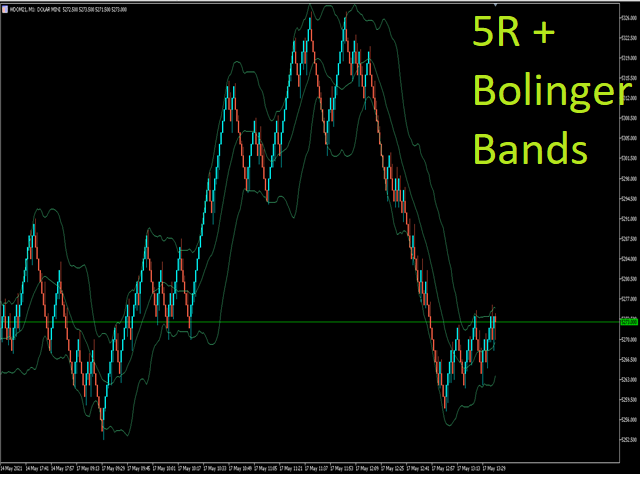
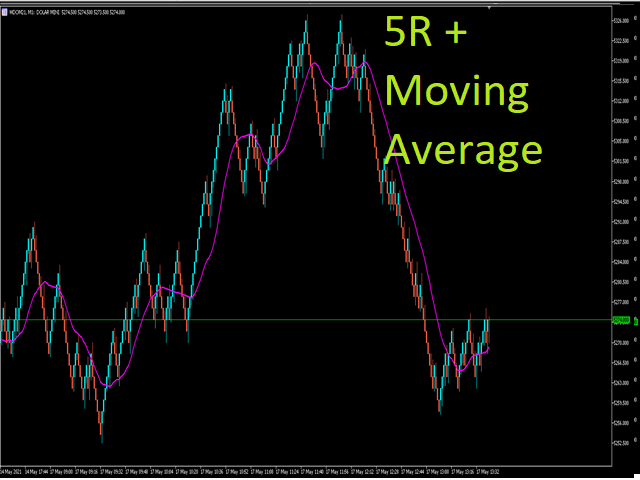
As it is an indicator, you will be able to call it through the iCustom function and apply any other indicator you want under it. To help you with programming, here are the main information:
- Close Buffer: 0
- Maximum Buffer: 1
- Minimum Buffer: 2
- Open Buffer: 3
- COLOR Buffer (1 = Neggative Candle and 2 = Positive Candle): 4
- Volume Ticks Buffer: 5
- Real Volume Buffer: 6
- Date / Time Buffer: 7
I hope this indicator is extremely useful and helps you to have great results in your negotiations !!!


Good job! The author is very responsive and friendly.