Market Reversal Alerts Dashboard MT5
- 지표
- LEE SAMSON
- 버전: 2.10
- 업데이트됨: 5 8월 2021
- 활성화: 10
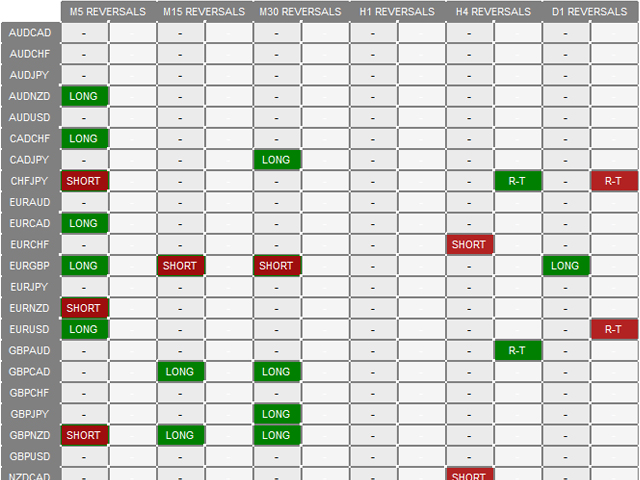
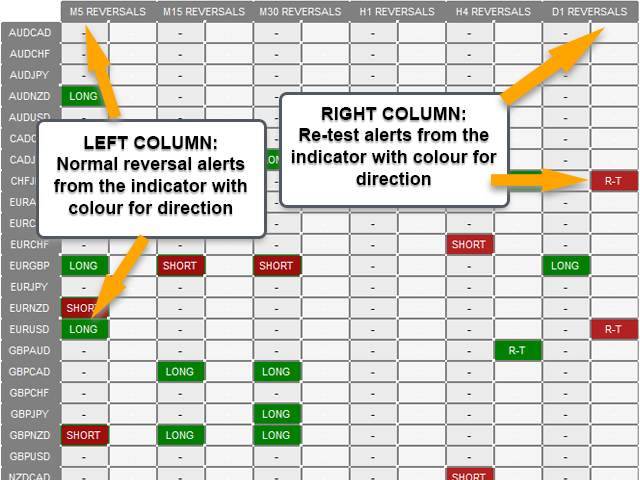
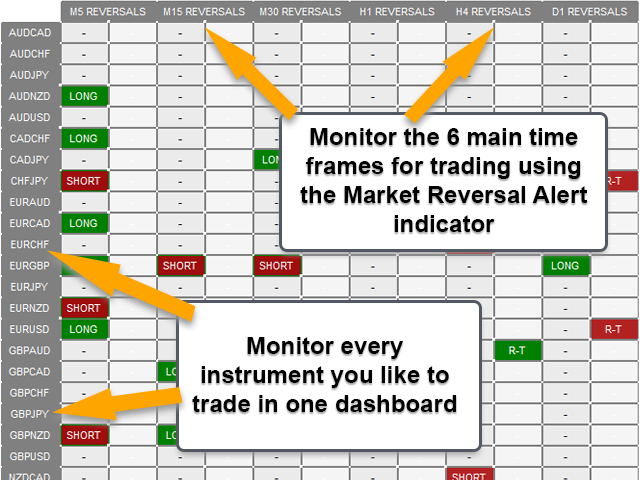
이 대시보드는 시장 구조 반전 지표와 함께 사용하기 위한 경고 도구입니다. 주요 목적은 특정 시간 프레임에 반전 기회를 알리고 지표가 하는 대로 경고의 재테스트(확인)를 알리는 것입니다. 대시보드는 자체적으로 차트에 배치되고 백그라운드에서 작동하여 선택한 쌍 및 기간에 대한 알림을 보내도록 설계되었습니다. 많은 사람들이 하나의 MT4에서 여러 차트에서 시장 반전 표시기를 실행하는 대신 여러 쌍과 시간 프레임을 한 번에 모니터링하기 위해 대시를 요청한 후 개발되었습니다. M5, M15, M30, H1, H4 및 D1 시간대에 경고합니다. 더 높은 기간은 물론 모든 거래와 마찬가지로 가장 잘 작동합니다.
사각형을 그리고 특정 쌍의 시장 구조 변화를 경고하기 위해 만든 표시기는 대시보드를 실행합니다.
대시보드를 사용하면 여러 쌍과 시간 프레임을 모니터링하고 하나의 차트를 열어 경고를 받을 수 있습니다.
이 대시보드는 시장 구조 반전 지표용 애드온으로 설계되었습니다. 독립적으로 작동하며 시장 역전 경고 표시기가 제공하는 패턴 및 신호에 대해 경고합니다.
시장 반전 경고 표시기의 MT5 버전을 여기에서 받으십시오: https://www.mql5.com/en/market/product/46295
이 대시보드의 MT4 버전은 여기: https://www.mql5.com/en/market/product/62751/
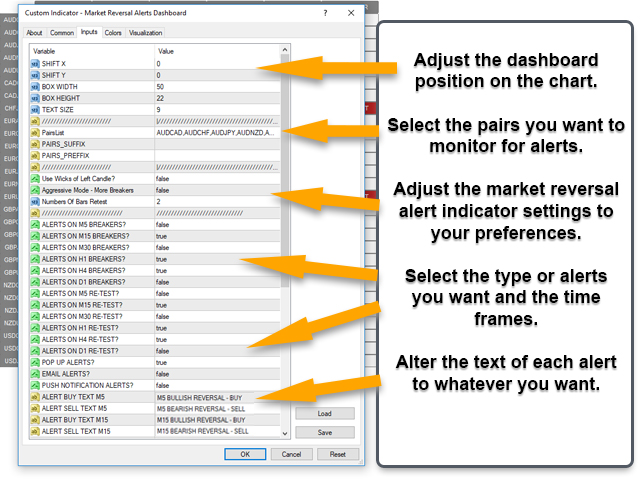
표시기 입력/설정:
대시보드의 크기와 위치를 조정합니다.
표시할 쌍을 선택하고 필요한 경우 브로커의 접미사 또는 접두사를 선택합니다.
왼쪽 심지, 공격적 모드 및 재테스트 거리 설정을 포함한 시장 반전 표시기 미세 조정 조정.
알림을 받을 시간 프레임을 선택합니다.
재테스트 알림을 수신할 시간 프레임을 선택하십시오.
경고 기본 설정, 팝업, 이메일 또는 푸시 알림 중에서 선택합니다.
필요에 따라 각 경고의 텍스트를 조정합니다.
시장 반전 경고 표시기 정보:
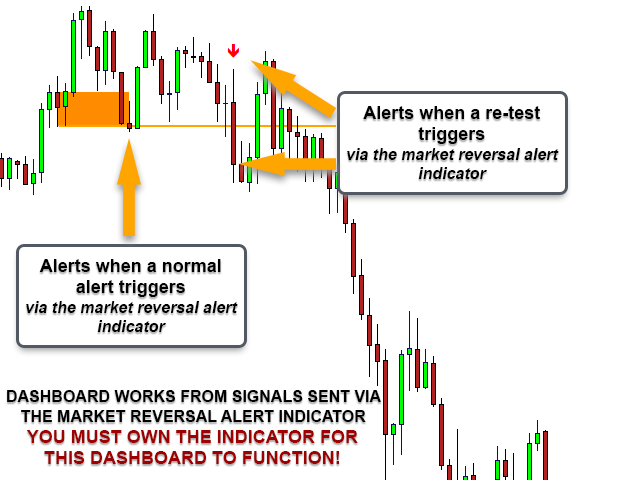
시장 구조는 다양한 전략을 위해 많은 거래자들에 의해 널리 사용됩니다. 웹에는 시장 구조에 대한 정보가 풍부하지만 기본적으로 지표는 잠재적으로 변화가 발생할 때 조기 경보를 제공하도록 설계되었습니다. 표시기는 추세 또는 움직임에 반대 색상의 양초에 직사각형을 그립니다. 이 양초는 가격이 반대 방향으로 위/아래로 마감될 때까지 한 방향으로의 지속적인 움직임을 지원하는 경향이 있습니다.
따라서 지표의 기본 전제는 하락 후 경고를 받으면 바닥이 형성되고 시장 구조의 변화가 일어나려고 할 가능성이 있다는 것입니다(반전/후퇴 - 단기 또는 장기). 물론 모든 경고가 작동하는 것은 아니며 가격이 동일한 방향(이 경우 하락)으로 계속되고 가장 최근의 저점 아래로 마감되면 표시기가 차트에서 경고를 제거하고 계속해서 새로운 구조를 그립니다.


Awesome Dashboard, works perfect in combination with the Market Reversal Indicator. Very good quality and functionality as you are used to from Lee 👍