Supports and Resistances and Order Blocks Osw MT5
- 지표
- William Oswaldo Mayorga Urduy
- 버전: 1.1
- 업데이트됨: 20 7월 2023
- 활성화: 5
SUPPORT LINES AND RESISTORS + COMMAND BLOCKS for METATRADER 5
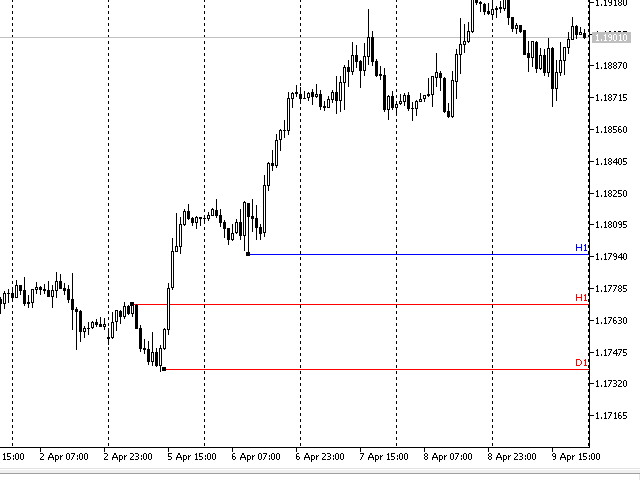
A much more pleasant visual way to locate supports and resistance, unlike normal horizontal lines, these can be located from a specific point, without extending backwards, making the graph not look good, it also shows the name of the temporality in which it was created so that when you are operating, you can know to which temporality it belongs.
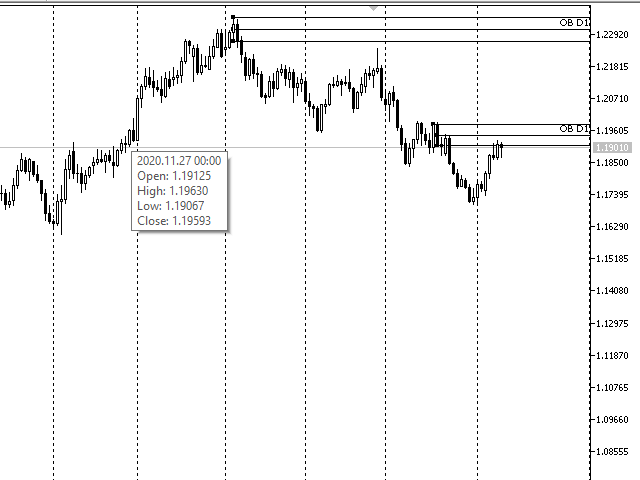
You can also create order blocks in a comfortable and visual way, where you can also see the temporality to which it belongs.
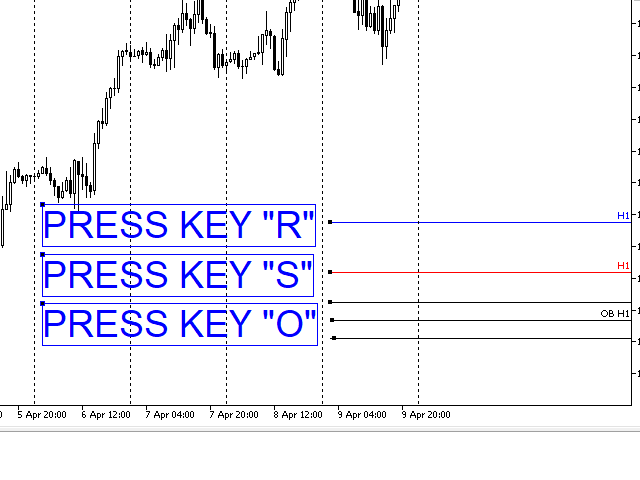
PRESS the following keys to create the lines:
"S" key = Support
"R" key = Resistance
Key "O" = Command Block
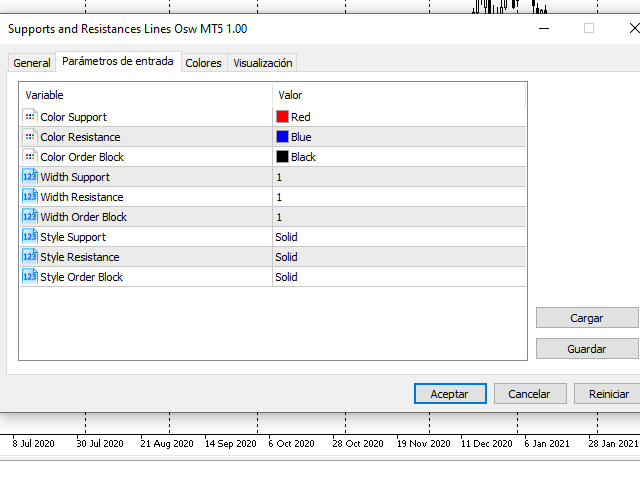
configurations:
LINES
color of support lines
color of resistor lines
width of support lines
width of resistor lines
brackets lines style
style of the resistors lines
ORDER BLOCKS
color of the order blocks
order block width
order block style